Marktübersicht für intelligentes Pendeln, Wachstum, Trends, Analyse, Forschungsbericht (2021-2028)
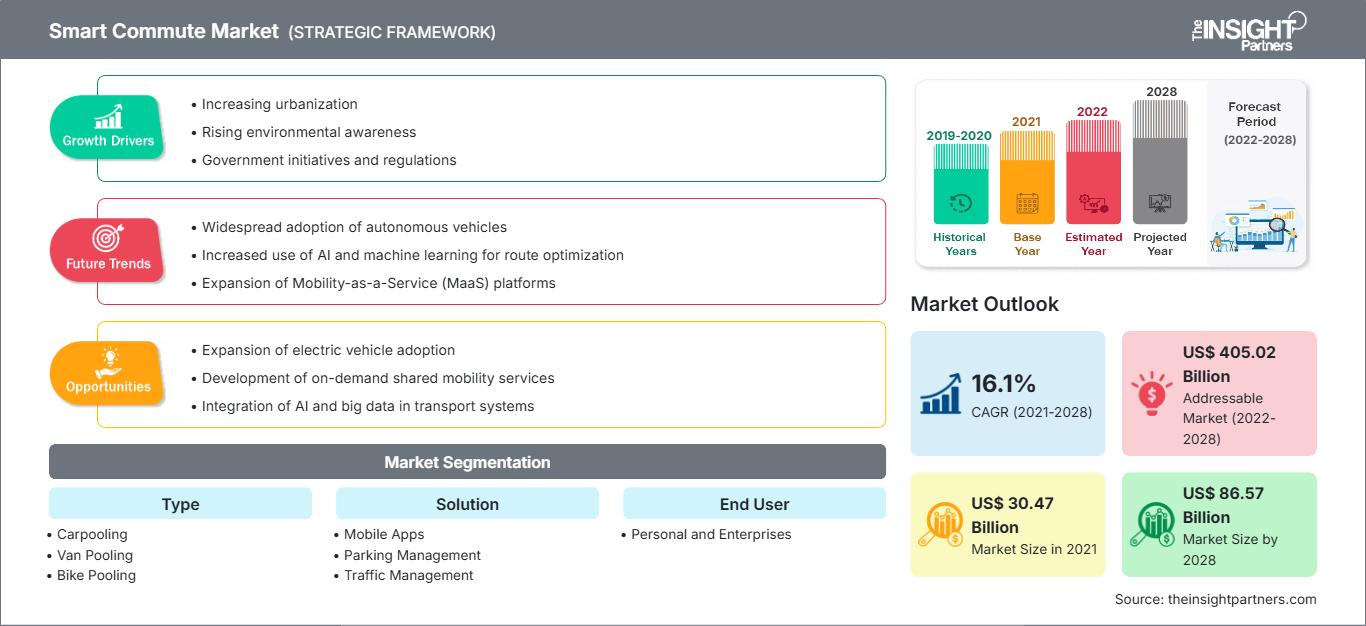
Historische Daten : 2019-2020 | Basisjahr : 2021 | Prognosezeitraum : 2022-2028Marktprognose für intelligentes Pendeln bis 2028 – Auswirkungen von COVID-19 und globale Analyse nach Typ (Carpooling, Van-Pooling, Bike-Pooling, U-Bahn und andere), Lösung (mobile Apps, Parkraummanagement, Verkehrsmanagement und andere) und Endbenutzer (Privatpersonen und Unternehmen)
- Status : Veröffentlicht
- Berichtscode : TIPRE00009536
- Kategorie : Automobil- und Transportwesen
- Anzahl der Seiten : 155
- Verfügbare Berichtsformate :


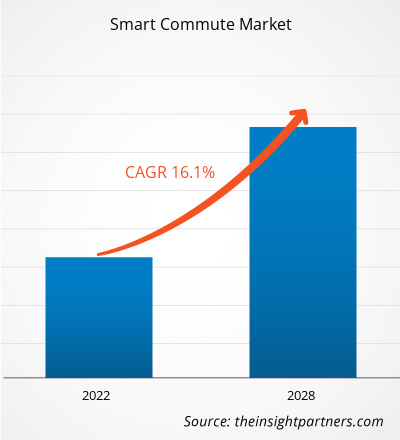
Der Markt für intelligentes Pendeln soll von 30.469,49 Millionen US-Dollar im Jahr 2021 auf 86.568,73 Millionen US-Dollar im Jahr 2028 wachsen; die durchschnittliche jährliche Wachstumsrate (CAGR) von 16,1 % wird von 2021 bis 2028 geschätzt.
Intelligentes Pendeln bedeutet regelmäßiges Reisen per Fahrgemeinschaft, Vanpooling, Fahrrad oder U-Bahn. Öffentliche Verkehrsbetriebe, Regierungen und andere Interessengruppen haben eine umfassende Strategie entwickelt, die intelligentes Reisen berücksichtigt und der Öffentlichkeit zugänglich macht, um leistungsfähigere Verkehrsmittel in Metropolregionen zu schaffen. Intelligentes Pendeln wirkt sich positiv auf die Umwelt aus, indem es Verkehrsstaus verringert und Treibhausgasemissionen reduziert.
Fahrgemeinschaften, Bikesharing, Vanpooling und andere umweltfreundliche Pendeloptionen sind über intelligente Pendeldienste verfügbar. Büroangestellte können so effizienter pendeln und so Verkehrsstaus und Transportkosten reduzieren. Einer der Faktoren, die das Wachstum des Marktes für intelligentes Pendeln ankurbeln, ist die steigende Zahl von Stadtbewohnern, die zu einem Anstieg der Generationenraten führt. Gemeinsam genutzte Transportdienste erfreuen sich allgemeiner Akzeptanz und werden von Regierungen und Umweltverbänden gefördert, da sie zur Emissionsreduzierung beitragen. Sie ermöglichen weniger Privatautos, was das Wachstum des Marktes für intelligentes Pendeln in den kommenden Jahren voraussichtlich ankurbeln wird.
In Nordamerika wurde der Bedarf an intelligentem Pendeln durch die zunehmende Präferenz von Fahrgemeinschaften unter Büropendlern angeheizt, die Verkehrsstaus verringern und Umweltschäden vorbeugen. Darüber hinaus sind ein Aufschwung in der Tourismusbranche, technologische Fortschritte und eine positive Regierungspolitik weitere Faktoren, die das Wachstum des nordamerikanischen Marktes für intelligentes Pendeln vorantreiben. In Europa dürften der zunehmende Trend zu Mobilität als Dienstleistung und die wachsende Nutzerbasis von Mitfahrdiensten lukrative Möglichkeiten für die Marktteilnehmer schaffen.
In Europa erfreuen sich Smart Commuters aufgrund wachsender Sorgen über die globale Erwärmung, Verkehrsstaus und die Abhängigkeit von ausländischer Energie zunehmender Beliebtheit. Die 2012 eingeführte Praxis, Mautgebühren für Autos mit nur einem Insassen zu erheben, hat zu einem enormen Anstieg der Nutzung von Smart Commutes durch europäische Verbraucher geführt.
Passen Sie diesen Bericht Ihren Anforderungen an
Sie erhalten kostenlos Anpassungen an jedem Bericht, einschließlich Teilen dieses Berichts oder einer Analyse auf Länderebene, eines Excel-Datenpakets sowie tolle Angebote und Rabatte für Start-ups und Universitäten.
Markt für intelligentes Pendeln: Strategische Einblicke
-
Holen Sie sich die wichtigsten Markttrends aus diesem Bericht.Dieses KOSTENLOSE Beispiel umfasst Datenanalysen, die von Markttrends bis hin zu Schätzungen und Prognosen reichen.
Auswirkungen der COVID-19-Pandemie auf den Markt für intelligentes Pendeln
Der COVID-19-Ausbruch hatte erhebliche Auswirkungen auf den Transportsektor. Die Nachfrage nach Fahrgemeinschaften und Vanpooling-Diensten ging 2020 aufgrund von COVID-19 weltweit zurück. Der weltweite Markt für intelligentes Pendeln verzeichnete 2020 im Vergleich zu 2019 einen erheblichen Umsatzrückgang, teilweise aufgrund der Lockdowns und der Zurückhaltung der Kunden, Mitfahrdienste zu nutzen, selbst nachdem die Beschränkungen aufgehoben wurden. Mitfahrunternehmen versuchen stets, das Vertrauen von Fahrern und Fahrgästen in Bezug auf Sicherheit und Hygiene aufrechtzuerhalten.
Markteinblicke – Markt für intelligentes Pendeln
Mobilität als Dienstleistung wächst
Menschen, die sich kein Auto leisten können, können dank Mobilitätsdiensten problemlos reisen. Laut dem Bureau of Transportation Statistics betragen die durchschnittlichen Kosten für den Besitz und Betrieb eines Fahrzeugs rund 8.858 US-Dollar bei einer angenommenen Fahrt von 15.000 Kilometern pro Jahr. Mobilität als Dienstleistung reduziert diese Kosten für den Nutzer, indem sie die Nutzung von Transportdiensten wie Fahrgemeinschaften und Mitfahrdiensten maximiert. Außerdem werden Verkehrsstaus und die Gesamtemissionen von Autos in Städten reduziert. Digital unterstützte Fahrgemeinschaften und Mitfahrdienste verwalten den Transportbedarf effizient und bieten eine bequeme und umweltfreundliche Alternative zum privaten Autobesitz. Laut Statistik leben derzeit 55 % der Weltbevölkerung in Städten, und Schätzungen zufolge werden bis 2050 rund 68 % der Bevölkerung in Städten leben. Die rasante Urbanisierung führt bereits jetzt zu Verkehrsstaus. Das Konzept „Mobility as a Service“ (MaaS) könnte durch eine stärkere Nutzung der bestehenden öffentlichen und privaten Verkehrsinfrastruktur die bessere Wahl zur Reduzierung von Verkehrsstaus sein. Der dringende Bedarf an effektiven Lösungen für eine schnellere, kostengünstigere und bequemere Verkehrsabwicklung in Smart Cities dürfte das Wachstum des MaaS-Marktes bis 2028 ankurbeln. Daher wird erwartet, dass der zunehmende Trend zu „Mobility as a Service“ (MaaS) das Wachstum des globalen Marktes für intelligentes Pendeln vorantreiben wird.
Markteinblicke in intelligentes Pendeln nach Typen
Basierend auf den Typen ist der Markt für intelligentes Pendeln in Fahrgemeinschaften, Vanpooling, Fahrradpooling, U-Bahn und andere unterteilt. Das Fahrgemeinschaftssegment wird voraussichtlich einen bedeutenden Anteil am globalen Markt für intelligentes Pendeln einnehmen und voraussichtlich mit der höchsten durchschnittlichen jährlichen Wachstumsrate wachsen. Smartes Pendeln ist definiert als regelmäßiges Reisen von einem Ort zum anderen per Fahrgemeinschaft, Vanpooling, Fahrrad oder U-Bahn.
Lösungsbasierte Markteinblicke zum intelligenten Pendeln
Basierend auf den Lösungen ist der Markt für intelligentes Pendeln in mobile Apps, Parkraummanagement, Verkehrsmanagement und andere segmentiert. Das Segment mobile Apps wird voraussichtlich einen bedeutenden Anteil am globalen Markt für intelligentes Pendeln halten und voraussichtlich mit der höchsten CAGR wachsen. Mobile Anwendungen werden zunehmend im Autoverkehr genutzt, um Reisezeit, Kosten und Fahrzeugemissionen zu reduzieren.
Endnutzerbasierte Markteinblicke zum intelligenten Pendeln
Basierend auf den Endnutzern ist der Markt für intelligentes Pendeln in Privatpersonen und Unternehmen unterteilt. Das Segment Unternehmen wird voraussichtlich einen bedeutenden Anteil am globalen Markt für intelligentes Pendeln halten und voraussichtlich mit einer höheren CAGR wachsen.
Markt für intelligentes Pendeln
Die Analysten von The Insight Partners haben die regionalen Trends und Faktoren, die den Markt für intelligentes Pendeln im Prognosezeitraum beeinflussen, ausführlich erläutert. In diesem Abschnitt werden auch die Marktsegmente und die geografische Lage in Nordamerika, Europa, dem asiatisch-pazifischen Raum, dem Nahen Osten und Afrika sowie Süd- und Mittelamerika erörtert.Umfang des Marktberichts zum intelligenten Pendeln
| Berichtsattribut | Einzelheiten |
|---|---|
| Marktgröße in 2021 | US$ 30.47 Billion |
| Marktgröße nach 2028 | US$ 86.57 Billion |
| Globale CAGR (2021 - 2028) | 16.1% |
| Historische Daten | 2019-2020 |
| Prognosezeitraum | 2022-2028 |
| Abgedeckte Segmente |
By Typ
|
| Abgedeckte Regionen und Länder |
Nordamerika
|
| Marktführer und wichtige Unternehmensprofile |
|
Dichte der Marktteilnehmer für intelligentes Pendeln: Die Auswirkungen auf die Geschäftsdynamik verstehen
Der Markt für intelligentes Pendeln wächst rasant. Dies wird durch die steigende Nachfrage der Endnutzer aufgrund veränderter Verbraucherpräferenzen, technologischer Fortschritte und eines stärkeren Bewusstseins für die Produktvorteile vorangetrieben. Mit der steigenden Nachfrage erweitern Unternehmen ihr Angebot, entwickeln Innovationen, um den Bedürfnissen der Verbraucher gerecht zu werden, und nutzen neue Trends, was das Marktwachstum weiter ankurbelt.
- Holen Sie sich die Markt für intelligentes Pendeln Übersicht der wichtigsten Akteure
Akteure auf dem Markt für intelligentes Pendeln konzentrieren sich hauptsächlich auf die Entwicklung fortschrittlicher und effizienter Produkte.
- Im Januar 2022 beabsichtigt Tummoc, ein multimodales Mobilitätsunternehmen, seine Geschäftstätigkeit bis 2022 auf zehn weitere Städte auszuweiten, darunter Delhi und Mumbai.
- Im April 2021 hat ein städtisches Mobilitätsunternehmen eine App-Plattform entwickelt, die erstmals Routen mit Preisen integriert und dabei Bus, U-Bahn, Uber, Yulu und andere Optionen für die letzte Meile kombiniert.
Unternehmensprofil
:- BlaBlaCar
- CommuteSmart
- Enterprise Holdings Inc
- ePoolers Technologies Pvt. Ltd
- Golden Concord Holdings Limited
- Oakland Smart Commute
- Quick Ride
- Transhelp Technologies Pvt Ltd
- Uber Technologies Inc.
- Smart Commute

Naveen ist ein erfahrener Marktforschungs- und Beratungsexperte mit über 9 Jahren Erfahrung in kundenspezifischen, syndizierten und Beratungsprojekten. In seiner aktuellen Funktion als Associate Vice President hat er erfolgreich Stakeholder entlang der gesamten Projektwertschöpfungskette gemanagt und ist Autor von über 100 Forschungsberichten und über 30 Beratungsaufträgen. Seine Arbeit erstreckt sich auf Industrie- und Regierungsprojekte und trägt maßgeblich zum Kundenerfolg und zur datengesteuerten Entscheidungsfindung bei.
Naveen hat einen Ingenieursabschluss in Elektronik und Kommunikation von der VTU, Karnataka, und einen MBA in Marketing und Operations von der Manipal University. Er ist seit 9 Jahren aktives IEEE-Mitglied und nimmt an Konferenzen und technischen Symposien teil und engagiert sich ehrenamtlich auf Sektions- und regionaler Ebene. Vor seiner aktuellen Position arbeitete er als Associate Strategic Consultant bei IndustryARC und als Industrial Server Consultant bei Hewlett Packard (HP Global).
- Historische Analyse (2 Jahre), Basisjahr, Prognose (7 Jahre) mit CAGR
- PEST- und SWOT-Analyse
- Marktgröße Wert/Volumen – Global, Regional, Land
- Branchen- und Wettbewerbslandschaft
- Excel-Datensatz
Erfahrungsberichte
Der SCADA-Systemmarktbericht von Insight Partners ist umfassend und bietet wertvolle Einblicke in aktuelle Trends und Zukunftsprognosen. Das Team war durchweg hochprofessionell, reaktionsschnell und hilfsbereit. Wir sind sehr zufrieden und können die Dienstleistungen wärmstens empfehlen.
RAN KEDEM Partner, Reali Technologies LTDsIch habe einen Bericht über einen sehr spezifischen Softwaremarkt angefordert, und das Team hat ihn innerhalb weniger Tage erstellt. Die Informationen waren sehr relevant und gut präsentiert. Anschließend habe ich einige Änderungen und Ergänzungen zum Bericht angefordert. Das Team reagierte erneut sehr schnell, und ich erhielt den Abschlussbericht in weniger als einer Woche.
JEAN-HERVE JENN Vorsitzende, Future AnalyticaWir haben mit The Insight Partners für eine wichtige Marktstudie und Prognose zusammengearbeitet. Sie gaben uns klare Einblicke in Chancen und Risiken, die uns bei der Gestaltung unserer Pläne halfen. Ihre Recherchen waren benutzerfreundlich und basierten auf soliden Daten. Sie halfen uns, kluge und sichere Entscheidungen zu treffen. Wir können sie wärmstens empfehlen.
PIYUSH NAGPAL Sr. Vizepräsident, Fernlicht GlobalDie Insight Partners lieferten aufschlussreiche, gut strukturierte Marktforschung mit fundierter Fachkompetenz. Ihr Team war durchweg professionell und reaktionsschnell. Die benutzerfreundliche Website ermöglichte den Zugriff auf Branchenberichte. Wir empfehlen sie wärmstens für zuverlässige und hochwertige Forschungsdienstleistungen.
YUKIHIKO ADACHI Geschäftsführer, Deep Blue, LLC.Dies ist das erste Mal, dass ich einen Marktbericht von The Insight Partners erworben habe. Obwohl ich zunächst unsicher war, besuchte ich die Website und fühlte mich dann sicherer, das Risiko einzugehen und einen Marktbericht zu kaufen. Ich bin mit der Qualität des Berichts und dem Kundenservice rundum zufrieden. Ich hatte einige Fragen und Anmerkungen zum ersten Bericht, aber nach einigen E-Mail-Gesprächen mit dem Analysten bin ich überzeugt, dass ich einen Bericht habe, den ich als Input für unseren strategischen Planungsprozess verwenden kann. Vielen Dank, dass Sie sich die Zeit genommen und dies zu einer positiven Erfahrung gemacht haben. Ich werde Ihren Service auf jeden Fall weiterempfehlen und Sie werden meine erste Anlaufstelle sein, wenn wir weitere Marktdaten benötigen.
JOHN SUZUKI Präsident und Chief Executive Officer, Vorstandsmitglied, BK TechnologiesIch möchte mich für Ihre Unterstützung und die Professionalität bedanken, die Sie bei der Bearbeitung meiner Informationsanfrage zum IVD-Markt für Infektionskrankheiten in Nigeria gezeigt haben. Ich schätze Ihre Geduld, Ihre Beratung und die Tatsache, dass Sie bereit waren, einen Rabatt anzubieten, der uns schließlich den Abschluss eines Geschäfts ermöglichte. Ich freue mich darauf, The Insight Partners in Zukunft wieder zu beauftragen, dank des Eindrucks, den Sie bei dieser ersten Begegnung bei mir hinterlassen haben.
DR. CHIJIOKE ONYIA GESCHÄFTSFÜHRERIN, PineCrest Healthcare Ltd.Grund zum Kauf
- Fundierte Entscheidungsfindung
- Marktdynamik verstehen
- Wettbewerbsanalyse
- Kundeneinblicke
- Marktprognosen
- Risikominimierung
- Strategische Planung
- Investitionsbegründung
- Identifizierung neuer Märkte
- Verbesserung von Marketingstrategien
- Steigerung der Betriebseffizienz
- Anpassung an regulatorische Trends


Exklusive Berichtsrabatte freischalten
Jetzt anfragen


 Kostenlose Probe anfordern für - Markt für intelligentes Pendeln