Conmutación inteligente Descripción general del mercado, crecimiento, tendencias, análisis, informe de investigación (2021-2028)
Datos históricos : 2019-2020 | Año base : 2021 | Período de pronóstico : 2022-2028Pronóstico del mercado de viajes inteligentes hasta 2028: impacto de la COVID-19 y análisis global por tipo (coche compartido, furgoneta compartida, bicicleta compartida, metro y otros), solución (aplicaciones móviles, gestión de aparcamientos, gestión del tráfico y otros) y usuario final (particulares y empresas).
- Estado : Publicada
- Código de informe : TIPRE00009536
- Categoría : Automoción y transporte
- Número de páginas : 155
- Formatos de informe disponibles :


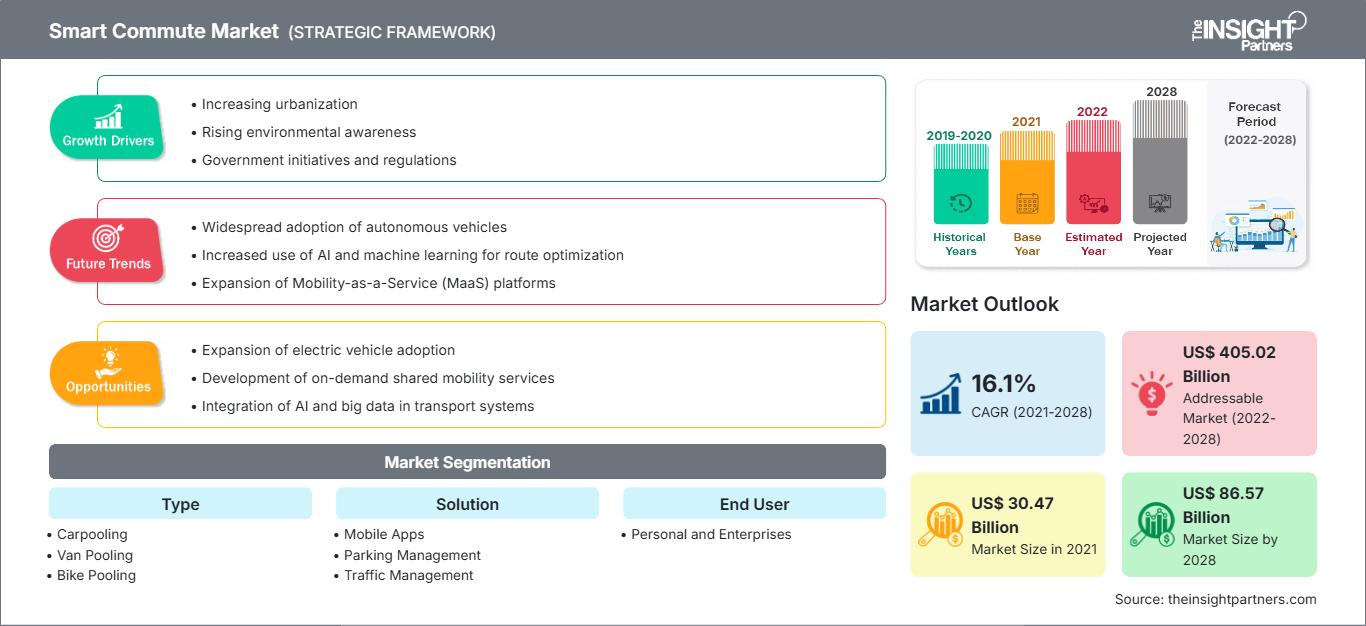
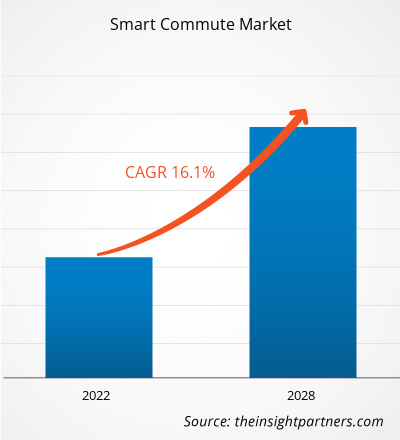
Se espera que el mercado de viajes inteligentes crezca de US$ 30.469,49 millones en 2021 a US$ 86.568,73 millones en 2028; se estima que crecerá a una CAGR del 16,1% entre 2021 y 2028.
El desplazamiento inteligente se define como viajar regularmente en coche compartido, furgoneta compartida, bicicleta, ciclista o metro. Las empresas de transporte público, los gobiernos y otras partes interesadas han desarrollado una estrategia integral que considera el desplazamiento inteligente y la comparte con la ciudadanía para construir un transporte más eficiente en las regiones metropolitanas. El desplazamiento inteligente tiene un impacto positivo en el medio ambiente al reducir la congestión vehicular y las emisiones de gases de efecto invernadero.
Los servicios de transporte inteligente ofrecen opciones de coche compartido, bicicleta compartida, furgoneta compartida y otras opciones de desplazamiento respetuosas con el medio ambiente. Ofrecen a los trabajadores de oficina una opción de transporte para elegir una ruta más eficaz que reduce la congestión del tráfico y los gastos de transporte. Uno de los factores que impulsa el crecimiento del mercado de los desplazamientos inteligentes es el creciente número de habitantes urbanos, lo que conlleva un aumento de las tasas generacionales. Los servicios de transporte compartido han ganado aceptación universal y están siendo fomentados por gobiernos y organismos ambientales, ya que ayudan a reducir las emisiones. Permiten una menor utilización de vehículos privados, lo que se espera que impulse el crecimiento del mercado de los desplazamientos inteligentes en los próximos años.
En Norteamérica, la necesidad de desplazamientos inteligentes se ha visto impulsada por la creciente preferencia por los servicios de coche compartido entre los trabajadores de oficina, lo que aliviaría la congestión vehicular y evitaría daños ambientales. Además, el auge de la industria turística, los avances tecnológicos y las políticas gubernamentales favorables son otros factores que impulsan el crecimiento del mercado de desplazamientos inteligentes en Norteamérica. En Europa, se espera que el auge de la movilidad como servicio y el aumento de la base de usuarios de servicios de transporte compartido generen oportunidades lucrativas para los actores del mercado.
En Europa, debido a la creciente preocupación por el calentamiento global, la congestión vial y la dependencia de energía extranjera, los desplazamientos inteligentes son cada vez más populares. La práctica de cobrar peajes a los automóviles con un solo ocupante, impuesta en 2012, ha provocado un gran aumento en el uso de estos desplazamientos entre los consumidores europeos.
Personalice este informe según sus necesidades
Obtendrá personalización en cualquier informe, sin cargo, incluidas partes de este informe o análisis a nivel de país, paquete de datos de Excel, así como también grandes ofertas y descuentos para empresas emergentes y universidades.
Mercado de viajes inteligentes: Perspectivas estratégicas
-
Obtenga las principales tendencias clave del mercado de este informe.Esta muestra GRATUITA incluirá análisis de datos, desde tendencias del mercado hasta estimaciones y pronósticos.
:
Impacto de la pandemia de COVID-19 en el mercado de los viajes inteligentes
El brote de COVID-19 tuvo un impacto significativo en el sector del transporte. La demanda de servicios de coche compartido y furgoneta compartida se redujo a nivel mundial en 2020 debido a la COVID-19. El mercado mundial de desplazamientos inteligentes experimentó una disminución considerable en la generación de ingresos en 2020 en comparación con 2019, en parte debido a los confinamientos y a la reticencia de los clientes a utilizar servicios de transporte compartido, incluso después del levantamiento de las regulaciones. Las empresas de transporte compartido siempre se esfuerzan por mantener la confianza de conductores y pasajeros en términos de seguridad e higiene.
Perspectivas del mercado: Mercado de desplazamientos inteligentes
Tendencia creciente de la movilidad como servicio
Las personas que no pueden comprar un coche pueden disfrutar de viajes sin complicaciones gracias a los servicios de movilidad. Según la Oficina de Estadísticas de Transporte, el coste medio de poseer y operar un vehículo es de aproximadamente 8.858 dólares, suponiendo un recorrido de 15.000 kilómetros al año. La movilidad como servicio reduce estos costes para el usuario al maximizar el uso de servicios de transporte como el coche compartido y el servicio de transporte con conductor. También reduce la congestión del tráfico y las emisiones totales de los automóviles en las ciudades. Como resultado, el coche compartido y el servicio de transporte con conductor digital gestionan eficientemente la demanda de transporte y ofrecen una alternativa cómoda y respetuosa con el medio ambiente a la propiedad de un coche privado. Además, según las estadísticas, el 55% de la población mundial vive actualmente en ciudades, y se estima que para 2050, aproximadamente el 68% de la población vivirá en ciudades. El rápido ritmo de urbanización ya está provocando congestión del tráfico. El concepto de movilidad como servicio (MaaS) puede ser una mejor opción para reducir la congestión del tráfico al hacer un mayor uso de la infraestructura de transporte pública y privada existente. Se espera que la demanda urgente de soluciones efectivas para gestionar el tráfico en ciudades inteligentes de una manera más rápida, menos costosa y más conveniente impulse el crecimiento del mercado de MaaS para 2028. Por lo tanto, se espera que la creciente tendencia de movilidad como servicio (MaaS) impulse el crecimiento del mercado global de viajes inteligentes.
Perspectivas del mercado de viajes inteligentes basados en tipos
Según el tipo, el mercado de viajes inteligentes se segmenta en coche compartido, furgoneta compartida, bicicleta compartida, metro y otros. Se prevé que este segmento ocupe una cuota significativa en el mercado global de viajes inteligentes y que crezca a la tasa de crecimiento anual compuesta (TCAC) más alta. El viaje inteligente se define como viajar regularmente de un punto a otro en coche compartido, furgoneta compartida, bicicleta, ciclistas o metro.
Perspectivas del mercado de los desplazamientos inteligentes basados en soluciones
Según la solución, el mercado de los viajes inteligentes se segmenta en aplicaciones móviles, gestión de aparcamientos, gestión del tráfico, etc. Se prevé que este segmento ocupe una cuota significativa en el mercado global de viajes inteligentes y que crezca a la tasa de crecimiento anual compuesta (TCAC) más alta. El uso de aplicaciones móviles en los viajes en automóvil es cada vez mayor para reducir el tiempo de viaje, el coste y las emisiones de los vehículos.
Perspectivas del mercado de viajes inteligentes basados en el usuario final
Según el usuario final, el mercado de viajes inteligentes se divide en particulares y empresas. Se prevé que el segmento empresarial ocupe una cuota significativa en el mercado global de viajes inteligentes y que crezca a una tasa de crecimiento anual compuesta (TCAC) más alta.
Perspectivas regionales del mercado de viajes inteligentes
Los analistas de The Insight Partners han explicado detalladamente las tendencias regionales y los factores que influyen en el mercado de los desplazamientos inteligentes durante el período de pronóstico. Esta sección también analiza los segmentos y la geografía del mercado de los desplazamientos inteligentes en Norteamérica, Europa, Asia Pacífico, Oriente Medio y África, y Sudamérica y Centroamérica.
Alcance del informe de mercado de viajes inteligentes
| Atributo del informe | Detalles |
|---|---|
| Tamaño del mercado en 2021 | US$ 30.47 mil millones |
| Tamaño del mercado en 2028 | US$ 86.57 mil millones |
| CAGR global (2021-2028) | 16,1% |
| Datos históricos | 2019-2020 |
| Período de pronóstico | 2022-2028 |
| Segmentos cubiertos |
Por tipo
|
| Regiones y países cubiertos |
América del norte
|
| Líderes del mercado y perfiles de empresas clave |
|
Densidad de actores del mercado de viajes inteligentes: comprensión de su impacto en la dinámica empresarial
El mercado de los viajes inteligentes está creciendo rápidamente, impulsado por la creciente demanda de los usuarios finales debido a factores como la evolución de las preferencias de los consumidores, los avances tecnológicos y un mayor conocimiento de los beneficios del producto. A medida que aumenta la demanda, las empresas amplían su oferta, innovan para satisfacer las necesidades de los consumidores y aprovechan las tendencias emergentes, lo que impulsa aún más el crecimiento del mercado.
- Obtenga una descripción general de los principales actores clave del mercado de Smart Commute
Los actores que operan en el mercado de viajes inteligentes se centran principalmente en el desarrollo de productos avanzados y eficientes.
- En enero de 2022, Tummoc, una empresa de movilidad multimodal, tiene la intención de expandir sus operaciones a otras diez ciudades para 2022, incluidas Delhi y Mumbai.
- En abril de 2021, una empresa de movilidad urbana creó una plataforma de aplicaciones que integra rutas con precios por primera vez, combinando el autobús, el metro, Uber, Yulu y otras opciones de última milla.
Perfil de la empresa
:
- BlaBlaCar
- Viaje inteligente
- Enterprise Holdings Inc
- ePoolers Technologies Pvt. Ltd
- Golden Concord Holdings Limited
- Viaje inteligente al trabajo en Oakland
- Paseo rápido
- Transhelp Technologies Pvt Ltd
- Tecnologías Uber Inc.
- Viaje inteligente

Naveen es un experimentado profesional en investigación de mercados y consultoría con más de 9 años de experiencia en proyectos personalizados, sindicados y de consultoría. Actualmente se desempeña como Vicepresidente Asociado, donde ha gestionado con éxito a las partes interesadas en toda la cadena de valor del proyecto y ha redactado más de 100 informes de investigación y más de 30 proyectos de consultoría. Su trabajo abarca proyectos industriales y gubernamentales, contribuyendo significativamente al éxito de los clientes y a la toma de decisiones basada en datos.
Naveen es licenciado en Ingeniería Electrónica y Comunicaciones por la VTU (Karnataka) y tiene un MBA en Marketing y Operaciones por la Universidad de Manipal. Ha sido miembro activo del IEEE durante 9 años, participando en conferencias, simposios técnicos y realizando voluntariado tanto a nivel de sección como regional. Antes de su puesto actual, trabajó como Consultor Estratégico Asociado en IndustryARC y como Consultor de Servidores Industriales en Hewlett Packard (HP Global).
- Análisis histórico (2 años), año base, pronóstico (7 años) con CAGR
- Análisis PEST y FODA
- Tamaño del mercado, valor/volumen: global, regional y nacional
- Industria y panorama competitivo
- Conjunto de datos de Excel
Testimonios
El informe de mercado de sistemas SCADA de Insight Partners es completo y ofrece información valiosa sobre las tendencias actuales y las previsiones futuras. El equipo fue altamente profesional, receptivo y me brindó un gran apoyo en todo momento. Estamos muy satisfechos y recomendamos ampliamente sus servicios.
RAN KEDEM Socio, Reali Technologies LTDsSolicité un informe sobre un mercado de software muy específico y el equipo lo elaboró en pocos días. La información era muy relevante y estaba bien presentada. Posteriormente, solicité algunos cambios y adiciones al informe. El equipo fue muy receptivo y recibí el informe final en menos de una semana.
JEAN-HERVE JENN Presidente, Future AnalyticaTrabajamos con The Insight Partners para un importante estudio y pronóstico de mercado. Nos brindaron una visión clara de las oportunidades y los riesgos, lo que nos ayudó a definir nuestros planes. Su investigación fue fácil de usar y se basó en datos sólidos. Nos ayudó a tomar decisiones inteligentes y seguras. Los recomendamos ampliamente.
PIYUSH NAGPAL Vicepresidente Sénior, , High Beam GlobalThe Insight Partners realizó una investigación de mercado profunda y bien estructurada con una sólida experiencia en el sector. Su equipo fue profesional y receptivo en todo momento. El sitio web, fácil de usar, facilitó el acceso a los informes del sector. Los recomendamos ampliamente por sus servicios de investigación confiables y de alta calidad.
YUKIHIKO ADACHI Director Ejecutivo, , Deep Blue, LLCEsta es la primera vez que compro un informe de mercado de The Insight Partners. Aunque al principio tenía dudas, visité su sitio web y me sentí más cómodo al arriesgarme y comprarlo. Estoy completamente satisfecho con la calidad del informe y el servicio al cliente. Tenía varias preguntas y comentarios sobre el informe inicial, pero después de un par de conversaciones por correo electrónico con su analista, creo que tengo un informe que puedo usar como base para nuestro proceso de planificación estratégica. Muchas gracias por tomarse el tiempo y hacer de esta una experiencia positiva. Sin duda, recomendaré sus servicios y serán mi primera opción cuando necesitemos más datos de mercado.
JOHN SUZUKI Presidente y Director Ejecutivo, Director de la Junta Directiva, BK TechnologiesAgradezco su apoyo y la profesionalidad que demostraron al atender mi solicitud de información sobre el mercado de diagnóstico in vitro (IVD) para enfermedades infecciosas en Nigeria. Agradezco su paciencia, su orientación y su disposición a ofrecerme un descuento, lo que finalmente nos permitió cerrar un trato. Espero poder colaborar con The Insight Partners en el futuro, gracias a la impresión que me causó este primer encuentro.
DRA. CHIJIOKE ONYIA, DIRECTORA GENERAL, PineCrest Healthcare Ltd.Razón para comprar
- Toma de decisiones informada
- Comprensión de la dinámica del mercado
- Análisis competitivo
- Información sobre clientes
- Pronósticos del mercado
- Mitigación de riesgos
- Planificación estratégica
- Justificación de la inversión
- Identificación de mercados emergentes
- Mejora de las estrategias de marketing
- Impulso de la eficiencia operativa
- Alineación con las tendencias regulatorias


Desbloquea descuentos exclusivos en informes
Consultar ahora


 Obtenga una muestra gratuita para - Mercado de desplazamientos inteligentes