Aperçu du marché des déplacements intelligents, croissance, tendances, analyse, rapport de recherche (2021-2028)
Données historiques : 2019-2020 | Année de référence : 2021 | Période de prévision : 2022-2028Prévisions du marché des transports intelligents jusqu'en 2028 - Impact de la COVID-19 et analyse globale par type (covoiturage, covoiturage en fourgonnette, covoiturage à vélo, métro et autres), solution (applications mobiles, gestion du stationnement, gestion du trafic et autres) et utilisateur final (particuliers et entreprises)
- Statut : Publié
- Code du rapport : TIPRE00009536
- Catégorie : Automobile et transport
- Nombre de pages : 155
- Formats de rapport disponibles :


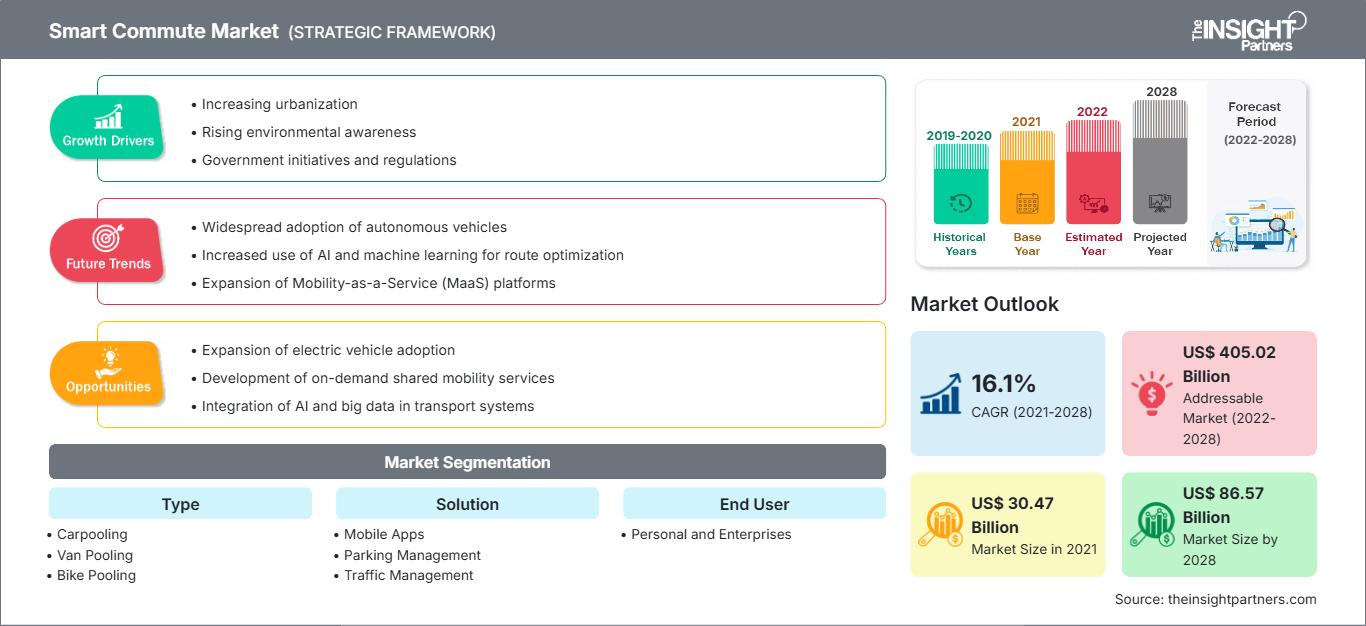
Le marché des déplacements intelligents devrait passer de 30 469,49 millions de dollars américains en 2021 à 86 568,73 millions de dollars américains d'ici 2028 ; sa croissance est estimée à un TCAC de 16,1 % entre 2021 et 2028.
Les déplacements intelligents sont définis comme des déplacements réguliers en covoiturage, en covoiturage, à vélo, à vélo ou en métro. Les sociétés de transport en commun, les gouvernements et d'autres parties prenantes ont élaboré une stratégie complète qui prend en compte les déplacements intelligents et la partage avec le public afin de construire des transports plus performants dans les régions métropolitaines. Les déplacements intelligents ont un impact positif sur l'environnement en réduisant les embouteillages et les émissions de gaz à effet de serre.
Le covoiturage, le partage de vélos, le covoiturage et d'autres options de déplacement respectueuses de l'environnement sont disponibles via les services de déplacements intelligents. Ils offrent aux employés de bureau une option de transport leur permettant de choisir un itinéraire de déplacement plus efficace qui réduit les embouteillages et les dépenses de transport. L'un des facteurs qui stimulent la croissance du marché des transports intelligents est la croissance du nombre de citadins, ce qui entraîne une augmentation des taux générationnels. Les services de transport partagés sont désormais universellement acceptés et encouragés par les gouvernements et les organismes environnementaux, car ils contribuent à réduire les émissions. Ils permettent de réduire le nombre de voitures particulières, ce qui devrait alimenter la croissance du marché des transports intelligents dans les années à venir. En Amérique du Nord, le besoin de transports intelligents est alimenté par la préférence croissante des usagers des transports en commun pour les services de covoiturage, ce qui permettrait de réduire les embouteillages et de prévenir les dommages environnementaux. De plus, l'essor du tourisme, les avancées technologiques et les politiques gouvernementales favorables sont d'autres facteurs qui stimulent la croissance du marché nord-américain des transports intelligents. En Europe, la montée en puissance de la mobilité en tant que service et l'augmentation du nombre d'utilisateurs de services de covoiturage devraient créer des opportunités lucratives pour les acteurs du marché. En Europe, face aux préoccupations croissantes concernant le réchauffement climatique, les embouteillages et la dépendance énergétique étrangère, les transports intelligents gagnent en popularité. La pratique de prélèvement de péages sur les automobiles à un seul occupant, imposée en 2012, a entraîné une augmentation considérable de l’utilisation des transports intelligents par les consommateurs européens.
Vous bénéficierez d’une personnalisation sur n’importe quel rapport - gratuitement - y compris des parties de ce rapport, ou une analyse au niveau du pays, un pack de données Excel, ainsi que de profiter d’offres exceptionnelles et de réductions pour les start-ups et les universités
Marché des déplacements intelligents: Perspectives stratégiques
-
Obtenez les principales tendances clés du marché de ce rapport.Cet échantillon GRATUIT comprendra une analyse de données, allant des tendances du marché aux estimations et prévisions.
Impact de la pandémie de COVID-19 sur le marché des transports intelligents
L'épidémie de COVID-19 a eu un impact significatif sur le secteur des transports. La demande de services de covoiturage et de covoiturage a diminué à l'échelle mondiale en 2020 en raison de la COVID-19. Le marché mondial des transports intelligents a connu une baisse considérable de sa génération de revenus en 2020 par rapport à 2019, en partie à cause des confinements et de la réticence des clients à utiliser les services de covoiturage, même après la levée des réglementations. Les entreprises de covoiturage s'efforcent toujours de maintenir la confiance des conducteurs et des passagers en termes de sécurité et d'hygiène.
Analyses du marché– Marché des déplacements intelligents
Tendance croissante de la mobilité en tant que service
Les personnes qui ne peuvent pas acheter de voiture peuvent se déplacer en toute fluidité grâce aux services de mobilité. Selon le Bureau of Transportation Statistics, le coût moyen de possession et d'utilisation d'un véhicule est d'environ 8 858 $, pour un trajet de 15 000 kilomètres par an. La mobilité en tant que service réduit ces coûts pour l'utilisateur en maximisant l'utilisation des services de transport tels que le covoiturage et les VTC. Elle réduit également les embouteillages et les émissions globales des automobiles dans les villes. Par conséquent, le covoiturage et les VTC numériques gèrent efficacement la demande de transport et offrent une alternative pratique et écologique à la possession d'une voiture privée. De plus, selon les statistiques, 55 % de la population mondiale vit actuellement en ville, et les estimations suggèrent qu'environ 68 % de la population vivra en ville d'ici 2050. Le rythme rapide de l'urbanisation entraîne déjà des embouteillages. Le concept de mobilité en tant que service (MaaS) pourrait s'avérer plus judicieux pour réduire les embouteillages en exploitant davantage les infrastructures de transport publiques et privées existantes. La demande urgente de solutions efficaces pour gérer le trafic dans les villes intelligentes de manière plus rapide, moins coûteuse et plus pratique devrait stimuler la croissance du marché du MaaS d'ici 2028. Par conséquent, la tendance croissante à la mobilité en tant que service (MaaS) devrait stimuler la croissance du marché mondial des déplacements intelligents.
Analyse du marché des déplacements intelligents par type
Selon le type, le marché des déplacements intelligents est segmenté en covoiturage, covoiturage en fourgonnette, covoiturage à vélo, métro, etc. Le segment du covoiturage devrait détenir une part significative du marché mondial des déplacements intelligents et connaître le TCAC le plus élevé. Le transport intelligent se définit comme un déplacement régulier d'un point à un autre en covoiturage, en van, à vélo, à bicyclette ou en métro.
Analyse du marché des transports intelligents basés sur les solutions
En fonction de la solution, le marché des transports intelligents est segmenté entre applications mobiles, gestion du stationnement, gestion du trafic, etc. Le segment des applications mobiles devrait détenir une part importante du marché mondial des transports intelligents et connaître le TCAC le plus élevé. On observe une utilisation croissante des applications mobiles en voiture pour réduire les temps de trajet, les coûts et les émissions des véhicules.
Analyse du marché des transports intelligents basés sur l'utilisateur final
En fonction de l'utilisateur final, le marché des transports intelligents est divisé entre les particuliers et les entreprises. Le segment des entreprises devrait détenir une part importante du marché mondial des transports intelligents et connaître un TCAC plus élevé.
Marché des déplacements intelligents
Les tendances et facteurs régionaux influençant le marché des transports intelligents tout au long de la période de prévision ont été analysés en détail par les analystes de The Insight Partners. Cette section aborde également les segments et la géographie du marché des transports intelligents en Amérique du Nord, en Europe, en Asie-Pacifique, au Moyen-Orient et en Afrique, ainsi qu'en Amérique du Sud et en Amérique centrale.
Portée du rapport sur le marché des transports intelligents
| Attribut de rapport | Détails |
|---|---|
| Taille du marché en 2021 | US$ 30.47 Billion |
| Taille du marché par 2028 | US$ 86.57 Billion |
| TCAC mondial (2021 - 2028) | 16.1% |
| Données historiques | 2019-2020 |
| Période de prévision | 2022-2028 |
| Segments couverts |
By Type
|
| Régions et pays couverts |
Amérique du Nord
|
| Leaders du marché et profils d'entreprises clés |
|
Densité des acteurs du marché des transports intelligents : comprendre son impact sur la dynamique des entreprises
Le marché des transports intelligents connaît une croissance rapide, portée par une demande croissante des utilisateurs finaux, due à des facteurs tels que l'évolution des préférences des consommateurs, les avancées technologiques et une meilleure connaissance des avantages du produit. Face à cette demande croissante, les entreprises élargissent leur offre, innovent pour répondre aux besoins des consommateurs et capitalisent sur les nouvelles tendances, ce qui alimente la croissance du marché.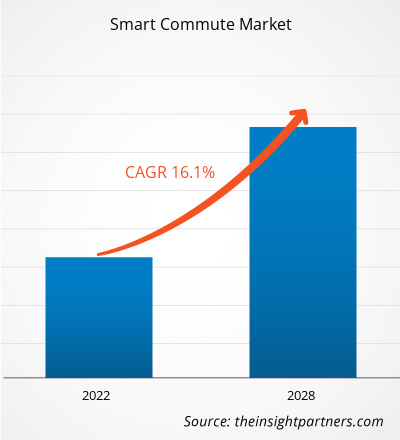
- Obtenez le Marché des déplacements intelligents Aperçu des principaux acteurs clés
Les acteurs opérant sur le marché des déplacements intelligents se concentrent principalement sur le développement de produits avancés et efficaces.
- En janvier 2022, Tummoc, une entreprise de mobilité multimodale, a l'intention d'étendre ses opérations à dix autres villes d'ici 2022, dont Delhi et Mumbai.
- En avril 2021, une entreprise de mobilité basée en ville a créé une plateforme d'application qui intègre pour la première fois les itinéraires aux prix, combinant le bus, le métro, Uber, Yulu et d'autres choix du dernier kilomètre.
Profil de l'entreprise
:- BlaBlaCar
- CommuteSmart
- Enterprise Holdings Inc
- ePoolers Technologies Pvt. Ltd
- Golden Concord Holdings Limited
- Oakland Smart Commute
- Quick Ride
- Transhelp Technologies Pvt Ltd
- Uber Technologies Inc.
- Smart Commute

Naveen est un professionnel expérimenté des études de marché et du conseil, fort de plus de 9 ans d'expertise dans des projets personnalisés, syndiqués et de conseil. Actuellement vice-président associé, il a géré avec succès les parties prenantes tout au long de la chaîne de valeur des projets et a rédigé plus de 100 rapports de recherche et plus de 30 missions de conseil. Son expertise couvre des projets industriels et gouvernementaux, contribuant significativement à la réussite de ses clients et à la prise de décision fondée sur les données.
Naveen est titulaire d'un diplôme d'ingénieur en électronique et communication de la VTU, Karnataka, et d'un MBA en marketing et opérations de l'Université de Manipal. Membre actif de l'IEEE depuis 9 ans, il a participé à des conférences et des colloques techniques et s'est porté volontaire au niveau des sections et des régions. Avant d'occuper ce poste, il a travaillé comme consultant stratégique associé chez IndustryARC et comme consultant en serveurs industriels chez Hewlett Packard (HP Global).
- Analyse historique (2 ans), année de base, prévision (7 ans) avec TCAC
- Analyse PEST et SWOT
- Taille du marché Valeur / Volume - Mondial, Régional, Pays
- Industrie et paysage concurrentiel
- Ensemble de données Excel
Témoignages
Le rapport sur le marché des systèmes SCADA d'Insight Partners est complet et fournit des informations précieuses sur les tendances actuelles et les prévisions. L'équipe a fait preuve d'un grand professionnalisme, d'une grande réactivité et d'un grand soutien tout au long du projet. Nous sommes très satisfaits et recommandons vivement leurs services.
RAN KEDEM Partenaire, Reali Technologies LTDJ'ai demandé un rapport sur un marché logiciel très spécifique et l'équipe l'a produit en quelques jours. Les informations étaient très pertinentes et bien présentées. J'ai ensuite demandé des modifications et des ajouts au rapport. L'équipe a de nouveau été très réactive et j'ai reçu le rapport final en moins d'une semaine.
JEAN-HERVÉ JENN Président, Future AnalyticaNous avons collaboré avec The Insight Partners pour une importante étude de marché et des prévisions. Ils nous ont fourni une vision claire des opportunités et des risques, ce qui nous a aidés à élaborer nos plans. Leurs recherches étaient faciles à utiliser et basées sur des données solides. Elles nous ont permis de prendre des décisions éclairées et en toute confiance. Nous les recommandons vivement.
PIYUSH NAGPAL Vice-président principal, Feux de route mondiauxInsight Partners a réalisé une étude de marché pertinente et bien structurée, avec une solide expertise du domaine. Son équipe a fait preuve de professionnalisme et de réactivité tout au long du projet. Son site web convivial a facilité l'accès aux rapports sectoriels. Nous recommandons vivement ses services d'études fiables et de haute qualité.
YUKIHIKO ADACHI PDG, Bleu profond, LLC.C'est la première fois que j'achète une étude de marché auprès de The Insight Partners. J'étais un peu hésitant au début, mais j'ai consulté leur site web et me suis senti plus à l'aise pour prendre le risque d'acheter une étude de marché. Je suis entièrement satisfait de la qualité du rapport et du service client. J'avais plusieurs questions et commentaires concernant le rapport initial, mais après quelques échanges par e-mail avec leur analyste, je pense avoir obtenu un rapport qui pourra alimenter notre processus de planification stratégique. Merci beaucoup pour votre temps et pour avoir rendu cette expérience positive. Je recommanderai sans hésiter vos services et vous serez mon premier contact lorsque nous aurons besoin de données de marché supplémentaires.
JOHN SUZUKI Président-directeur général, administrateur du conseil d'administration, BK TechnologiesJe tiens à vous remercier pour votre soutien et le professionnalisme dont vous avez fait preuve lors du traitement de ma demande d'informations concernant le marché des dispositifs de diagnostic in vitro (DIV) pour les maladies infectieuses au Nigéria. J'apprécie votre patience, vos conseils et votre volonté d'offrir une réduction, ce qui nous a finalement permis de conclure un accord. Je me réjouis de collaborer à nouveau avec The Insight Partners, grâce à l'impression que vous m'avez laissée suite à cette première rencontre.
DR CHIJIOKE DIRECTEUR GÉNÉRAL D'ONYIA, PineCrest Healthcare Ltd.Raison d'acheter
- Prise de décision éclairée
- Compréhension de la dynamique du marché
- Analyse concurrentielle
- Connaissances clients
- Prévisions de marché
- Atténuation des risques
- Planification stratégique
- Justification des investissements
- Identification des marchés émergents
- Amélioration des stratégies marketing
- Amélioration de l'efficacité opérationnelle
- Alignement sur les tendances réglementaires


Débloquez des remises exclusives sur les rapports
Demander maintenant


 Obtenez un échantillon gratuit pour - Marché des déplacements intelligents