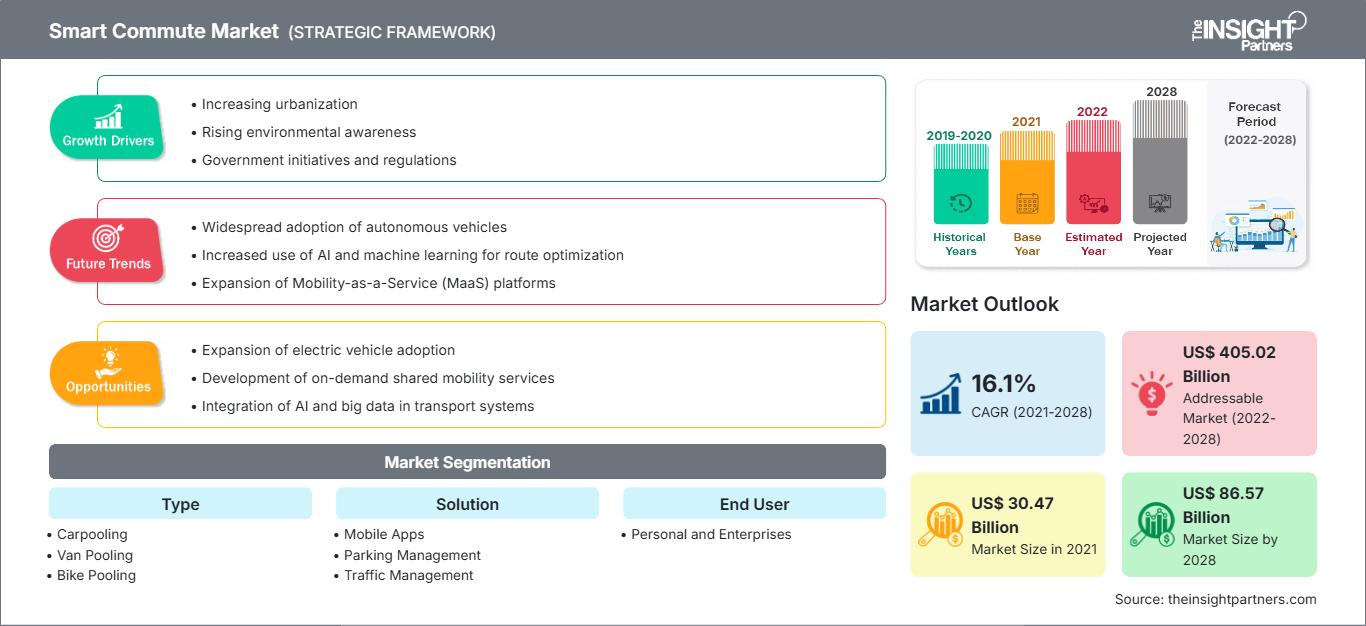
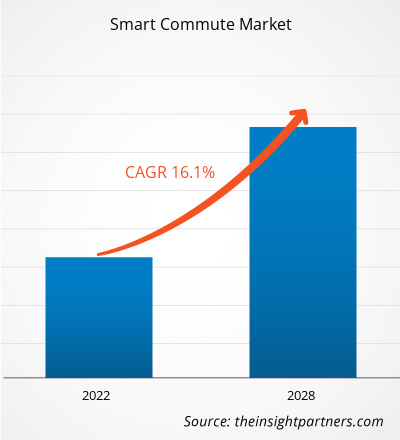
智能通勤市场基于(关键地区、市场参与者、规模和份额)- 到 2031 年的预测

  • Report Code : TIPRE00009536
  • Category : Automotive and Transportation
  • Status : Published
  • No. of Pages : 155
Buy Now

智能通勤市场预计将从2021年的304.6949亿美元增长到2028年的865.6873亿美元;预计 2021 年至 2028 年复合年增长率为 16.1%。

智能通勤被定义为定期通过拼车、拼车、骑自行车、骑自行车或乘车出行地铁。公共交通公司、政府和其他利益相关者已经制定了完整的智慧出行战略,并与公众分享,以在大都市地区建设更强大的交通。智能通勤通过减少交通拥堵和减少温室气体排放,对环境产生积极影响。

拼车、共享单车、拼车和其他环保通勤选项可通过智能通勤服务。它为上班族提供了一种交通选择,可以选择更有效的通勤路径,从而减少交通拥堵和交通支出。推动智能通勤市场增长的因素之一是城市居民数量的不断增加,导致发电量的增加。共享交通服务已获得普遍接受,并受到政府和环境机构的鼓励,因为它有助于减少排放。它允许更少的私家车,预计这将在未来几年推动智能通勤市场的增长。

在北美,对智能通勤的需求已经增加办公室通勤者越来越倾向于拼车服务,这将缓解交通拥堵并防止环境破坏。此外,旅游业的崛起、技术进步和有利的政府政策是推动北美智能通勤市场增长的其他因素。在欧洲,移动即服务趋势的兴起和乘车共享服务用户群的增加预计将为市场参与者创造利润丰厚的机会。


Report Coverage
Report Coverage

Revenue forecast, Company Analysis, Industry landscape, Growth factors, and Trends

Segment Covered
Segment Covered

This text is related
to segments covered.

Regional Scope
Regional Scope

North America, Europe, Asia Pacific, Middle East & Africa, South & Central America

Country Scope
Country Scope

This text is related
to country scope.

Frequently Asked Questions


What are key driving factors behind Smart Commute market growth?

The key element driving the expansion of smart commutes is a rapid increase in the adoption of carpool and bike pool services among regular office commuters. Prominent market players such as Uber and Ola offer convenient pick-up and drop-off services, attracting consumers to use ride-sharing services. Furthermore, services such as short-distance travel, intercity ride-sharing, bus-sharing, bike-sharing, and auto-sharing are available, which stimulates the expansion of smart commute demand. Many prominent Indian corporations proactively push employees to use carpool and bike pool services. Organizations with large workforces, such as Infosys, Capgemini, Cognizant, HCL, Amazon, Flipkart, Siemens, L&T, Biocon, and HDFC Bank, as well as several smaller businesses, are launching awareness campaigns and digital platforms to help employees better plan their commutes. Moreover, organizations are rewarding top carpoolers to keep employees engaged and motivated to reduce carbon emissions and traffic jams across cities. New York, Seoul, and Shanghai are among the top 10 cities with the highest carbon footprint. Governments and businesses are encouraging carpooling to commute in cities to reduce emissions. Countries have established specific targets for reducing carbon footprints by 2030 as part of the Paris climate agreement. In Delhi, India, the government implemented an odd-even strategy to control traffic density and reduce carbon emissions in the city.

What are key market opportunities for Smart Commute market?

IoT devices can be used to make daily commutes more enjoyable. These technologies also help reduce overall transport costs while being environmentally beneficial. The best IoT option for the last-mile journey could be connected bicycles. Citizens have already begun to benefit from combined bike-sharing possibilities provided by market players. Users may keep track of bike availability, usage, and trip details. The only stumbling block for linked bike-sharing programs is integrating them into today's traffic. Governments must ensure that designated bike lanes exist to maintain a smooth traffic flow. In some areas, connected electric scooters are also available for rent. Some firms even offer complimentary helmets to electric scooter riders for a minimal shipping fee. By providing alternate commute options, these businesses contribute to a better future for our world. Apps for taxi commuting are already widespread among today's youth. Rather than driving their car, many commuters use taxi services such as Uber and Lyft. This is a more cost-effective and environmentally responsible solution than single-user rides. These businesses have access to a wealth of data that may be monitored and studied to improve cab-sharing services. Unlike most public transit, they can function similarly to public transportation, but they can provide a comprehensive commute option.

Which type is expected to dominate the market in the forecast period?

Based on type, the global Smart Commute market is segmented into carpooling, van pooling, bike pooling, metro, and others. The Smart Commute market was dominated by the carpooling segment in 2020.

Which region has dominated the Smart Commute market in 2020?

North America dominated the Smart Commute market in 2020 with a share of 43.9%. Asia Pacific is expected to grow at a fastest CAGR accounting for 40.0% share by 2028, followed by Europe.

Which are the major companies operating in the Smart Commute market?

The major companies in Smart Commute market are Enterprise Holdings, Inc.; BlaBlaCar; CommuteSmart; ePoolers Technologies Pvt. Ltd.; Smart Commute; Oakland Smart Commute; Quick Ride; Tummoc (Transhelp Technologies Pvt. Ltd.); Uber Technologies, Inc.; and GCL Smart Commute Co., Ltd.

Which are the major end user for Smart Commute?

The major end user in Smart Commute includes personal, and enterprises. In terms of market share, the market was dominated by the enterprises segment in 2020.

The List of Companies - Smart Commute Market 

  1. BlaBlaCar
  2. CommuteSmart
  3. Enterprise Holdings Inc
  4. ePoolers Technologies Pvt. Ltd
  5. Golden Concord Holdings Limited
  6. Oakland Smart Commute
  7. Quick Ride
  8. Transhelp Technologies Pvt Ltd
  9. Uber Technologies Inc.
  10. Smart Commute

The Insight Partners performs research in 4 major stages: Data Collection & Secondary Research, Primary Research, Data Analysis and Data Triangulation & Final Review.

  1. Data Collection and Secondary Research:

As a market research and consulting firm operating from a decade, we have published and advised several client across the globe. First step for any study will start with an assessment of currently available data and insights from existing reports. Further, historical and current market information is collected from Investor Presentations, Annual Reports, SEC Filings, etc., and other information related to company’s performance and market positioning are gathered from Paid Databases (Factiva, Hoovers, and Reuters) and various other publications available in public domain.

Several associations trade associates, technical forums, institutes, societies and organization are accessed to gain technical as well as market related insights through their publications such as research papers, blogs and press releases related to the studies are referred to get cues about the market. Further, white papers, journals, magazines, and other news articles published in last 3 years are scrutinized and analyzed to understand the current market trends.

  1. Primary Research:

The primarily interview analysis comprise of data obtained from industry participants interview and answers to survey questions gathered by in-house primary team.

For primary research, interviews are conducted with industry experts/CEOs/Marketing Managers/VPs/Subject Matter Experts from both demand and supply side to get a 360-degree view of the market. The primary team conducts several interviews based on the complexity of the markets to understand the various market trends and dynamics which makes research more credible and precise.

A typical research interview fulfils the following functions:

  • Provides first-hand information on the market size, market trends, growth trends, competitive landscape, and outlook
  • Validates and strengthens in-house secondary research findings
  • Develops the analysis team’s expertise and market understanding

Primary research involves email interactions and telephone interviews for each market, category, segment, and sub-segment across geographies. The participants who typically take part in such a process include, but are not limited to:

  • Industry participants: VPs, business development managers, market intelligence managers and national sales managers
  • Outside experts: Valuation experts, research analysts and key opinion leaders specializing in the electronics and semiconductor industry.

Below is the breakup of our primary respondents by company, designation, and region:

Research Methodology

Once we receive the confirmation from primary research sources or primary respondents, we finalize the base year market estimation and forecast the data as per the macroeconomic and microeconomic factors assessed during data collection.

  1. Data Analysis:

Once data is validated through both secondary as well as primary respondents, we finalize the market estimations by hypothesis formulation and factor analysis at regional and country level.

  • Macro-Economic Factor Analysis:

We analyse macroeconomic indicators such the gross domestic product (GDP), increase in the demand for goods and services across industries, technological advancement, regional economic growth, governmental policies, the influence of COVID-19, PEST analysis, and other aspects. This analysis aids in setting benchmarks for various nations/regions and approximating market splits. Additionally, the general trend of the aforementioned components aid in determining the market's development possibilities.

  • Country Level Data:

Various factors that are especially aligned to the country are taken into account to determine the market size for a certain area and country, including the presence of vendors, such as headquarters and offices, the country's GDP, demand patterns, and industry growth. To comprehend the market dynamics for the nation, a number of growth variables, inhibitors, application areas, and current market trends are researched. The aforementioned elements aid in determining the country's overall market's growth potential.

  • Company Profile:

The “Table of Contents” is formulated by listing and analyzing more than 25 - 30 companies operating in the market ecosystem across geographies. However, we profile only 10 companies as a standard practice in our syndicate reports. These 10 companies comprise leading, emerging, and regional players. Nonetheless, our analysis is not restricted to the 10 listed companies, we also analyze other companies present in the market to develop a holistic view and understand the prevailing trends. The “Company Profiles” section in the report covers key facts, business description, products & services, financial information, SWOT analysis, and key developments. The financial information presented is extracted from the annual reports and official documents of the publicly listed companies. Upon collecting the information for the sections of respective companies, we verify them via various primary sources and then compile the data in respective company profiles. The company level information helps us in deriving the base number as well as in forecasting the market size.

  • Developing Base Number:

Aggregation of sales statistics (2020-2022) and macro-economic factor, and other secondary and primary research insights are utilized to arrive at base number and related market shares for 2022. The data gaps are identified in this step and relevant market data is analyzed, collected from paid primary interviews or databases. On finalizing the base year market size, forecasts are developed on the basis of macro-economic, industry and market growth factors and company level analysis.

  1. Data Triangulation and Final Review:

The market findings and base year market size calculations are validated from supply as well as demand side. Demand side validations are based on macro-economic factor analysis and benchmarks for respective regions and countries. In case of supply side validations, revenues of major companies are estimated (in case not available) based on industry benchmark, approximate number of employees, product portfolio, and primary interviews revenues are gathered. Further revenue from target product/service segment is assessed to avoid overshooting of market statistics. In case of heavy deviations between supply and demand side values, all thes steps are repeated to achieve synchronization.

We follow an iterative model, wherein we share our research findings with Subject Matter Experts (SME’s) and Key Opinion Leaders (KOLs) until consensus view of the market is not formulated – this model negates any drastic deviation in the opinions of experts. Only validated and universally acceptable research findings are quoted in our reports.

We have important check points that we use to validate our research findings – which we call – data triangulation, where we validate the information, we generate from secondary sources with primary interviews and then we re-validate with our internal data bases and Subject matter experts. This comprehensive model enables us to deliver high quality, reliable data in shortest possible time.

Your data will never be shared with third parties, however, we may send you information from time to time about our products that may be of interest to you. By submitting your details, you agree to be contacted by us. You may contact us at any time to opt-out.

Related Reports