小売市場における仮想現実と拡張現実のセグメント、地理、動向、最近の動向、戦略的洞察による2031年レポート
過去データ : 2021-2022 | 基準年 : 2023 | 予測期間 : 2024-2031小売市場における仮想現実と拡張現実の規模と予測(2021年 - 2031年)、世界および地域のシェア、傾向、成長機会分析レポートの対象範囲:コンポーネント(ハードウェア、ソフトウェア、サービス)、アプリケーション(広告とマーケティング、試着ソリューション、計画と設計、その他)、小売タイプ(ジュエリー、アパレル、美容と化粧品、家具、その他)および地域別
- ステータス : 公開されたデータ
- レポートコード : TIPRE00006606
- カテゴリー : テクノロジー、メディア、通信
- ページ数 : 150
- 利用可能なレポート形式 :


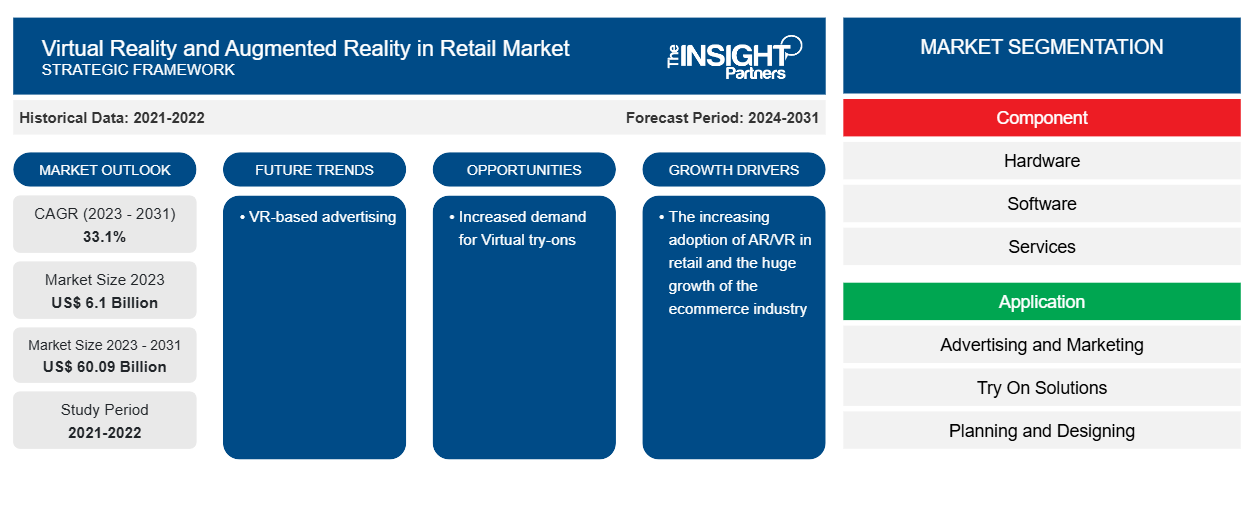
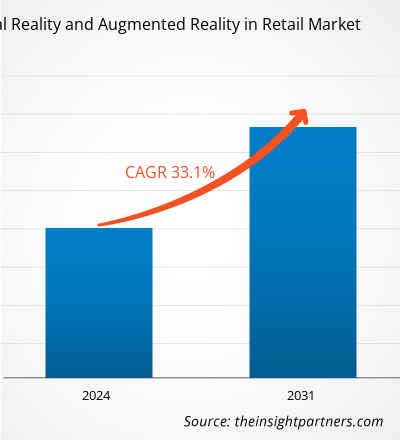
小売業における仮想現実と拡張現実の規模は、2023年の61億米ドルから2031年には600.9億米ドルに達すると予測されています。小売市場における仮想現実と拡張現実は、2023年から2031年の間に33.1%のCAGRを記録すると予想されています。VRベースの広告は、引き続き市場の重要なトレンドであり続けると思われます。
小売市場分析における仮想現実と拡張現実
小売業における仮想現実と拡張現実には、現在の市場動向と予測期間中の予測可能な影響により、成長の見通しがあります。小売業における仮想現実と拡張現実は、小売業における AR/ VRの採用の増加や電子商取引業界の大幅な成長などの要因により成長しています。仮想試着の需要の増加は、小売業における仮想現実と拡張現実に有利な機会を提供します。
小売市場における仮想現実と拡張現実の概要
仮想現実 ( VR ) と拡張現実 (AR) は、没入型でインタラクティブなショッピング体験を提供することで、小売業界を変革しています。VRは、顧客が仮想店舗を探索したり、製品を 3D で視覚化したり、仮想的に衣服を試着したりできる完全なデジタル環境を作り出します。一方、AR はデジタル情報を現実世界に重ね合わせ、スマートフォン アプリやスマート ミラーを使用して、家具を自宅でどのように見せるか、メイクを顔に施すとどのように見えるかを確認できます。これらのテクノロジにより、小売業者はオンライン ショッピングと店舗でのショッピングのギャップを埋め、製品の視覚化を強化し、返品を減らし、顧客エンゲージメントと売上を促進できる魅力的なブランド体験を生み出すことができます。
要件に合わせてレポートをカスタマイズする
このレポートの一部、国レベルの分析、Excelデータパックなど、あらゆるレポートを無料でカスタマイズできます。また、スタートアップや大学向けのお得なオファーや割引もご利用いただけます。
小売市場における仮想現実と拡張現実:戦略的洞察
-
このレポートの主要な市場動向を入手してください。この無料サンプルには、市場動向から見積もりや予測に至るまでのデータ分析が含まれます。
小売市場における仮想現実と拡張現実の推進要因と機会
小売業におけるAR/ VRの導入増加が市場を有利に導く
デジタル時代が影響を与えている主な分野の 1 つが小売業です。ウォルマート、アリババ、アマゾンなどの最大手小売業者は、より個別化されたインタラクティブなサービスを顧客に提供するために、最先端の小売技術に積極的に投資しています。スマート小売の 3 つの基本要素は、利便性の向上、パーソナライゼーション、カスタマイズです。AR や VR を活用したアプリケーションなどの革新的なソリューションの人気が高まっています。Wayfair、Lowe's、Ikeaなどの小売大手に続いて、多くの小売企業が AR/ VR技術を採用し始めています。たとえば、10 億人以上が拡張現実製品を使用すると予想されています。その数は驚異的です。仮想現実と拡張現実により、顧客は購入前に商品を特定して試すことが容易になります。拡張現実の使用により、巨大なショッピング モールのナビゲーションが容易になります。
バーチャル試着の需要増加
バーチャル試着の需要増加は、小売市場の成長においてVRと ARに大きなチャンスをもたらします。バーチャル試着は、顧客が購入前に製品をより正確に視覚化できるようにすることで、返品率を大幅に削減できます。これにより、小売業者は配送と補充にかかる費用を節約し、収益性を向上させます。さらに、顧客はバーチャル試着を通じてオンライン購入に自信を持つようになるため、実際に商品を見ずに購入する可能性が高くなります。これにより、特に衣料品や化粧品などのカテゴリーで、e コマースの売上を伸ばすことができます。バーチャル試着は、顧客エンゲージメントと満足度を高めることができる、斬新でインタラクティブなショッピング体験を提供します。これにより、ブランドロイヤルティとリピート購入が向上します。
小売市場レポートのセグメント分析における仮想現実と拡張現実
小売市場分析における仮想現実と拡張現実の導出に貢献した主要なセグメントは、コンポーネント、アプリケーション、小売タイプです。
- 小売市場における仮想現実と拡張現実は、構成要素に基づいて、ハードウェア、ソフトウェア、サービスに分けられます。ハードウェアセグメントは、2023年に大きな市場シェアを占めるでしょう。
- 用途別に見ると、市場は広告とマーケティング、試着ソリューション、企画と設計、その他に分類されています。2023年には広告とマーケティングのセグメントが最大の市場シェアを占めました。
- 小売タイプ別に見ると、市場はジュエリー、アパレル、美容・化粧品、家具、その他に分類されています。2023年にはアパレル部門が最大の市場シェアを占めました。
小売市場における仮想現実と拡張現実の地域別シェア分析
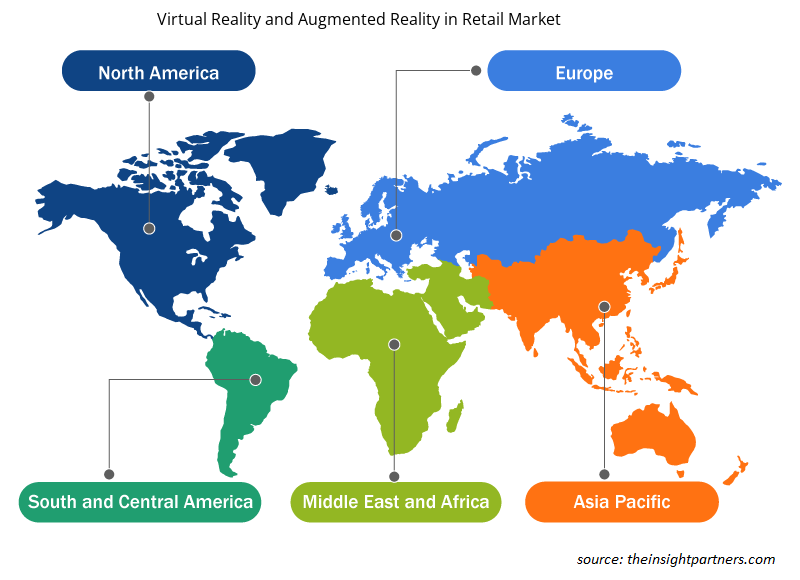
小売市場レポートにおける仮想現実と拡張現実の地理的範囲は、主に北米、アジア太平洋、ヨーロッパ、中東およびアフリカ、南米および中米の 5 つの地域に分かれています。
アジア太平洋地域の小売業では、拡張現実 (AR) と仮想現実 ( VR )の利用が広がりつつあります。これらの技術は、小売体験を向上させ、顧客エンゲージメントを促進するために、さまざまな方法でますます活用されています。これらの技術は、小売体験を向上させ、顧客エンゲージメントを促進し、業界のマーケティング、トレーニング、教育に新たな機会を提供する可能性を秘めています。
小売市場における仮想現実と拡張現実の地域分析
予測期間を通じて小売市場における仮想現実と拡張現実に影響を与える地域的な傾向と要因は、Insight Partners のアナリストによって徹底的に説明されています。このセクションでは、北米、ヨーロッパ、アジア太平洋、中東、アフリカ、南米、中米にわたる小売市場における仮想現実と拡張現実のセグメントと地理についても説明します。
- 小売市場における仮想現実と拡張現実の地域別データを入手
小売市場における仮想現実と拡張現実レポートの範囲
| レポート属性 | 詳細 |
|---|---|
| 2023年の市場規模 | 61億米ドル |
| 2031年までの市場規模 | 600.9億米ドル |
| 世界のCAGR(2023年~2031年) | 33.1% |
| 履歴データ | 2021-2022 |
| 予測期間 | 2024-2031 |
| 対象セグメント |
コンポーネント別
|
| 対象地域と国 |
北米
|
| 市場リーダーと主要企業プロフィール |
|
小売市場における仮想現実と拡張現実の密度:ビジネスダイナミクスへの影響を理解する
小売市場における仮想現実と拡張現実は、消費者の嗜好の変化、技術の進歩、製品の利点に対する認識の高まりなどの要因により、エンドユーザーの需要が高まり、急速に成長しています。需要が高まるにつれて、企業は提供を拡大し、消費者のニーズを満たすために革新し、新たなトレンドを活用し、市場の成長をさらに促進しています。
市場プレーヤー密度とは、特定の市場または業界内で活動している企業または会社の分布を指します。これは、特定の市場スペースに、その市場規模または総市場価値に対してどれだけの競合相手 (市場プレーヤー) が存在するかを示します。
小売市場における仮想現実および拡張現実で事業を展開している主要企業は次のとおりです。
- エプソンアメリカ株式会社
- マルクセント
- グーグル
- インフォシス株式会社
- インテルコーポレーション
- マイクロソフト株式会社
免責事項:上記の企業は、特定の順序でランク付けされていません。
- 小売市場における仮想現実と拡張現実のトップキープレーヤーの概要を入手
小売市場における仮想現実と拡張現実のニュースと最近の動向
小売市場における仮想現実と拡張現実は、主要な企業出版物、協会データ、データベースなどの一次調査と二次調査後の定性的および定量的データを収集することによって評価されます。小売市場における仮想現実と拡張現実の発展のいくつかを以下に示します。
- Apple は、600 の新しいアプリとゲームを備えた初の複合現実ヘッドセット Vision Pro をリリースしました。その中には、大手小売業者による拡張現実 (AR) と仮想現実 (VR) への進出があり、消費者によりインタラクティブな e コマース体験を提供できる能力を活用しています。Vision Pro アプリは、ヘッドセット ユーザーに 3D ショッピング体験を提供し、製品を閲覧したり、衣装を組み立てたりできるようにします。さらに、FaceTime ビデオ通話用の Apple SharePlay 機能を統合することで、小売業者はこのリアルな環境でスタイリストからリアルタイムのアドバイスを提供できます。(出典: Apple、プレスリリース、2024 年 2 月)
- Zero10 は、トミー ヒルフィガーやコーチなどのブランドに、店内やウィンドウディスプレイを活用した AR ミラーによるデジタル ソリューションを提供しています。トミー ヒルフィガーは、ヨーロッパでテクノロジー企業 Zero10 の AR ミラーをショーン メンデス キャンペーンの一環として、また最近発売されたパファー ジャケットのプロモーションに使用しています。一方、コーチは、タビー バッグやホリデー シーズン キャンペーンの宣伝に Zero10 の AR ミラーと AR ストアフロントを採用しています (出典: Zero10、プレスリリース、2024 年 4 月)
小売市場における仮想現実と拡張現実レポートの対象範囲と成果物
「小売市場における仮想現実と拡張現実の市場規模と予測(2021〜2031年)」レポートでは、以下の分野をカバーする市場の詳細な分析を提供しています。
- 対象範囲に含まれるすべての主要市場セグメントについて、小売市場における仮想現実と拡張現実の規模と世界、地域、国レベルでの予測
- 小売市場における仮想現実と拡張現実の動向、および推進要因、制約、主要な機会などの市場動向
- 詳細なPEST/ポーターの5つの力とSWOT分析
- 主要な市場動向、世界および地域の枠組み、主要プレーヤー、規制、最近の市場動向を網羅した小売市場分析における仮想現実と拡張現実
- 市場集中、ヒートマップ分析、主要プレーヤー、小売市場における仮想現実と拡張現実の最近の動向を網羅した業界の状況と競争分析
- 詳細な企業プロフィール

アンキタは、テクノロジー、メディア、ICT、エレクトロニクス・半導体の各分野で8年以上の経験を持つ、ダイナミックな市場調査およびコンサルティングのプロフェッショナルです。Microsoft、Oracle、NEC、SAP、KPMG、Expeditors Internationalといったグローバルクライアントに対し、100件以上のコンサルティングおよび調査案件を主導・遂行してきました。彼女のコアコンピテンシーは、市場評価、データ分析、予測、戦略策定、競合情報、レポート作成です。
アンキタは、販売前の提案書作成やクライアントとの協議から、販売後の実用的なインサイトの提供まで、プロジェクトサイクル全体を巧みに管理することに長けています。彼女は、部門横断的なチームの管理、複雑な調査モジュールの構築、そしてクライアント固有のビジネス目標に合わせたソリューションの調整に長けています。優れたコミュニケーション能力、リーダーシップ、そしてプレゼンテーション能力により、急速に変化する市場環境において、常に価値主導の成果を生み出しています。
- 過去2年間の分析、基準年、CAGRによる予測(7年間)
- PEST分析とSWOT分析
- 市場規模価値/数量 - 世界、地域、国
- 業界と競争環境
- Excel データセット
最新レポート
お客様の声
Insight PartnersのSCADAシステム市場レポートは包括的で、現在のトレンドと将来の予測に関する貴重な洞察が含まれています。チームは終始、非常にプロフェッショナルで、対応が早く、サポートも充実していました。私たちは彼らのサービスに非常に満足しており、強くお勧めします。
ラン・ケデム パートナー, レアリテクノロジーズ株式会社非常に特殊なソフトウェア市場に関するレポートを依頼したところ、チームは数日でレポートを作成してくれました。情報は非常に関連性が高く、分かりやすくまとめられていました。その後、レポートにいくつか修正と追加を依頼しましたが、チームは非常に迅速に対応し、1週間も経たないうちに最終レポートを受け取ることができました。
ジャン=エルヴェ・ジェン 会長, フューチャー・アナリティカ重要な市場調査と予測のために、The Insight Partnersと協力しました。彼らは機会とリスクに関する明確な洞察を提供し、私たちの計画策定に役立ちました。彼らの調査は使いやすく、確かなデータに基づいており、賢明で自信に満ちた意思決定に役立ちました。彼らを強くお勧めします。
ピユーシュ・ナグパル 上級副社長, ハイビームグローバルInsight Partnersは、深い専門知識に基づき、洞察力に富み、構造化された市場調査を提供しました。チームは終始プロフェッショナルで、対応力も抜群でした。ユーザーフレンドリーなウェブサイトにより、業界レポートへのアクセスもスムーズでした。信頼性の高い高品質な調査サービスをお探しなら、Insight Partnersを強くお勧めします。
安達幸彦 最高経営責任者(CEO), ディープブルーLLC。The Insight Partnersから市場レポートを購入するのは今回が初めてです。最初は不安でしたが、ウェブサイトを見て、リスクを負ってでも購入してみようという気持ちになりました。レポートの品質とカスタマーサービスには大変満足しています。最初のレポートにはいくつか質問やコメントがありましたが、アナリストとメールで何度かやり取りした結果、戦略策定プロセスへのインプットとして活用できるレポートが完成しました。貴重なお時間を割いていただき、貴重な体験をさせていただき、誠にありがとうございました。他の方にもぜひお勧めしたいですし、今後さらに市場データが必要になった際には、まずThe Insight Partnersにご連絡させていただきます。
ジョン・スズキ 社長兼最高経営責任者、取締役, BKテクノロジーズナイジェリアの感染症IVD市場に関する情報提供依頼に対し、ご対応いただいた際、ご尽力とプロフェッショナルな姿勢に深く感謝申し上げます。忍耐強く、的確なアドバイスをいただき、また、最終的に取引成立に至った割引のご提供にも深く感謝申し上げます。今回の最初の出会いで得た強い印象のおかげで、今後もThe Insight Partnersとの連携を心待ちにしております。
チジオケ博士 オニア マネージングディレクター, パインクレストヘルスケア株式会社購入理由
- 情報に基づいた意思決定
- 市場動向の理解
- 競合分析
- 顧客インサイト
- 市場予測
- リスク軽減
- 戦略計画
- 投資の正当性
- 新興市場の特定
- マーケティング戦略の強化
- 業務効率の向上
- 規制動向への対応


 無料サンプルを入手 - 小売市場における仮想現実と拡張現実