ビジョンガイドロボットソフトウェア市場の成長、規模、シェア、傾向、主要プレーヤーの分析、2030年までの予測
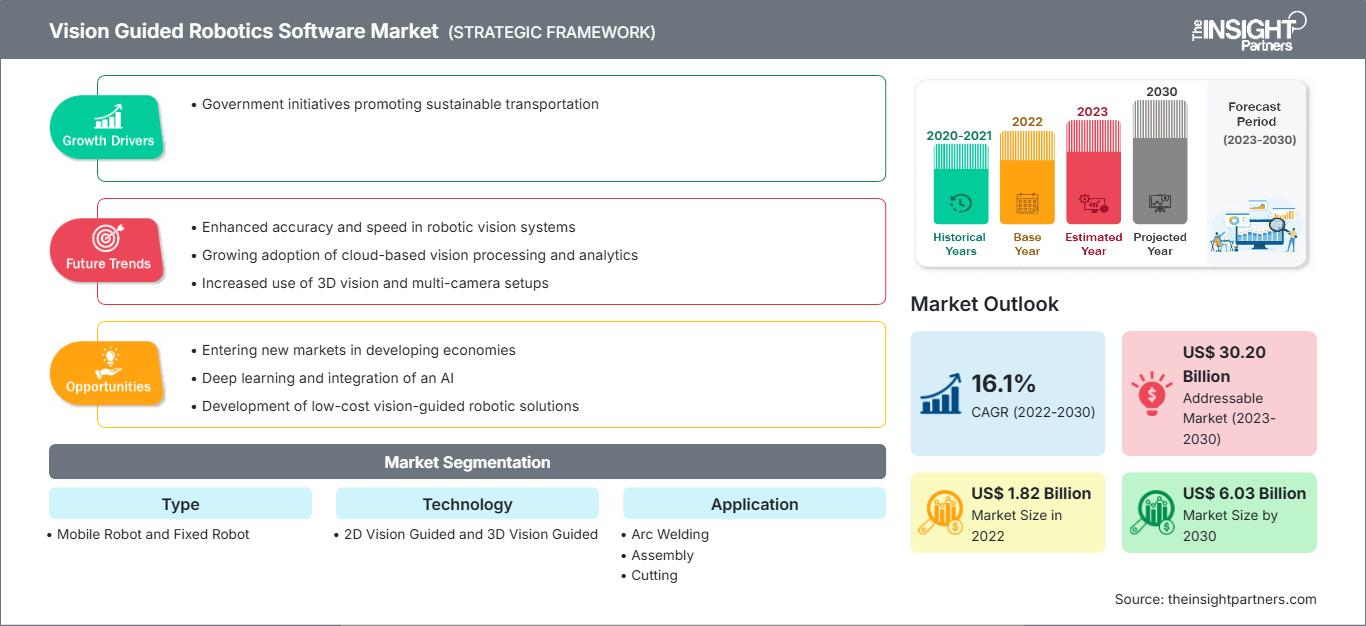
過去データ : 2020-2021 | 基準年 : 2022 | 予測期間 : 2023-2030ビジョンガイドロボットソフトウェア市場の規模と予測(2020年 - 2030年)、世界および地域別のシェア、トレンド、成長機会分析レポートの対象範囲:タイプ別(移動ロボットおよび固定ロボット)、テクノロジー別(2Dビジョンガイドおよび3Dビジョンガイド)、アプリケーション別(アーク溶接、組立、切断、パレタイジングおよびマシンテンディング、ナビゲーション、ランダムビンピッキング、協働ロボットなど)、垂直別(自動車、電気・電子、航空宇宙、ヘルスケア、輸送・物流、食品・飲料など)
- ステータス : 出版
- レポートコード : TIPTE100000800
- カテゴリー : テクノロジー、メディア、通信
- ページ数 : 211
- 利用可能なレポート形式 :


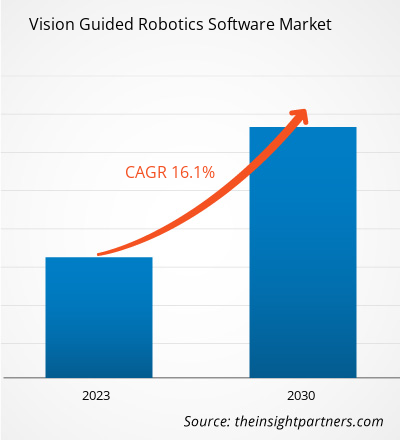
[調査レポート] ビジョンガイドロボティクスソフトウェア市場は、2022年に18億2,000万米ドルと評価され、2030年には60億3,000万米ドルに達すると予測されています。また、2022年から2030年にかけて16.1%のCAGR(年平均成長率)を記録すると予測されています。
アナリストの視点:
ビジョンガイドロボティクスソフトウェア市場は、多数のプレーヤーが存在するため、非常に細分化されています。業界で生き残り、同業他社と競争するために、各社は競争力のある価格、小型化技術、クラウドベース技術、合併・買収、追加アフターサービスなど、複数の戦略を採用しています。これらの戦略は、各社に他社に対する大きな競争優位性をもたらしています。多くの発展途上国政府が、さまざまな業界で行われている単調で煩雑な作業を正確かつ容易に最適化するための外国直接投資(FDI)を許可していることを考えると、ビジョンガイドロボティクスソフトウェア市場は今後数年間で発展する態勢が整っています。さらに、エンドユーザーの間で3Dビジョン技術の需要が急速に高まっており、メーカーはロボットシステム向けの堅牢なソフトウェアの革新と開発を迫られています。RoboRealmやVisionscapeなどのマシンビジョンソフトウェアと組み合わせた3Dビジョンシステムは、あらゆるタスク実行中のビジョン誘導ロボットのパフォーマンスを向上させ、ビジョン誘導ロボットソフトウェアの市場シェアを押し上げています。マシンビジョンソフトウェアと統合されたビジョン誘導ロボットは、ピックアンドプレース、ビンピッキング、溶接、組立、ラッキング、ディスペンシング、製品仕分けなどの用途に適しています。マシンビジョンソフトウェアと組み合わせた3Dビジョン技術の利点により、エンドユーザーは最新技術を採用する傾向が強まり、ビジョン誘導ロボットソフトウェア市場の成長を世界的に後押ししています。
市場概要:
ビジョン誘導ロボットソフトウェアは、さまざまな分野で、特定の製品に関する情報を抽出、評価、解釈し、機械的または電気的に要求される自律タスクを実行するために使用されています。ビジョン誘導ロボット市場の企業は、自動化シナリオを大幅に強化し、製造業のプロセス強化を支援する先進技術の開発に継続的に注力しています。センサー技術と処理能力の進歩により、ロボットは飛行、運転、移動といった、ビジョンシステムによる障害物回避や識別能力を必要とするより多くのタスクを遂行できるようになりました。ロボットメーカーが堅牢なビジョン誘導ロボットを開発するための最優先事項は、画像処理ハードウェアの進歩、急速に向上するコンピューティング能力、高レベルソフトウェアライブラリの改善、そしてコンピュータメモリのコスト削減です。また、マシンビジョンの成長は、産業分野における自動化技術を強化するでしょう。
要件に合わせてレポートをカスタマイズ
レポートの一部、国レベルの分析、Excelデータパックなどを含め、スタートアップ&大学向けに特別オファーや割引もご利用いただけます(無償)
ビジョンガイドロボットソフトウェア市場: 戦略的洞察
-
このレポートの主要な市場動向を入手してください。この無料サンプルには、市場動向から見積もりや予測に至るまでのデータ分析が含まれます。
市場の牽引要因:
マスカスタマイゼーションの高い可能性が、ビジョンガイドロボティクスソフトウェア市場の成長を牽引
世界中の大手製造企業は、日々の課題を軽減することを目的として、インテリジェント技術を導入しています。組織全体の様々な単調な作業に対応するカスタマイズされたロボットに対する消費者の需要は高まっており、これらのロボットは時間の経過や要件の変化に応じて容易にアップグレードできます。製品の継続的な機能強化により、数千もの企業が従来の大量生産業者よりも低コストで投資できるようになり、ビジョンガイドロボティクスソフトウェア市場の成長を牽引しています。ビジョンガイドロボティクスソフトウェアは、消費者の要件に応じて継続的に更新できます。このソフトウェア更新にかかるユーザーコストは、業界におけるシステム導入や新規システムの交換よりも低く抑えられます。
自動車、航空宇宙、ヘルスケア、物流、運輸、製造などの業界では、ワークステーションにロボット技術が高度に統合されています。近年、様々なロボット企業がビジョンガイドロボットを開発し、従来のロボットに比べて多くの利点を備えているため、世界の自動化シナリオに変化をもたらしています。これらのロボットはマルチタスクが可能で、カメラを搭載しているため、センサー技術の統合が不要です。ロボットは非常に正確で効率的です。そのため、マスカスタマイゼーションの高い可能性が、ビジョンガイドロボティクスソフトウェア市場のシェア拡大につながっています。
レポートのセグメンテーションと範囲:
ビジョンガイドロボティクスソフトウェア市場は、タイプ、技術、アプリケーション、垂直市場に基づいてセグメント化されています。タイプ別では、ビジョンガイドロボティクスソフトウェア市場は移動ロボットと固定ロボットに分類されます。技術別では、ビジョンガイドロボティクスソフトウェア市場は2Dビジョンガイドと3Dビジョンガイドに分類されます。アプリケーション別では、アーク溶接、組立、切断、パレタイジング&マシンテンディング、ナビゲーション、ランダムビンピッキング、協働ロボットなどに分類されます。垂直市場別では、自動車、電気・電子、航空宇宙、ヘルスケア、輸送・物流、食品・飲料などに分類されています。地域別に見ると、ビジョンガイドロボティクスソフトウェア市場は、北米、ヨーロッパ、アジア太平洋(APAC)、中東およびアフリカ(MEA)、南米(SAM)に分類されています。
セグメント分析:
タイプ別に見ると、ビジョンガイドロボティクスソフトウェア市場は、移動ロボットと固定ロボットに分類されます。固定ロボットセグメントは、2022年にビジョンガイドロボティクスソフトウェア市場で大きなシェアを占め、予測期間中に成長すると予想されています。固定ロボットは、幅広い交換可能なツールの利点により、複数の業界で広く使用されています。これらのロボットは、タスクを実行するために十分なプログラミングを必要とし、現在、さまざまなソフトウェア、カメラ、センサーがこれらの自律システムにインストールされ、機能を強化しています。これがセグメントシェアの拡大とビジョンガイドロボティクスソフトウェア市場の牽引役となっています。一般的に、固定ロボットは、溶接、配置、固定、成形などの目的で各業界に設置されています。高度な画像システム、センサー、ソフトウェアの助けを借りて、固定ロボットの運用効率が向上し、これらのシステムが自らタスクを理解できるようになり、ビジョン誘導ロボットソフトウェア市場規模が拡大しています。
地域分析:
2022年、アジア太平洋地域は最大のビジョン誘導ロボットソフトウェア市場シェアを保持しました。大規模な自動車、半導体、電子機器製造業界の存在により、操作の精度を高めるために自動化ロボットの導入が促進され、ビジョン誘導ロボットソフトウェア市場規模が拡大しています。中国と日本には、部品製造、部品のピッキングと配置、PCB上の小型部品の組み立て、接着剤の塗布、検査、テスト、梱包にビジョン誘導ロボットを使用する電子機器産業が活発です。アジア太平洋地域は、ビジョン誘導ロボットソフトウェア市場の開発と革新を積極的に推進しています。この地域には、中国、インド、東南アジアなど、いくつかの発展途上国が含まれます。 APAC地域は、作業を自動化する視覚誘導ロボットソフトウェアの分野で大きなチャンスを提供しており、これが視覚誘導ロボットソフトウェア市場を牽引しています。数社の企業は、今後数年間でこのソフトウェアをロボットに実装するためのビジョンと戦略を立てています。一方、多くの企業は依然として完全自動化オペレーションの採用を計画しており、これが視覚誘導ロボットソフトウェア市場の拡大につながると期待されています。
さらに、中国の視覚誘導ロボットソフトウェア市場は成長を続けています。中国はロボット密度が最も高い国の一つです。中国の自動車産業におけるロボット導入は大幅に増加しており、米国やドイツを上回っています。例えば、国際ロボット連盟によると、中国の製造業における稼働ロボットの数は2021年に従業員10,000人あたり322台に達し、米国のロボット密度(従業員10,000人あたり274台)を初めて上回りました。また、この地域の多くの国は製造業の中心地であり、企業進出数が増加しています。これにより、新たな製造工場の建設が進み、自動化の需要が高まり、ロボットの導入が急増し、ビジョンガイドロボティクスソフトウェア市場の成長を牽引しています。さらに、電子機器の製造における自動化の需要増加も、ロボットの導入を促進すると予測されており、ビジョンガイドロボティクスソフトウェア市場の拡大につながるでしょう。
主要企業分析:
本レポートでは、ABB Ltd、Fanuc Corp、Cognex Corp、OMRON Corp、MVTec Software GmbH、Pick-it NV、Ready Robotics Corporation、Siemens AG、Teradyne Inc、Robotic Vision Technologies (RVT)、LLCなどが、ビジョンガイドロボティクスソフトウェア市場の主要企業として紹介されています。
ビジョンガイドロボットソフトウェア市場の地域別分析
The Insight Partnersのアナリストは、予測期間全体を通してビジョンガイドロボティクスソフトウェア市場に影響を与える地域的な傾向と要因を詳細に解説しています。このセクションでは、北米、ヨーロッパ、アジア太平洋、中東・アフリカ、中南米におけるビジョンガイドロボティクスソフトウェア市場のセグメントと地域についても解説します。
ビジョンガイドロボットソフトウェア市場レポートの範囲
| レポート属性 | 詳細 |
|---|---|
| の市場規模 2022 | US$ 1.82 Billion |
| 市場規模別 2030 | US$ 6.03 Billion |
| 世界的なCAGR (2022 - 2030) | 16.1% |
| 過去データ | 2020-2021 |
| 予測期間 | 2023-2030 |
| 対象セグメント |
By タイプ
|
| 対象地域と国 |
北米
|
| 市場リーダーと主要企業の概要 |
|
ビジョンガイドロボットソフトウェア市場のプレーヤー密度:ビジネスダイナミクスへの影響を理解する
ビジョンガイド型ロボティクスソフトウェア市場は、消費者の嗜好の変化、技術の進歩、製品メリットへの認知度の向上といった要因によるエンドユーザーの需要増加に牽引され、急速に成長しています。需要の増加に伴い、企業は製品ラインナップの拡充、消費者ニーズへの対応、新たなトレンドの活用を進めており、これが市場の成長をさらに加速させています。
- 入手 ビジョンガイドロボットソフトウェア市場 主要プレーヤーの概要
最近の動向:
ビジョン誘導ロボットソフトウェア市場のプレーヤーは、無機および有機の戦略を高度に採用しています。最近の主要な市場動向をいくつか以下に示します。
- 2023年12月、Mecalux(自動倉庫ソリューション、倉庫管理システム、スタッカークレーンの世界的プロバイダー)とSiemensは、産業オートメーション技術における専門知識と経験を組み合わせました。このパートナーシップにより、新しい人工知能ソリューションを使用して、倉庫と物流センターでのピッキングタスクが最適化されます。このソリューションは、ソフトウェアとIoT対応のハードウェアポートフォリオ、パートナーエコシステム、マーケットプレイスを備えたオープンデジタルビジネスプラットフォームであるSiemens Xceleratorに基づいています。
- 2023年11月、ABB Roboticsは無料のWizard Easy Programmingソフトウェアの範囲を拡張し、OmniCoreコントローラーを搭載した6軸産業用ロボットと協働ロボットを追加しました。これにより、ABBは、コボットおよび6軸産業用ロボット向けの使いやすいノーコードプログラミングツールを提供する初のロボットメーカーとなり、新規ユーザーの自動化への障壁を下げ、エコシステムパートナーおよびインテグレーターに顧客をサポートするための効率的なツールを提供します。
- 2023年8月、OSARO(eコマース向け機械学習対応ロボットの世界的リーダー)は、顧客に最適な自動化ソリューションを提供する専門知識のエコシステムであるOSARO Partners Allianceに、Cognex Corporation(産業用マシンビジョンのリーダー)を迎え入れました。Cognex DataMan固定式画像ベースバーコードリーダーをOSARO Robotic Bagging Systemに統合することで、OSAROはZenni Opticalの困難な技術的課題を解決しました。
- 2023年2月、ABBは、最大11kgまで拡張された荷重処理能力と、パレタイジングやピックアンドプレースなどの機能をソリューションに組み込んだSWIFTI CRB 1300産業用協働ロボットをリリースしました。この製品は、産業用ロボットと協働ロボットの間のギャップを埋めるものとして期待されています。

アンキタは、テクノロジー、メディア、ICT、エレクトロニクス・半導体の各分野で8年以上の経験を持つ、ダイナミックな市場調査およびコンサルティングのプロフェッショナルです。Microsoft、Oracle、NEC、SAP、KPMG、Expeditors Internationalといったグローバルクライアントに対し、100件以上のコンサルティングおよび調査案件を主導・遂行してきました。彼女のコアコンピテンシーは、市場評価、データ分析、予測、戦略策定、競合情報、レポート作成です。
アンキタは、販売前の提案書作成やクライアントとの協議から、販売後の実用的なインサイトの提供まで、プロジェクトサイクル全体を巧みに管理することに長けています。彼女は、部門横断的なチームの管理、複雑な調査モジュールの構築、そしてクライアント固有のビジネス目標に合わせたソリューションの調整に長けています。優れたコミュニケーション能力、リーダーシップ、そしてプレゼンテーション能力により、急速に変化する市場環境において、常に価値主導の成果を生み出しています。
- 過去2年間の分析、基準年、CAGRによる予測(7年間)
- PEST分析とSWOT分析
- 市場規模価値/数量 - 世界、地域、国
- 業界と競争環境
- Excel データセット
お客様の声
Insight PartnersのSCADAシステム市場レポートは包括的で、現在のトレンドと将来の予測に関する貴重な洞察が含まれています。チームは終始、非常にプロフェッショナルで、対応が早く、サポートも充実していました。私たちは彼らのサービスに非常に満足しており、強くお勧めします。
ラン・ケデム パートナー, レアリテクノロジーズ株式会社非常に特殊なソフトウェア市場に関するレポートを依頼したところ、チームは数日でレポートを作成してくれました。情報は非常に関連性が高く、分かりやすくまとめられていました。その後、レポートにいくつか修正と追加を依頼しましたが、チームは非常に迅速に対応し、1週間も経たないうちに最終レポートを受け取ることができました。
ジャン=エルヴェ・ジェン 会長, フューチャー・アナリティカ重要な市場調査と予測のために、The Insight Partnersと協力しました。彼らは機会とリスクに関する明確な洞察を提供し、私たちの計画策定に役立ちました。彼らの調査は使いやすく、確かなデータに基づいており、賢明で自信に満ちた意思決定に役立ちました。彼らを強くお勧めします。
ピユーシュ・ナグパル 上級副社長, ハイビームグローバルInsight Partnersは、深い専門知識に基づき、洞察力に富み、構造化された市場調査を提供しました。チームは終始プロフェッショナルで、対応力も抜群でした。ユーザーフレンドリーなウェブサイトにより、業界レポートへのアクセスもスムーズでした。信頼性の高い高品質な調査サービスをお探しなら、Insight Partnersを強くお勧めします。
安達幸彦 最高経営責任者(CEO), ディープブルーLLC。The Insight Partnersから市場レポートを購入するのは今回が初めてです。最初は不安でしたが、ウェブサイトを見て、リスクを負ってでも購入してみようという気持ちになりました。レポートの品質とカスタマーサービスには大変満足しています。最初のレポートにはいくつか質問やコメントがありましたが、アナリストとメールで何度かやり取りした結果、戦略策定プロセスへのインプットとして活用できるレポートが完成しました。貴重なお時間を割いていただき、貴重な体験をさせていただき、誠にありがとうございました。他の方にもぜひお勧めしたいですし、今後さらに市場データが必要になった際には、まずThe Insight Partnersにご連絡させていただきます。
ジョン・スズキ 社長兼最高経営責任者、取締役, BKテクノロジーズナイジェリアの感染症IVD市場に関する情報提供依頼に対し、ご対応いただいた際、ご尽力とプロフェッショナルな姿勢に深く感謝申し上げます。忍耐強く、的確なアドバイスをいただき、また、最終的に取引成立に至った割引のご提供にも深く感謝申し上げます。今回の最初の出会いで得た強い印象のおかげで、今後もThe Insight Partnersとの連携を心待ちにしております。
チジオケ博士 オニア マネージングディレクター, パインクレストヘルスケア株式会社購入理由
- 情報に基づいた意思決定
- 市場動向の理解
- 競合分析
- 顧客インサイト
- 市場予測
- リスク軽減
- 戦略計画
- 投資の正当性
- 新興市場の特定
- マーケティング戦略の強化
- 業務効率の向上
- 規制動向への対応


 無料サンプルを入手 - ビジョンガイドロボットソフトウェア市場