
視覚化および 3D レンダリング ソフトウェア市場の成長、規模、シェア、傾向、主要プレーヤーの分析、および 2030 年までの予測
可視化および3Dレンダリングソフトウェア市場の規模と予測(2020年 - 2030年)、世界および地域のシェア、傾向、成長機会分析レポートの対象範囲:アプリケーション別(トレーニングシミュレーション、マーケティングおよび広告、ビデオゲーム、製品の可視化、建築の可視化)、展開別(オンプレミスおよびクラウド)、エンドユーザー別(メディアおよびエンターテイメント、建築および建設、設計およびエンジニアリング、ヘルスケア、その他)
- ステータス : 出版
- レポートコード : TIPTE100000188
- カテゴリー : テクノロジー、メディア、通信
- ページ数 : 191
- 利用可能なレポート形式 :


- 最終更新日 : June 12, 2024

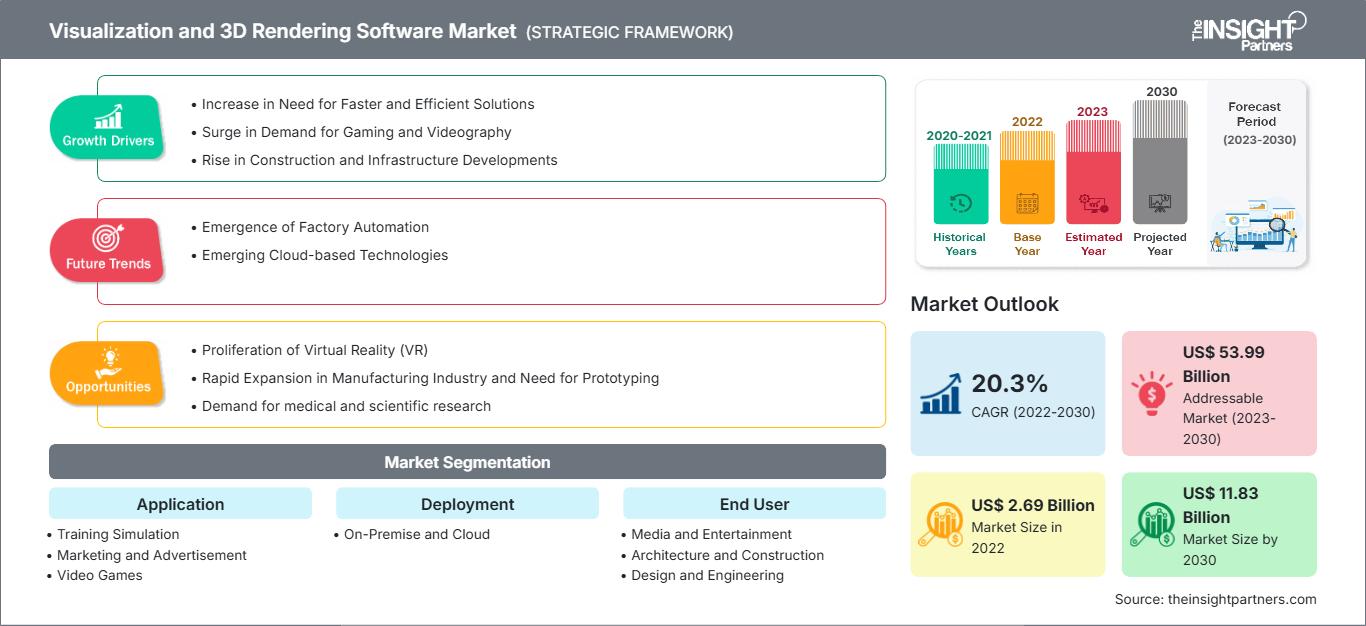
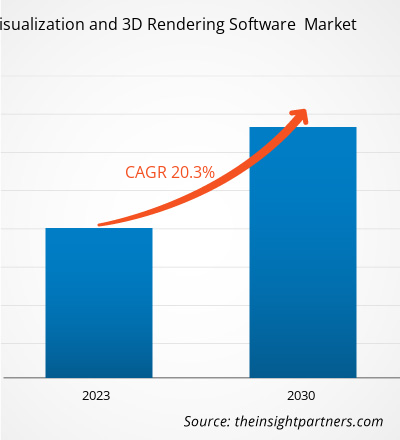
[調査レポート] 視覚化および 3D レンダリング ソフトウェア市場は、2022 年の 26 億 9,000 万米ドルから 2030 年には 118 億 3,000 万米ドルに成長すると予想されています。視覚化および 3D レンダリング ソフトウェア市場は、2022 年から 2030 年にかけて 20.3% の CAGR を記録すると予測されています。
視覚化および 3D レンダリング ソフトウェア市場アナリストの視点:
視覚化および 3D レンダリング ソフトウェア市場は、リアルな視覚表現が不可欠な幅広い業界とアプリケーションを網羅しています。この市場は、技術の進歩、没入型体験の需要の増加、視覚的コミュニケーションに依存する業界の拡大により、着実に成長しています。建築家、インテリア デザイナー、都市計画家は、3D レンダリング ソフトウェアを使用して、建物、インテリア、都市空間のリアルな視覚化を作成します。これにより、クライアントは設計コンセプトを理解し、情報に基づいた決定を下すことができます。たとえば、Autodeskの3ds MaxやTrimbleのSketchUpなどのソフトウェアは、建築ビジュアライゼーションで広く使用されています。映画、アニメーション、ゲーム業界では、魅力的なビジュアルを作成するために3Dレンダリングソフトウェアに大きく依存しています。たとえば、映画のレンダリングにはPixarのRenderMan、リアルタイムゲームグラフィックスにはEpic GamesのUnreal Engineが使用されています。また、不動産業者は3Dレンダリングソフトウェアを使用して仮想物件ツアーを作成し、潜在的な購入者が遠隔地から物件を探索できるようにしています。Matterportは、3D物件ツアーを作成するための人気のプラットフォームです。
3Dアニメーションの需要の増加、ARとVRの技術進歩、3Dコンテンツの需要の増加、3D表示デバイスの成長は、世界のビジュアライゼーションおよび3Dレンダリングソフトウェア市場を牽引しています。さらに、3Dコンテンツの精度を高めるために、ビジュアライゼーションおよび3Dレンダリングソフトウェアへの人工知能や機械学習などの技術の採用と統合の増加が、市場の成長を補完しています。これらすべての要因は、予測期間中に市場プレーヤーに十分な成長機会を提供すると予想されます。
視覚化および 3D レンダリング ソフトウェア市場の概要:
視覚化および 3D レンダリング ソフトウェア ツールは、ユーザーがオブジェクトの基本的な 3 次元モデルを設計するのに役立ちます。3D レンダリング テクノロジーは、製品設計、リアルタイム マーケティング、トレーニング、およびその他のさまざまな機能を支援します。世界中の企業や個人ユーザーは、視覚化および 3D レンダリング ソフトウェア ツールを使用して、問題領域や改善が必要な側面を特定することにより、運用を改善し、生産性を高め、リソースの使用を最適化しています。これらのツールは、エンジニアリングおよび建設、製造、輸送および物流などの土地中心の産業、およびメディアおよびエンターテイメント、ヘルスケア、教育などのその他の産業で広く採用されています。
要件に合わせてレポートをカスタマイズ
レポートの一部、国レベルの分析、Excelデータパックなどを含め、スタートアップ&大学向けに特別オファーや割引もご利用いただけます(無償)
可視化および3Dレンダリングソフトウェア市場: 戦略的洞察
-
このレポートの主要な市場動向を入手してください。この無料サンプルには、市場動向から見積もりや予測に至るまでのデータ分析が含まれます。
可視化および3Dレンダリングソフトウェア市場の牽引役:
より迅速で効率的なソリューションへのニーズの高まりが、可視化および3Dレンダリングソフトウェア市場の成長を促進
従来の3Dモデル設計方法は、時間とコストがかかります。そのため、可視化とシミュレーションは、新製品の導入を目指す企業にとって中核的な要素となっています。
3Dレンダリングツールは、さまざまな業界で広く採用されています。ユーザーは、これらのツールを使用することで、迅速かつリアルな画像を作成し、プロトタイプを設計し、構築前に空間を完全に視覚化して徹底的に理解することができます。また、企業が利用可能なスペースとリソースを最適化するのにも役立ちます。さらに、実際の製品を作成する前に、エラーを事前に回避し、より良い設計を確保するのに役立ちます。3Dレンダリングソフトウェアは、顧客へのプレゼンテーションやその他の活動で利用可能なスペースをより適切に視覚化できるため、企業にとって効果的なマーケティングツールとして機能します。
3Dモデルを使用すると、2Dモデルやその他のモデルよりも迅速に仮想のサイトや構造物を作成でき、多くのエラーを排除して時間を節約できます。エンジニアや建築家は、プロジェクトの設計に費やす時間を減らし、他の視覚化や製品設計のタスクに多くの時間を費やすことができます。また、専門家は事前に問題を特定できるため、スケジュールの変更や予算の増加を回避できます。
現在、市場には多くの3D視覚化ソフトウェアが販売されており、さまざまな業界や分野の要件に合わせて特別に設計されています。これらのソフトウェアは、企業の既存のワークフローに簡単に適合し、リアルタイムのインタラクションと最適化機能を備えた非常にリアルな表示を提供します。また、製品エンジニアリングプロセス全体の設計を強化し、意思決定能力を向上させるのに役立ちます。
このソフトウェアは、アニメーション開発と迅速な視覚化を可能にすることで、アニメーション、画像処理、グラフィック設計のプロセス全体を加速するのに役立ちます。さらに、追加モデルの必要性を排除します。これらすべての要因が、視覚化および 3D レンダリング ソフトウェア市場を牽引しています。
レポートのセグメンテーションと範囲:
視覚化および 3D レンダリング ソフトウェア市場は、アプリケーション、展開、エンド ユーザー、および地域に基づいて分割されています。アプリケーションに基づいて、視覚化および 3D レンダリング ソフトウェア市場は、トレーニング シミュレーション、マーケティングおよび広告、ビデオ ゲーム、製品の視覚化、および建築の視覚化に分割されています。展開に基づいて、視覚化および 3D レンダリング ソフトウェア市場は、オンプレミスとクラウドに分割されています。エンド ユーザーに基づいて、視覚化および 3D レンダリング ソフトウェア市場は、メディアおよびエンターテイメント、建築および建設、設計およびエンジニアリング、ヘルスケア、その他に分割されています。視覚化および 3D レンダリング ソフトウェア市場は、地域に基づいて、北米、ヨーロッパ、アジア太平洋、中東およびアフリカに分割されています。
セグメント分析:
導入に基づいて、視覚化および 3D レンダリング ソフトウェア市場は次のように分かれています。
- オンプレミス
- クラウド
オンプレミス セグメントは、2022 年に視覚化および 3D レンダリング ソフトウェアの市場シェアを拡大し、2022 年から 2030 年にかけて市場でより高い CAGR を記録すると予想されています。オンプレミス導入では、ハードウェアとソフトウェアは会社の敷地内にインストールされ、保守されます。オンプレミス ソリューションは、製造方法や使用されている技術など、すべてのビジネス プロセスと現在の内部システムを維持できるようにすることで、組織に大きなメリットをもたらします。また、データ セキュリティ標準を実装し、制限内に収められたプロセス全体を制御することもできます。したがって、これらの企業は、視覚化と 3D レンダリングを独自の監視下で実装および保守することを好みます。さらに、オンプレミス展開は、これらのシステムの維持に多額の資本を投資できる大規模で確立された企業によって主に採用されています。
地域分析:
視覚化および3Dレンダリングソフトウェア市場は、北米、ヨーロッパ、アジア太平洋(APAC)、中東およびアフリカ(MEA)、南米の5つの主要地域に大まかに分割されています。北米は、2022年に視覚化および3Dレンダリングソフトウェア市場で最大のシェアを占めました。この地域の市場成長は、有利な政府政策や新技術の採用に対する前向きな見通しなどの要因に起因しています。さらに、堅牢なデジタルインフラストラクチャと主要な市場プレーヤーの存在は、視覚化および3Dレンダリングソフトウェア市場が北米で繁栄するための道を開いています。さらに、この地域は世界最大のメディアおよびエンターテイメントセクターの本拠地であり、最新の設計およびアニメーションツールを使用して、強化されたグラフィックコンテンツを制作しています。世界のフォーチュン500企業のほとんどが、大規模な設計・研究開発センターを含め、この地域に拠点を置いています。製造企業は、市場で競争力のある製品を提供するために、可視化ツールや3Dレンダリングツールなどの設計ツールに多額の投資を行っています。さらに、巨大な製造業の存在は、北米の物流業界を補完する役割を果たしています。物流業界は、リソースの最適化に重点を置き、倉庫施設の有効活用を図るため、可視化ツールや3Dレンダリングツールなどの先進技術への投資を積極的に行っています。
主要企業分析:
本レポートで紹介されている主要な可視化および3Dレンダリングソフトウェア市場プレーヤーは、Autodesk Inc、Christie Digital Systems Inc、Dassault Systemes SE、NVIDIA Corp、Chaos Group、Luxion Inc、OTOY Inc、Next Limit、Act-3D、Thea Render by Altairです。
可視化および3Dレンダリングソフトウェア市場の地域別分析
The Insight Partnersのアナリストは、予測期間を通じてビジュアライゼーションおよび3Dレンダリングソフトウェア市場に影響を与える地域的な傾向と要因を詳細に解説しています。このセクションでは、北米、ヨーロッパ、アジア太平洋、中東・アフリカ、中南米におけるビジュアライゼーションおよび3Dレンダリングソフトウェア市場のセグメントと地域についても解説しています。
可視化および3Dレンダリングソフトウェア市場レポートの範囲
| レポート属性 | 詳細 |
|---|---|
| の市場規模 2022 | US$ 2.69 Billion |
| 市場規模別 2030 | US$ 11.83 Billion |
| 世界的なCAGR (2022 - 2030) | 20.3% |
| 過去データ | 2020-2021 |
| 予測期間 | 2023-2030 |
| 対象セグメント |
By アプリケーション
|
| 対象地域と国 |
北米
|
| 市場リーダーと主要企業の概要 |
|
可視化および3Dレンダリングソフトウェア市場のプレーヤー密度:ビジネスダイナミクスへの影響を理解する
ビジュアライゼーションおよび3Dレンダリングソフトウェア市場は、消費者の嗜好の変化、技術の進歩、製品メリットへの認知度の高まりといった要因によるエンドユーザー需要の高まりに牽引され、急速に成長しています。需要の増加に伴い、企業は製品ラインナップの拡充、消費者ニーズへの対応のためのイノベーション、そして新たなトレンドの活用を進めており、これが市場の成長をさらに加速させています。
- 入手 可視化および3Dレンダリングソフトウェア市場 主要プレーヤーの概要
最近の動向:
ビジュアライゼーションおよび3Dレンダリングソフトウェア市場のプレーヤーは、無機戦略と有機戦略を積極的に採用しています。最近の主要な市場動向をいくつか以下に示します。
- 2022年、Autodeskは、大手映画製作会社が使用するデジタルデイリー用の強力なクラウドベースプラットフォームを開発するニュージーランドに拠点を置くMoxionの買収を発表しました。
- 2022年、Jaguar Land RoverとNVIDIAは、顧客体験にインテリジェンスを融合させることで、現代のラグジュアリーを再定義します。また、DRIVE IXソフトウェアスタックを活用し、ドライバーと乗員のモニタリング、高度なビジュアライゼーションなど、車内にAI機能を提供します。
- 2022年、ChaosとEnscapeが合併し、TAアソシエイツとLEAパートナーの支援を受けます。テクノロジーに特化したプライベートエクイティファームが、建築、エンジニアリング、建設向けのリアルタイムレンダリングおよび設計ワークフローテクノロジーの大手開発企業であるEnscapeを合併します。

アンキタは、テクノロジー、メディア、ICT、エレクトロニクス・半導体の各分野で8年以上の経験を持つ、ダイナミックな市場調査およびコンサルティングのプロフェッショナルです。Microsoft、Oracle、NEC、SAP、KPMG、Expeditors Internationalといったグローバルクライアントに対し、100件以上のコンサルティングおよび調査案件を主導・遂行してきました。彼女のコアコンピテンシーは、市場評価、データ分析、予測、戦略策定、競合情報、レポート作成です。
アンキタは、販売前の提案書作成やクライアントとの協議から、販売後の実用的なインサイトの提供まで、プロジェクトサイクル全体を巧みに管理することに長けています。彼女は、部門横断的なチームの管理、複雑な調査モジュールの構築、そしてクライアント固有のビジネス目標に合わせたソリューションの調整に長けています。優れたコミュニケーション能力、リーダーシップ、そしてプレゼンテーション能力により、急速に変化する市場環境において、常に価値主導の成果を生み出しています。
- 包括的な市場規模および予測分析
- 詳細なセグメンテーション分析
- 市場動向(ダイナミクス)の徹底的な評価
- 地域および国別のインサイト
- 競争環境および企業ベンチマーク
- 戦略的ビジネスインテリジェンス
お客様の声
Insight PartnersのSCADAシステム市場レポートは包括的で、現在のトレンドと将来の予測に関する貴重な洞察が含まれています。チームは終始、非常にプロフェッショナルで、対応が早く、サポートも充実していました。私たちは彼らのサービスに非常に満足しており、強くお勧めします。
ラン・ケデム パートナー, レアリテクノロジーズ株式会社非常に特殊なソフトウェア市場に関するレポートを依頼したところ、チームは数日でレポートを作成してくれました。情報は非常に関連性が高く、分かりやすくまとめられていました。その後、レポートにいくつか修正と追加を依頼しましたが、チームは非常に迅速に対応し、1週間も経たないうちに最終レポートを受け取ることができました。
ジャン=エルヴェ・ジェン 会長, フューチャー・アナリティカ重要な市場調査と予測のために、The Insight Partnersと協力しました。彼らは機会とリスクに関する明確な洞察を提供し、私たちの計画策定に役立ちました。彼らの調査は使いやすく、確かなデータに基づいており、賢明で自信に満ちた意思決定に役立ちました。彼らを強くお勧めします。
ピユーシュ・ナグパル 上級副社長, ハイビームグローバルInsight Partnersは、深い専門知識に基づき、洞察力に富み、構造化された市場調査を提供しました。チームは終始プロフェッショナルで、対応力も抜群でした。ユーザーフレンドリーなウェブサイトにより、業界レポートへのアクセスもスムーズでした。信頼性の高い高品質な調査サービスをお探しなら、Insight Partnersを強くお勧めします。
安達幸彦 最高経営責任者(CEO), ディープブルーLLC。The Insight Partnersから市場レポートを購入するのは今回が初めてです。最初は不安でしたが、ウェブサイトを見て、リスクを負ってでも購入してみようという気持ちになりました。レポートの品質とカスタマーサービスには大変満足しています。最初のレポートにはいくつか質問やコメントがありましたが、アナリストとメールで何度かやり取りした結果、戦略策定プロセスへのインプットとして活用できるレポートが完成しました。貴重なお時間を割いていただき、貴重な体験をさせていただき、誠にありがとうございました。他の方にもぜひお勧めしたいですし、今後さらに市場データが必要になった際には、まずThe Insight Partnersにご連絡させていただきます。
ジョン・スズキ 社長兼最高経営責任者、取締役, BKテクノロジーズナイジェリアの感染症IVD市場に関する情報提供依頼に対し、ご対応いただいた際、ご尽力とプロフェッショナルな姿勢に深く感謝申し上げます。忍耐強く、的確なアドバイスをいただき、また、最終的に取引成立に至った割引のご提供にも深く感謝申し上げます。今回の最初の出会いで得た強い印象のおかげで、今後もThe Insight Partnersとの連携を心待ちにしております。
チジオケ博士 オニア マネージングディレクター, パインクレストヘルスケア株式会社購入理由
- 情報に基づいた意思決定
- 市場動向の理解
- 競合分析
- 顧客インサイト
- 市場予測
- リスク軽減
- 戦略計画
- 投資の正当性
- 新興市場の特定
- マーケティング戦略の強化
- 業務効率の向上
- 規制動向への対応


