공항 연료 공급 장비 시장 분석 및 예측(크기, 점유율, 성장, 동향 2030)
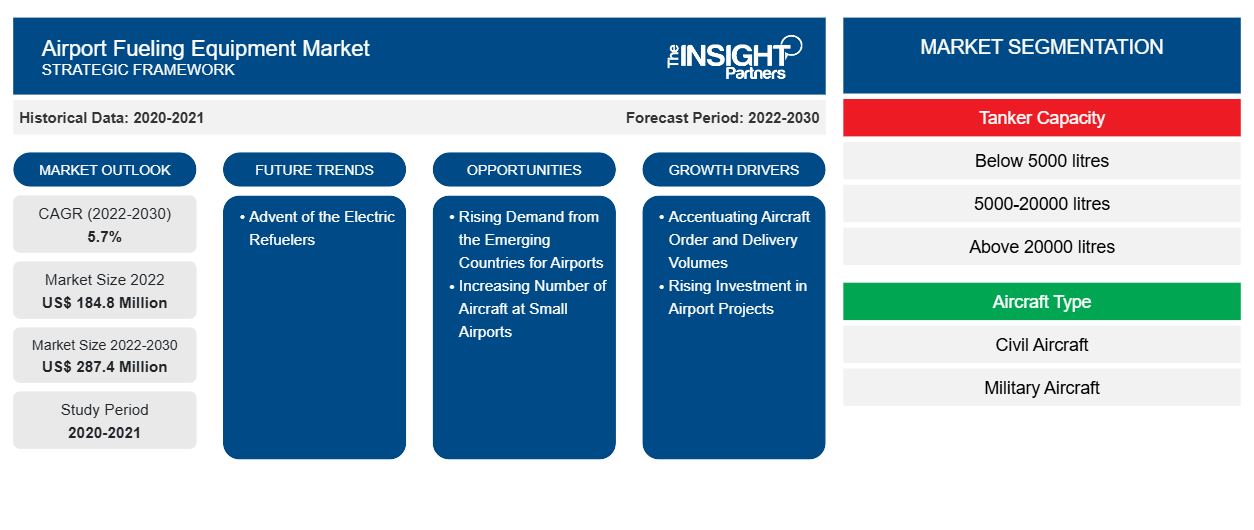
이전 데이터 : 2020-2021 | 기준 연도 : 2022 | 예측 기간 : 2022-2030공항 연료 장비 시장 규모 및 예측(2020-2030), 글로벌 및 지역별 점유율, 추세 및 성장 기회 분석 보고서 범위: 탱커 용량(5000리터 미만, 5000-20000리터, 20000리터 초과), 항공기 유형(민간 항공기, 군용 항공기), 전원(전기, 비전기) 및 지역별
- 상태 : 게시됨
- 보고서 코드 : TIPRE00030028
- 범주 : 항공우주 및 방위
- 페이지 수 : 148
- 사용 가능한 보고서 형식 :


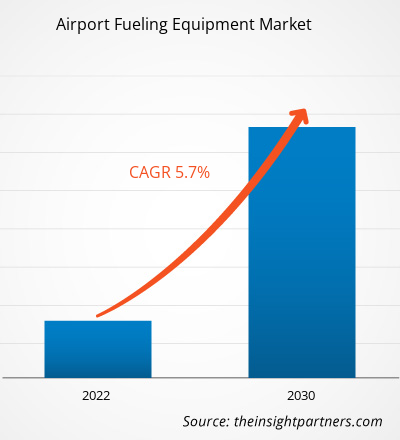
공항 연료 장비 시장 규모는 2022년 1억 8,480만 달러에서 2030년까지 2억 8,740만 달러에 도달할 것으로 예상됩니다. 이 시장은 2022~2030년에 5.7%의 CAGR을 기록할 것으로 예상됩니다. 공항 연료 장비는 공항의 특정 요구 사항과 요구 사항 및 서비스를 제공하는 항공기 함대의 규모에 따라 탱커 용량이 다를 수 있습니다. 탱커 용량은 각 연료 보급 작업 중에 항공기에 공급할 수 있는 연료량을 결정합니다. 적절한 탱커 용량의 선택은 서비스를 제공하는 항공기의 평균 연료 소비량, 연료 보급 작업 빈도, 공항의 연료 보급 인프라 및 저장 용량과 같은 요인을 기반으로 합니다. 적절한 크기의 연료 보급 장비는 가동 중지 시간을 최소화하는 동시에 효율적이고 시기적절한 연료 보급 작업을 보장합니다. 이러한 모든 요인은 항공 산업에서 공항 연료 보급 장비에 대한 수요를 충족하는 데 기여합니다.
공항 연료 공급 장비 시장 분석
신흥 시장에서 항공 여행이 계속 증가함에 따라 증가하는 항공편과 승객 수를 지원하기 위해 현대적이고 효율적인 연료 공급 운영에 대한 수요가 커지고 있습니다. 많은 신흥 경제권이 연결성과 관광 및 무역에 대한 관심을 높이기 위해 공항 인프라에 많은 투자를 하고 있습니다. 새로운 공항을 건설하고 기존 공항을 확장하려면 국제 표준을 충족하고 다양한 항공기에 맞는 최신 연료 공급 장비가 필요합니다. 예를 들어, 2023년 4월 인도 정부는 향후 2년 동안 공항 인프라 개발에 약 118억 1천만 달러를 투자할 계획이라고 발표했습니다. 이 투자는 증가하는 여행 수요와 증가하는 승객 과 항공기 수를 수용하기 위해 기존 공항 시설을 업그레이드하고 확장해야 할 필요성에 대한 대응입니다. 이 투자로 인해 연료 공급 프로세스를 포함한 공항 운영에서 첨단 기술과 자동화 도입이 빠르게 증가하고 있습니다. 스마트 연료 공급 장비 및 모니터링 시스템은 연료 효율성을 최적화하고 오류 위험을 줄일 수 있습니다. 따라서 공항 인프라의 급격한 개발은 혁신적이고 진보된 공항 연료 공급 장비에 유리한 시장 환경을 조성하여 공항 연료 공급 장비 시장 이 성장하도록 이끕니다.
공항 연료 공급 장비 시장 개요
군용 및 민간 공항 연료 공급 장비는 서로 다른 용도로 사용되며 해당 응용 분야의 특정 요구 사항을 충족하도록 설계되었습니다. 군용 연료 공급 장비는 전투기, 수송기, 헬리콥터 및 무인 항공기(UAV)를 포함한 군용 항공기의 연료 공급 요구 사항을 지원하도록 설계되었습니다. 군용 연료 공급 작업에는 종종 다양한 유형의 군용 항공기 및 연료 유형을 처리하기 위한 특정 보안 조치와 전문 장비가 필요합니다. 민간 공항 연료 공급 장비는 항공 규정 및 안전 표준을 준수하여 상업용 여객기, 개인용 제트기 및 기타 민간 항공기와 같은 광범위한 민간 항공기에 연료를 공급하는 데 사용됩니다. 군용 연료 공급 장비는 종종 원격 지역 및 전투 지역을 포함한 다양한 작전 지역에서 이동성과 배치 용이성을 위해 설계됩니다.
귀하의 요구 사항에 맞게 이 보고서를 사용자 정의하세요
이 보고서의 일부 또는 국가 수준 분석, Excel 데이터 팩을 포함하여 모든 보고서에 대한 사용자 정의를 무료로 받을 수 있으며 신생 기업 및 대학을 위한 훌륭한 혜택과 할인 혜택을 이용할 수 있습니다.
공항 연료 장비 시장: 전략적 통찰력
-
이 보고서의 주요 시장 동향을 알아보세요.이 무료 샘플에는 시장 동향부터 추정 및 예측까지 다양한 데이터 분석이 포함됩니다.
공항 연료 장비 시장 동인 및 기회
공항 프로젝트에 대한 투자 증가
전 세계 공항 수는 최대한 많은 항공사와 승객을 수용하기 위해 증가해 왔으며, 이로 인해 기존 공항을 새로운 터미널로 확장하고 새로운 공항을 건설하는 데 대한 투자도 증가했습니다. 그 결과, 새로운 공항 연료 장비에 대한 수요가 상당히 증가했습니다. 새로운 공항에 대한 투자 증가는 시장의 주요 원동력 중 하나입니다. 공항 컨설턴트 협의회에 따르면, 미국만 해도 2020년부터 시작하여 향후 5년 동안 약 1,380억 달러의 투자가 필요할 것입니다.
또한 여러 항공 소식통에 따르면 항공 여객 수요를 충족하기 위해 다양한 국가에서 그린필드 공항과 기존 공항 인프라 확장에 막대한 자본 투자가 필요합니다. 2021년에서 2040년 사이에 총 자본 투자가 약 2조 달러가 필요할 것으로 예상됩니다. 공항 건설 프로젝트에 대한 이러한 막대한 자본 투자 요구 사항은 필요한 시기에 연료를 보다 효율적으로 공급하기 위한 새로운 연료 장비에 대한 수요를 촉진할 것입니다. 따라서 공항 프로젝트에 대한 투자 증가는 시장의 주요 원동력입니다.
소규모 공항의 항공기 수 증가
소규모 공항은 공항 교통량이 증가하고 있으며 요구 사항을 충족하기 위한 연료 공급 서비스 문제를 겪고 있습니다. 예를 들어, 항공기 운영자 중 한 명에 따르면 대부분의 조종사 또는 항공기 운영자는 항공기에 연료를 공급하기 위해 조지 공항보다 모셀 베이 공항을 선호합니다. 따라서 조지 공항의 연료 공급 시설에서 긴 줄과 대기 시간이 발생합니다. 이러한 소규모 공항은 시장 참여자에게 잠재적인 기회가 될 수 있습니다.
공항 연료 장비 시장 보고서 세분화 분석
공항 연료 장비 시장 분석에 기여한 주요 세그먼트는 탱커 용량, 항공기 유형, 전원 및 지리입니다.
- 탱커 용량을 기준으로 공항 연료 장비 시장은 5,000리터 미만, 5,000~20,000리터, 20,000리터 이상으로 세분화되었습니다. 5,000~20,000리터 세그먼트는 2022년에 더 큰 시장 점유율을 차지했습니다.
- 항공기 유형별로 공항 연료 장비 시장은 민간 항공기와 군용 항공기로 세분화되었습니다. 민간 항공기 부문은 2022년에 시장에서 가장 큰 점유율을 차지했습니다.
- 전원에 따라 공항 연료 장비 시장은 전기 및 비전기 부문으로 세분화되었습니다. 비전기 부문은 2022년에 더 큰 시장 점유율을 차지했습니다.
지역별 공항 연료 장비 시장 점유율 분석
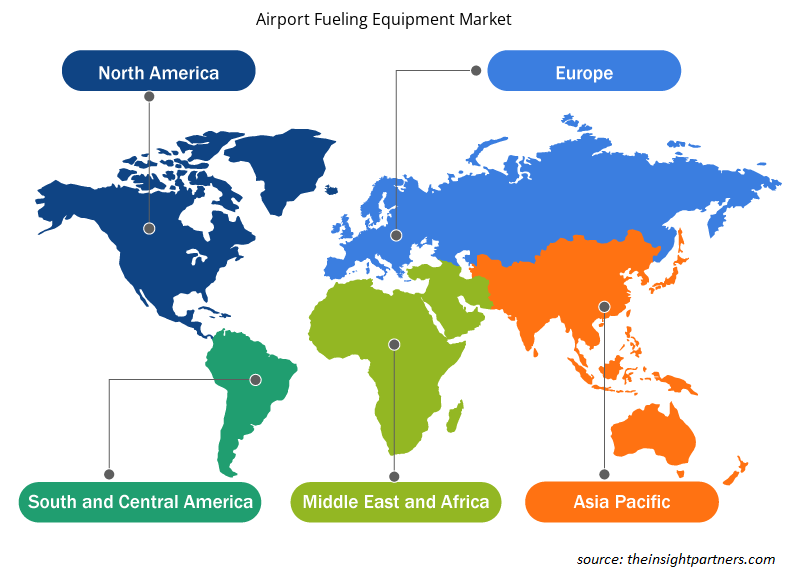
공항 연료 장비 시장 보고서의 지리적 범위는 주로 북미, 유럽, 아시아 태평양, 중동 및 아프리카, 남미의 5개 지역으로 나뉩니다.
북미는 2022년 공항 연료 장비 시장을 지배했으며, 예측 기간 동안에도 지배력을 유지할 것으로 예상됩니다. 나아가 아시아 태평양 지역은 2022~2030년 동안 공항 연료 장비 시장에서 가장 높은 CAGR을 기록할 가능성이 높습니다. 북미 전역의 다양한 공항에서 증가하는 승객과 항공편을 수용하기 위해 많은 현대화 및 확장 프로젝트가 시작되었습니다. 이러한 프로젝트에는 종종 운영 효율성과 연료 스테이션 용량을 개선하기 위한 고급 연료 장비에 대한 투자가 포함됩니다. 2023년 2월, 미국 연방 항공청(FAA)은 전국의 99개 공항에 약 10억 달러의 자금을 제공하겠다고 발표했습니다. 이는 항공 산업의 회복을 지원하고 항공 교통량 증가에 대비하는 데 중요한 조치입니다. 이 자금은 미국 대통령의 양당 인프라법의 일부로, 증가하는 승객과 항공편을 관리하기 위해 공항 인프라와 용량을 강화하는 것을 목표로 합니다. 따라서 강력한 항공 산업, 인프라 개발, 기술 발전, 지속 가능성 노력 및 정부 지원은 북미 지역의 공항 연료 장비 시장에 유리한 환경을 조성하는 몇 가지 요인입니다. 공항이 운영 효율성을 높이고 원활한 여행 경험을 제공하기 위해 노력함에 따라 혁신적이고 효율적인 연료 장비에 대한 수요는 예측 기간 동안 계속 증가할 것으로 예상됩니다.
공항 연료 장비 시장 지역 통찰력
Insight Partners의 분석가들은 예측 기간 동안 공항 연료 장비 시장에 영향을 미치는 지역적 추세와 요인을 철저히 설명했습니다. 이 섹션에서는 북미, 유럽, 아시아 태평양, 중동 및 아프리카, 남미 및 중미의 공항 연료 장비 시장 세그먼트와 지리에 대해서도 설명합니다.
- 공항 연료 장비 시장에 대한 지역별 특정 데이터 얻기
공항 연료 장비 시장 보고서 범위
| 보고서 속성 | 세부 |
|---|---|
| 2022년 시장 규모 | 1억 8,480만 달러 |
| 2030년까지 시장 규모 | 2억 8,740만 달러 |
| 글로벌 CAGR (2022-2030) | 5.7% |
| 역사적 데이터 | 2020-2021 |
| 예측 기간 | 2022-2030 |
| 다루는 세그먼트 |
탱커 용량별
|
| 포함된 지역 및 국가 |
북아메리카
|
| 시장 선도 기업 및 주요 회사 프로필 |
|
공항 연료 장비 시장 참여자 밀도: 비즈니스 역학에 미치는 영향 이해
공항 연료 장비 시장은 소비자 선호도의 변화, 기술 발전, 제품의 이점에 대한 인식 증가와 같은 요인으로 인해 최종 사용자 수요가 증가함에 따라 빠르게 성장하고 있습니다. 수요가 증가함에 따라 기업은 제품을 확장하고, 소비자의 요구를 충족하기 위해 혁신하고, 새로운 트렌드를 활용하여 시장 성장을 더욱 촉진하고 있습니다.
시장 참여자 밀도는 특정 시장이나 산업 내에서 운영되는 회사나 기업의 분포를 말합니다. 주어진 시장 공간에 얼마나 많은 경쟁자(시장 참여자)가 존재하는지 그 규모나 전체 시장 가치에 비해 나타냅니다.
공항 연료 장비 시장에서 운영되는 주요 회사는 다음과 같습니다.
- 가사이트 프로그레스 LLC
- 타이탄 항공 SA
- 퓨얼 프루프 유한회사
- 잉 박사. Ulrich Esterer GmbH & Co Fahrzeugaufbauten 및 Anlagen KG
- 베타 연료 시스템 LLC
면책 조항 : 위에 나열된 회사는 어떤 특별한 순서에 따라 순위가 매겨지지 않았습니다.
- 공항 연료 장비 시장 주요 업체 개요를 알아보세요
공항 연료 장비 시장 뉴스 및 최근 개발
공항 연료 장비 시장은 1차 및 2차 조사 이후의 정성적, 정량적 데이터를 수집하여 평가되며, 여기에는 중요한 기업 간행물, 협회 데이터 및 데이터베이스가 포함됩니다. 다음은 공항 연료 장비 시장과 전략에 대한 시장의 개발 목록입니다.
- 2023년, Stokota 회사는 폴란드 엘블라그에 새로운 생산 홀을 건설하여 활동을 확장할 계획이라고 발표했습니다. 이를 위해 Warmia와 Mazury 특별 경제 구역에서 새로운 투자를 위해 약 4ha의 토지를 매입하기로 최종 결정했습니다. (출처: Stokota, 보도자료/회사 웹사이트/뉴스레터)
- 2021년 TotalEnergies는 Titan Aviation과 협력하여 광범위한 전기 급유 차량을 출시했습니다. Titan e-RRX 및 Titan SPR-Xe와 같은 제품은 EZ Control이라는 디지털 MMI를 특징으로 합니다. (출처: TotalEnergies, 보도자료/회사 웹사이트/뉴스레터)
공항 연료 장비 시장 보고서 범위 및 제공물
“공항 연료 장비 시장 규모 및 예측(2020-2030)” 보고서는 아래 영역을 포괄하는 시장에 대한 자세한 분석을 제공합니다.
- 범위에 포함된 모든 주요 시장 세그먼트에 대한 글로벌, 지역 및 국가 수준의 시장 규모 및 예측
- 동인, 제약 및 주요 기회와 같은 시장 역학
- 주요 미래 트렌드
- 포터의 5가지 힘에 대한 자세한 분석
- 주요 시장 동향, 주요 업체, 규정 및 최근 시장 동향을 포괄하는 글로벌 및 지역 시장 분석
- 시장 집중도, 히트맵 분석, 유명 기업 및 최근 개발 사항을 포함하는 산업 환경 및 경쟁 분석
- SWOT 분석을 통한 자세한 회사 프로필

나빈은 맞춤형, 신디케이트 및 컨설팅 프로젝트 전반에 걸쳐 9년 이상의 전문 지식을 보유한 시장 조사 및 컨설팅 전문가입니다. 현재 부사장으로 재직 중이며, 프로젝트 가치 사슬 전반의 이해관계자들을 성공적으로 관리해 왔으며, 100편 이상의 연구 보고서와 30건 이상의 컨설팅 업무를 수행했습니다. 그는 산업 및 정부 프로젝트 전반에 걸쳐 다양한 업무를 수행하며 고객 성공과 데이터 기반 의사 결정에 크게 기여하고 있습니다.
나빈은 카르나타카주 VTU에서 전자통신 공학 학위를, 마니팔 대학교에서 마케팅 및 운영 MBA를 취득했습니다. 그는 9년 동안 IEEE 회원으로 활발하게 활동하며 컨퍼런스, 기술 심포지엄에 참여하고 지역 및 지역 차원에서 자원봉사 활동을 해왔습니다. 현재 직책을 맡기 전에는 IndustryARC에서 준전략 컨설턴트로, 휴렛팩커드(HP Global)에서 산업용 서버 컨설턴트로 근무했습니다.
- 과거 분석(2년), 기준 연도, CAGR을 포함한 예측(7년)
- PEST 및 SWOT 분석
- 시장 규모 가치/거래량 - 글로벌, 지역, 국가
- 산업 및 경쟁 환경
- Excel 데이터세트
사용 후기
Insight Partners의 SCADA 시스템 시장 보고서는 포괄적이며, 현재 동향과 미래 전망에 대한 귀중한 통찰력을 제공합니다. 팀은 매우 전문적이고, 신속하게 대응하며, 처음부터 끝까지 지원해 주었습니다. 저희는 매우 만족하며 Insight Partners의 서비스를 적극 추천합니다.
란 케뎀 파트너, Reali Technologies LTDs아주 구체적인 소프트웨어 시장에 대한 보고서를 요청했는데, 팀에서 며칠 만에 보고서를 작성해 주셨습니다. 정보는 매우 관련성이 높고 잘 정리되어 있었습니다. 그 후 보고서에 몇 가지 수정과 추가 사항을 요청했습니다. 팀원들의 응답도 매우 빨랐고, 일주일도 채 되지 않아 최종 보고서를 받았습니다.
장-에르브 젠 의장, 퓨처 애널리티카The Insight Partners와 함께 중요한 시장 조사 및 예측 작업을 진행했습니다. Insight Partners는 기회와 위험에 대한 명확한 통찰력을 제공하여 계획을 세우는 데 큰 도움이 되었습니다. The Insight Partners의 조사는 사용하기 쉬웠고, 탄탄한 데이터를 기반으로 했습니다. 덕분에 현명하고 자신 있는 결정을 내릴 수 있었습니다. The Insight Partners를 강력 추천합니다.
피유시 나그팔 수석 부사장, 하이빔 글로벌Insight Partners는 탄탄한 분야 전문성을 바탕으로 통찰력 있고 체계적인 시장 조사를 제공했습니다. Insight Partners 팀은 처음부터 끝까지 전문적이고 신속하게 대응했습니다. 사용자 친화적인 웹사이트 덕분에 업계 보고서에 쉽게 접근할 수 있었습니다. 신뢰할 수 있고 고품질의 조사 서비스를 원하신다면 Insight Partners를 강력 추천합니다.
아다치 유키히코 대표이사, 딥블루 주식회사The Insight Partners에서 시장 보고서를 구매한 것은 이번이 처음입니다. 처음에는 확신이 없었지만, 웹사이트를 방문하고 나서 위험을 감수하고 시장 보고서를 구매하는 것이 더 편하다는 것을 알게 되었습니다. 보고서의 품질과 고객 서비스에 매우 만족합니다. 처음 보고서를 보고 몇 가지 질문과 의견이 있었지만, 분석가와 이메일로 몇 차례 대화를 나눈 후, 전략 기획 과정에 참고할 수 있는 보고서를 확보했다고 생각합니다. 시간을 내어 긍정적인 경험을 선사해 주셔서 정말 감사합니다. 다른 사람들에게도 귀사의 서비스를 적극 추천할 것이며, 추가적인 시장 데이터가 필요할 때면 가장 먼저 귀사에 연락하겠습니다.
존 스즈키 사장 겸 최고 경영자, 이사회 이사, BK 테크놀로지스나이지리아 감염성 질환 IVD 시장 관련 정보 요청에 응해 주신 귀사의 지원과 전문성에 감사드립니다. 귀사의 인내심과 지도, 그리고 할인 혜택을 기꺼이 제공해 주셔서 결국 계약을 성사시킬 수 있었습니다. 첫 만남을 통해 귀사가 저에게 심어주신 좋은 인상을 바탕으로 앞으로도 The Insight Partners와 함께할 수 있기를 기대합니다.
치지오케 박사 오니아 전무이사, 파인크레스트 헬스케어 유한회사구매 이유
- 정보에 기반한 의사 결정
- 시장 역학 이해
- 경쟁 분석
- 고객 인사이트
- 시장 예측
- 위험 완화
- 전략 기획
- 투자 타당성 분석
- 신흥 시장 파악
- 마케팅 전략 강화
- 운영 효율성 향상
- 규제 동향에 발맞춰 대응


 무료 샘플 받기 - 공항 연료 공급 장비 시장