
2028년까지 콘빔 컴퓨터 단층촬영 시장 성장, 규모, 점유율, 추세, 주요 업체 분석 및 예측
2028년까지 콘빔 컴퓨터 단층촬영 시장 전망 - COVID-19 영향 및 유형(서 있는 자세, 앉은 자세, 앙와위), 응용 분야(치과, 이비인후과, 유방암, 정형외과, 두개골 기저부 등), 최종 사용자(병원 및 진료소, 진단 센터 등)별 글로벌 분석
- 상태 : 게시됨
- 보고서 코드 : TIPRE00002889
- 범주 : 생명과학
- 페이지 수 : 199
- 사용 가능한 보고서 형식 :


- 최종 업데이트 일자 : June 13, 2024

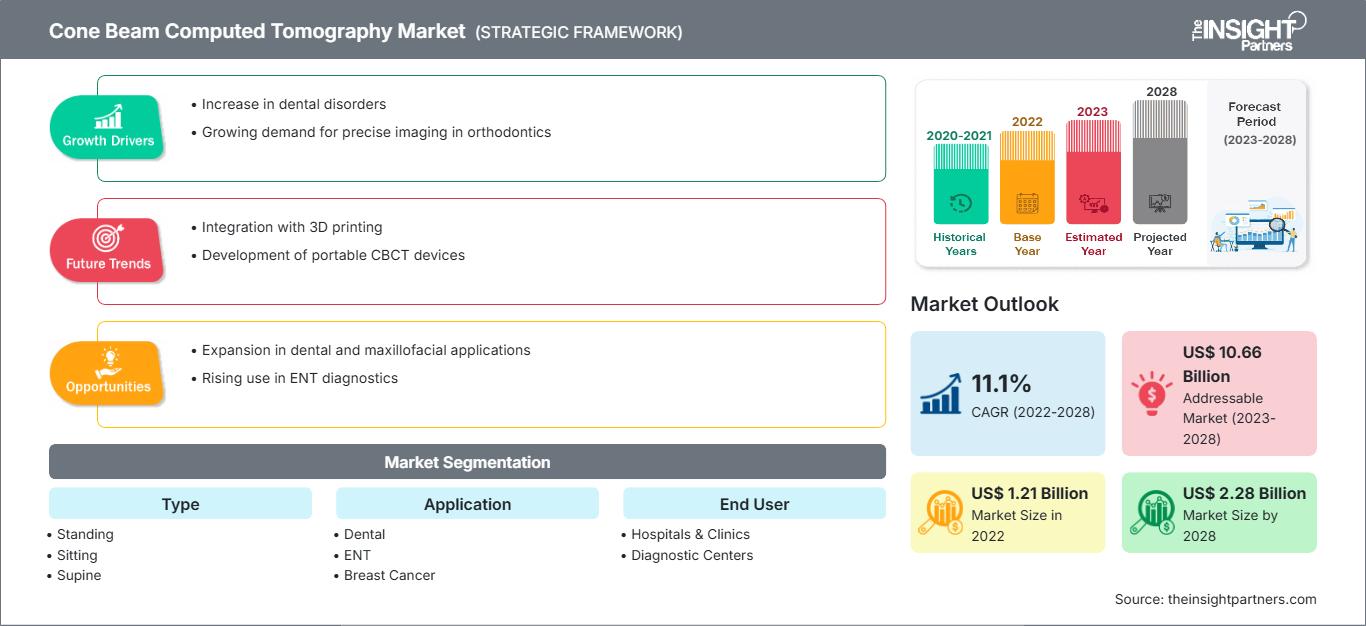
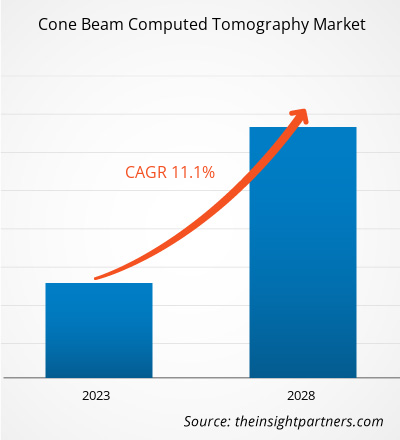
콘 빔 컴퓨터 단층촬영(CT) 시장은 2022년 12억 1,451만 달러에서 2028년 22억 7,841만 달러로 성장할 것으로 예상되며, 2022년부터 2028년까지 연평균 성장률(CAGR) 11.1%로 성장할 것으로 예상됩니다.
콘 빔 컴퓨터 단층촬영은 기존 컴퓨터 단층촬영(CT) 시스템을 변형한 방식입니다. 치과 전문의가 사용하는 콘 빔 컴퓨터 단층촬영 시스템은 환자 주위를 회전하며 원뿔 모양의 X선 빔을 사용하여 데이터를 수집합니다. 이 데이터는 치아, 구강 및 악안면 부위(입, 턱, 목), 귀, 코, 목의 3차원 이미지를 재구성하는 데 사용됩니다.
콘 빔 컴퓨터 단층촬영 시장은 유형, 용도, 최종 사용자 및 지역을 기준으로 세분화됩니다. 지역별로 시장은 북미, 유럽, 아시아 태평양, 중동 및 기타 지역으로 크게 세분화됩니다. 아프리카, 중남미. 본 보고서는 시장 동향, 기술 발전, 그리고 시장 역학을 중심으로 시장에 대한 통찰력과 심층 분석을 제공합니다. 또한 세계 주요 시장 참여자들의 경쟁 환경 분석도 제공합니다.
이 보고서의 일부, 국가 수준 분석, Excel 데이터 팩을 포함하여 모든 보고서에 대한 사용자 정의를 무료로 받을 수 있을 뿐만 아니라 스타트업 및 대학을 위한 훌륭한 제안 및 할인을 이용할 수 있습니다
콘빔 컴퓨터 단층촬영 시장: 전략적 통찰력
-
이 보고서의 주요 주요 시장 동향을 확인하세요.이 무료 샘플에는 시장 동향부터 추정 및 예측에 이르기까지 데이터 분석이 포함됩니다.
시장 분석
CBCT 장비에 소프트웨어 도구 통합, 시장 성장 촉진
CBCT 시스템에 소프트웨어 도구를 통합함으로써 사용자는 복잡한 진단 절차를 자동화 및 표준화하고, 환자 경험과 진단 결과를 개선하며, 치료 비용을 절감하고, CBCT 시스템의 기능을 향상시킬 수 있습니다. CBCT 스캔 데이터를 분석하고 해석하는 것은 숙련된 임상 전문가에게도 어려울 수 있습니다. 이 소프트웨어 시스템은 치과 기공소, 치과 의사, 임플란트 전문의, 그리고 외과의에게 최고의 유연성과 정밀성을 제공하도록 개발되었습니다. CBCT와 소프트웨어를 통합하면 의사는 진단 범위를 확장하고 치료 계획 수립 과정에서 환자의 해부학적 구조에 대한 가시성을 높일 수 있습니다. CBCT 시스템에 PACS(영상 저장 및 전송 시스템)를 통합하면 카메라 영상을 촬영 및 편집하고, 클라우드를 통해 영상을 공유하고, 효율적인 치료 계획을 수립할 수 있습니다. PACS는 주로 디지털 전자 영상을 저장하고 안전하게 전송하는 데 사용되는 의료 영상 기술입니다. PACS를 통해 여러 위치에 있는 의사들이 동일한 데이터를 동시에 검토할 수 있습니다. 디지털 헬스케어 기업들은 CBCT 시스템용 소프트웨어 개발에 투자하고 있습니다. 따라서 데이터 분석, 해석 및 보관을 간소화하는 소프트웨어 도구와 CBCT 기기를 통합하는 것이 콘빔 컴퓨터 단층촬영(CT) 시장의 성장에 기여하고 있습니다.
기술 발전과 R&D로 CBCT 시장에 새로운 트렌드가 창출됩니다.
특히 디지털 영상 시스템의 기술 발전은 진단 및 수술 과정의 개선으로 이어졌습니다. 이는 첨단 영상 시스템이 환자의 방사선 노출을 줄이면서 의료 서비스 제공자에게 상세한 정보를 제공할 수 있게 된 데 기인합니다. CBCT 기술을 통해 치과 의사들은 더 낮은 방사선량으로 더 많은 데이터를 수집할 수 있게 되었습니다. 이전에는 의사들이 진단 및 치료 계획을 위해 2차원 영상에 의존했습니다. 그러나 2D 기술은 종종 여러 번의 노출을 필요로 합니다. 따라서 진단 분야에서 3D 스캐닝의 인기가 더욱 높아지고 있습니다.
CBCT 시장과 관련된 몇 가지 발전 사항은 다음과 같습니다.
- 2019년 3월, Planmeca Oy는 높은 CBCT 영상 품질을 제공하는 고급 Planmeca Viso G5를 Planmeca Viso 제품군에 추가했습니다.
- 2021년 12월, RaySearch Laboratories AB는 적응형 워크플로, 근접 치료, 이온 방사선 치료를 위한 Ray Station 11B에 새로운 기능을 도입했습니다. Ray Station 11B는 광자 치료 시 매일 촬영되는 영상의 선량 계산 정확도가 향상되었습니다. 매일 촬영되는 CBCT는 기존 CT보다 치료 시점에 환자의 해부학적 구조를 더 정확하게 표현하며, 치료 초기에 촬영하여 전체 치료 계획에 활용합니다.
- 2022년 4월, Carestream Dental은 CBCT 스캐닝을 매우 직관적으로 만들어 주는 CS 8200 3D 제품군의 Neo Edition을 출시했습니다. Neo Edition은 CS 8200 3D의 진화된 버전으로, 사용 편의성을 보장하고 더 나은 임상 경험을 제공하며 더욱 성공적인 결과를 이끌어내는 Scan Ceph 모듈(옵션)이 장착되어 있습니다. 이미 CS 8200 3D를 사용 중인 의료진은 새로운 Neo Edition으로 쉽게 업그레이드할 수 있습니다.
- 2022년 6월, Xoran Technologies는 모듈식 콘 빔 컴퓨터 단층촬영 시스템 어셈블리에 대한 특허를 취득했습니다.
따라서 다양한 시장 참여자들의 이러한 기술 발전은 향후 콘 빔 컴퓨터 단층촬영 시장에 새로운 트렌드를 가져올 것으로 예상됩니다.
최종 사용자 인사이트
최종 사용자를 기준으로 콘 빔 컴퓨터 단층촬영 시장은 병원 및 진료소, 진단 센터 등으로 구분됩니다. 병원 및 진료소 부문은 2021년 시장 점유율이 가장 높았으며, 진단 센터 부문은 예측 기간 동안 가장 높은 CAGR을 기록할 것으로 예상됩니다. 진단 검사실은 환자에게 최고 품질의 종합적인 검진 및 진단 서비스를 제공하는 종합 영상 시설을 갖추고 있습니다. 진단 센터는 CT 스캔, 초음파, X선, 유방 촬영술 등 모든 최신 영상 장비를 갖추고 있습니다. 이러한 시설의 현장 영상의학과 전문의는 환자에게 전체 검사를 제공하고 몇 시간 내에 결과를 전달합니다. 영상 기술의 발전으로 짧은 처리 시간에 빠르고 정확한 결과를 얻을 수 있게 되었고, 조기 질병 진단에 대한 수요도 급증하면서 진단 검사실 부문의 콘빔 컴퓨터 단층촬영(CT) 시장 성장이 촉진되고 있습니다.
제품 출시 및 인수합병은 글로벌 콘빔 CT 시장 참여자들이 적극적으로 채택하는 전략입니다. 최근 주요 제품 개발 사례는 다음과 같습니다.
- 2021년 5월, PreXion Corporation은 최신 모델인 PreXion 3D Explorer PRO를 출시했습니다. 이 기기는 통합 두부계측 X선 암을 탑재하고 있습니다.
- 2021년 2월, Brainlab은 Loop-X 모바일 영상 로봇과 Cirq 로봇 수술 시스템에 대한 FDA 승인을 받았습니다. CE 마크 승인에 이어, Brainlab은 이 제품들을 미국 시장에 출시할 수 있는 FDA 승인도 받았습니다. Cirq는 척추 수술용 로봇 정렬 모듈이며, Loop-X는 최초의 완전 로봇 수술 중 영상 장치입니다.
- 2022년 11월, Canon Healthcare USA, INC.를 설립하여 의료 사업을 강화했습니다. Canon은 영향력이 큰 미국 의료 시장에서의 입지를 강화함으로써 의료 사업 성장을 가속화할 계획입니다.
아시아 태평양 지역에서는 COVID-19 팬데믹이 중국과 인도에 심각한 영향을 미쳤습니다. 이 두 나라에는 이미 만성 질환을 앓고 있는 환자가 많습니다. 이 국가들의 의료 전문가들은 팬데믹 상황에 대처하기 위해 선택적 시술을 취소했습니다. 더욱이 환자와 가족들은 감염 예방을 위해 병원 방문을 피하고 온라인 진료를 선택했습니다. 이로 인해 만성 질환 진단 시술이 크게 감소했습니다. 반면, COVID-19 확진자 급증으로 폐 감염 확산을 확인하는 데 사용되던 엑스레이와 콘빔 컴퓨터 단층촬영(CT) 시스템에 대한 수요가 급증했습니다. 흉부 방사선 치료에서는 CBCT 영상이 매일 사용되어 방사선사가 폐 모양을 정성적으로 평가하여 치료 전 환자의 자세와 해부학적 구조 변화를 확인합니다. 이러한 점을 고려하여 아시아 태평양 지역의 다양한 시장 참여자들은 전반적인 진단 절차를 간소화하기 위한 새롭고 혁신적인 제품을 출시했습니다. 따라서 COVID-19 팬데믹은 콘빔 컴퓨터 단층촬영 시장에 다소 긍정적인 영향을 미쳤습니다.
콘빔 컴퓨터 단층촬영 시장 지역별 통찰력
The Insight Partners의 분석가들은 예측 기간 동안 콘빔 컴퓨터 단층촬영(CT) 시장에 영향을 미치는 지역별 동향과 요인을 면밀히 분석했습니다. 이 섹션에서는 북미, 유럽, 아시아 태평양, 중동 및 아프리카, 그리고 중남미 지역의 콘빔 컴퓨터 단층촬영(CT) 시장 부문 및 지역별 현황도 다룹니다.
콘빔 컴퓨터 단층촬영 시장 보고서 범위
| 보고서 속성 | 세부 |
|---|---|
| 시장 규모 2022 | US$ 1.21 Billion |
| 시장규모별 2028 | US$ 2.28 Billion |
| 글로벌 CAGR (2022 - 2028) | 11.1% |
| 이전 데이터 | 2020-2021 |
| 예측 기간 | 2023-2028 |
| 다루는 세그먼트 |
By 유형
|
| 포함된 지역 및 국가 |
북미
|
| 시장 선도 기업 및 주요 회사 프로필 |
|
콘빔 컴퓨터 단층촬영(CT) 시장 참여자 밀도: 비즈니스 역학에 미치는 영향 이해
콘 빔 컴퓨터 단층촬영(CT) 시장은 소비자 선호도 변화, 기술 발전, 그리고 제품 이점에 대한 인식 제고 등의 요인으로 인한 최종 사용자 수요 증가에 힘입어 빠르게 성장하고 있습니다. 수요가 증가함에 따라 기업들은 제품 라인업을 확장하고, 소비자 니즈를 충족하기 위한 혁신을 추진하며, 새로운 트렌드를 적극 활용하고 있으며, 이는 시장 성장을 더욱 가속화하고 있습니다.
- 을 얻으세요 콘빔 컴퓨터 단층촬영 시장 주요 주요 플레이어 개요
콘 빔 컴퓨터 단층촬영 - 시장 세분화
콘 빔 컴퓨터 단층촬영 시장은 환자 자세를 기준으로 기립, 착석, 앙와위로 구분됩니다. 적용 분야별로는 치과, 이비인후과, 유방암, 두정골, 정형외과 등으로 구분됩니다. 최종 사용자 기준으로는 병원 및 진료소, 진단 센터 등으로 구분됩니다. 지역별로는 북미(미국, 캐나다, 멕시코), 유럽(프랑스, 독일, 영국, 스페인, 이탈리아, 기타 유럽), 아시아 태평양(중국, 인도, 일본, 호주, 한국, 기타 아시아 태평양), 중동 및 아프리카(사우디 아라비아, UAE, 남아프리카, 기타 중동 및 아프리카), 남아프리카 공화국 등으로 구분됩니다. 중앙 아메리카(브라질, 아르헨티나 및 기타 남미 및 중앙 아메리카)
회사 프로필
- Dentsply Sirona Inc
- Newtom
- Carestream Dental LLC
- Fussen Group
- PreXion
- Brainlab AG
- IDETEC MEDICAL IMAGING
- Vatech Co., Ltd
- Planmeca Oy
- Canon Medical Systems

Mrinal은 생명 과학 시장 정보 분석 및 컨설팅 분야에서 8년 이상의 경력을 보유한 노련한 리서치 분석가입니다. 전략적 사고방식과 탁월함을 향한 확고한 의지를 바탕으로 제약 예측, 시장 기회 평가, 업계 벤치마크 개발 분야에서 심도 있는 전문 지식을 쌓아 왔습니다. 그녀의 업무는 고객이 정보에 기반한 전략적 의사 결정을 내릴 수 있도록 실질적인 통찰력을 제공하는 데 중점을 두고 있습니다.
Mrinal의 핵심 강점은 복잡한 정량적 데이터 세트를 의미 있는 비즈니스 인텔리전스로 변환하는 것입니다. 그녀의 분석적 통찰력은 제약 및 의료기기 분야의 시장 진출(GTM) 전략을 수립하고 성장 기회를 발굴하는 데 중요한 역할을 합니다. 신뢰할 수 있는 컨설턴트로서, 그녀는 고객의 워크플로 프로세스를 간소화하고 모범 사례를 구축하는 데 지속적으로 집중하여 혁신과 운영 효율성을 향상시킵니다.
- 포괄적인 시장 규모 산정 및 전망 분석
- 상세 시장 세분화 분석
- 심층적인 시장 동향 및 요인 분석
- 지역 및 국가별 인사이트
- 경쟁 구도 및 기업 벤치마킹
- 전략적 비즈니스 인텔리전스
사용 후기
Insight Partners의 SCADA 시스템 시장 보고서는 포괄적이며, 현재 동향과 미래 전망에 대한 귀중한 통찰력을 제공합니다. 팀은 매우 전문적이고, 신속하게 대응하며, 처음부터 끝까지 지원해 주었습니다. 저희는 매우 만족하며 Insight Partners의 서비스를 적극 추천합니다.
란 케뎀 파트너, Reali Technologies LTDs아주 구체적인 소프트웨어 시장에 대한 보고서를 요청했는데, 팀에서 며칠 만에 보고서를 작성해 주셨습니다. 정보는 매우 관련성이 높고 잘 정리되어 있었습니다. 그 후 보고서에 몇 가지 수정과 추가 사항을 요청했습니다. 팀원들의 응답도 매우 빨랐고, 일주일도 채 되지 않아 최종 보고서를 받았습니다.
장-에르브 젠 의장, 퓨처 애널리티카The Insight Partners와 함께 중요한 시장 조사 및 예측 작업을 진행했습니다. Insight Partners는 기회와 위험에 대한 명확한 통찰력을 제공하여 계획을 세우는 데 큰 도움이 되었습니다. The Insight Partners의 조사는 사용하기 쉬웠고, 탄탄한 데이터를 기반으로 했습니다. 덕분에 현명하고 자신 있는 결정을 내릴 수 있었습니다. The Insight Partners를 강력 추천합니다.
피유시 나그팔 수석 부사장, 하이빔 글로벌Insight Partners는 탄탄한 분야 전문성을 바탕으로 통찰력 있고 체계적인 시장 조사를 제공했습니다. Insight Partners 팀은 처음부터 끝까지 전문적이고 신속하게 대응했습니다. 사용자 친화적인 웹사이트 덕분에 업계 보고서에 쉽게 접근할 수 있었습니다. 신뢰할 수 있고 고품질의 조사 서비스를 원하신다면 Insight Partners를 강력 추천합니다.
아다치 유키히코 대표이사, 딥블루 주식회사The Insight Partners에서 시장 보고서를 구매한 것은 이번이 처음입니다. 처음에는 확신이 없었지만, 웹사이트를 방문하고 나서 위험을 감수하고 시장 보고서를 구매하는 것이 더 편하다는 것을 알게 되었습니다. 보고서의 품질과 고객 서비스에 매우 만족합니다. 처음 보고서를 보고 몇 가지 질문과 의견이 있었지만, 분석가와 이메일로 몇 차례 대화를 나눈 후, 전략 기획 과정에 참고할 수 있는 보고서를 확보했다고 생각합니다. 시간을 내어 긍정적인 경험을 선사해 주셔서 정말 감사합니다. 다른 사람들에게도 귀사의 서비스를 적극 추천할 것이며, 추가적인 시장 데이터가 필요할 때면 가장 먼저 귀사에 연락하겠습니다.
존 스즈키 사장 겸 최고 경영자, 이사회 이사, BK 테크놀로지스나이지리아 감염성 질환 IVD 시장 관련 정보 요청에 응해 주신 귀사의 지원과 전문성에 감사드립니다. 귀사의 인내심과 지도, 그리고 할인 혜택을 기꺼이 제공해 주셔서 결국 계약을 성사시킬 수 있었습니다. 첫 만남을 통해 귀사가 저에게 심어주신 좋은 인상을 바탕으로 앞으로도 The Insight Partners와 함께할 수 있기를 기대합니다.
치지오케 박사 오니아 전무이사, 파인크레스트 헬스케어 유한회사구매 이유
- 정보에 기반한 의사 결정
- 시장 역학 이해
- 경쟁 분석
- 고객 인사이트
- 시장 예측
- 위험 완화
- 전략 기획
- 투자 타당성 분석
- 신흥 시장 파악
- 마케팅 전략 강화
- 운영 효율성 향상
- 규제 동향에 발맞춰 대응


