
2031년 규모, 점유율, 성장, 추세별 데이터 버스 시장 분석 및 예측
데이터 버스 시장 규모 및 예측(2021-2031), 글로벌 및 지역별 점유율, 추세 및 성장 기회 분석 보고서 범위: 구성 요소별[하드웨어(케이블 및 커넥터, 어셈블리 또는 종단기, 데이터 버스 커플러, 인터페이스 카드 또는 보드 및 기타) 및 소프트웨어], 유형(ARINC 429 또는 629, MIL-STD 1533 및 기타), 응용 프로그램(해양, 자동차, 상업 항공 및 군용 항공) 및 지역(북미, 유럽, 아시아 태평양, 중동 및 아프리카, 남미 및 중미)
- 상태 : 게시됨
- 보고서 코드 : TIPTE100000505
- 범주 : 전자 및 반도체
- 페이지 수 : 250
- 사용 가능한 보고서 형식 :


- 최종 업데이트 일자 : July 03, 2025

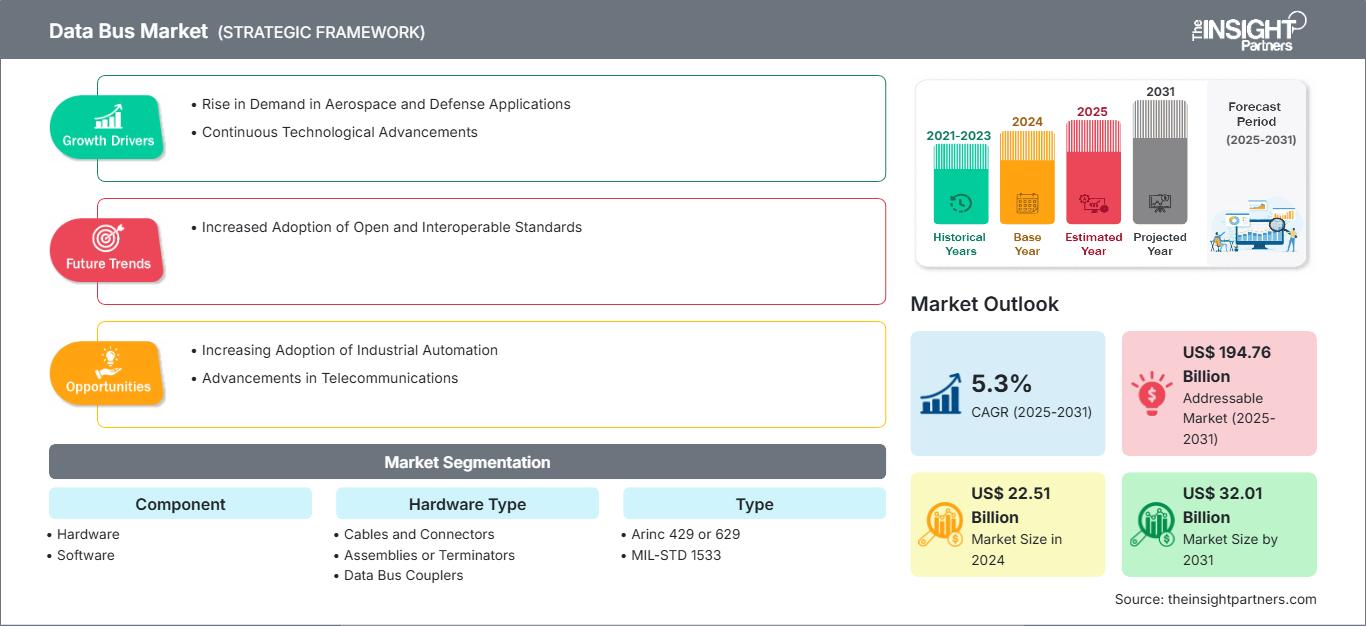
데이터 버스 시장 규모는 2024년 225억 1천만 달러로 평가되었으며, 2031년에는 320억 1천만 달러에 이를 것으로 예상됩니다. 2025년부터 2031년까지 연평균 성장률(CAGR) 5.3%를 기록할 것으로 예상됩니다. 개방적이고 상호 운용 가능한 표준 채택 증가는 새로운 시장 트렌드를 가져올 것으로 예상됩니다.
데이터 버스 시장 분석
항공우주 및 방위 애플리케이션 수요 증가와 지속적인 기술 발전과 같은 요인들이 데이터 버스 시장을 주도하고 있습니다. 산업 자동화 도입 증가와 통신 기술의 발전으로 인해 예측 기간 동안 시장이 성장할 것으로 예상됩니다. 개방적이고 상호 운용 가능한 표준 채택 증가는 시장의 주요 트렌드 중 하나가 될 것으로 예상됩니다. 그러나 높은 구현 비용이 데이터 버스 시장 성장을 저해할 수 있습니다.
데이터 버스 시장 개요
데이터 버스는 컴퓨터 또는 디지털 시스템 내에서 중앙 처리 장치(CPU), 메모리, 주변 장치 등 다양한 구성 요소 간의 데이터 전송을 원활하게 하는 중요한 하위 시스템입니다. 데이터 버스는 이진 정보(비트)를 전달하는 일련의 병렬 와이어 또는 전기 경로로 구성되며, 시스템 아키텍처 및 요구 사항에 따라 양방향으로 데이터를 전송할 수 있습니다. 데이터 버스의 폭(비트 단위, 예: 8비트, 16비트, 32비트, 64비트)은 동시에 전송할 수 있는 데이터의 양을 결정하며, 시스템의 전반적인 성능과 데이터 처리량에 직접적인 영향을 미칩니다. 버스 폭이 넓을수록 더 많은 데이터를 한 번에 전송할 수 있으므로 하드웨어 요소 간의 처리 및 통신 속도가 향상됩니다. 데이터가 어디로 가야 하는지에 대한 정보를 전달하는 주소 버스나 연산을 관리하는 신호를 전달하는 제어 버스와 달리, 데이터 버스는 데이터의 실제 이동을 담당합니다. 최신 컴퓨팅 시스템에서 데이터 버스는 시스템 클록과 명령어 집합의 지시에 따라 주소 버스 및 제어 버스와 협력하여 컴퓨터 아키텍처 전반에 걸쳐 동기화되고 정확하며 효율적인 데이터 통신을 보장합니다.
요구 사항에 맞게 이 보고서를 사용자 정의하십시오.
이 보고서의 일부, 국가 수준 분석, Excel 데이터 팩을 포함하여 모든 보고서에 대한 사용자 정의를 무료로 받을 수 있을 뿐만 아니라 스타트업 및 대학을 위한 훌륭한 제안 및 할인을 이용할 수 있습니다
데이터 버스 마켓: 전략적 통찰력
-
이 보고서의 주요 주요 시장 동향을 확인하세요.이 무료 샘플에는 시장 동향부터 추정 및 예측에 이르기까지 데이터 분석이 포함됩니다.
데이터 버스 시장 성장 동력 및 기회
항공우주 및 방위 애플리케이션 수요 증가
데이터 버스 시장은 미션 크리티컬 환경에서 안전하고 고속 통신에 대한 수요가 증가함에 따라 급속도로 성장하고 있습니다. MIL-STD-1553B 프로토콜은 수십 년의 역사를 자랑하지만, 특히 장애 발생이 불가피한 애플리케이션에서 결정론적 성능과 검증된 견고성 덕분에 새로운 중요성을 얻고 있습니다. 1553B 데이터 버스 트랜스포머는 단순한 레거시 구성 요소가 아니라, 중복성, EMI 복원력, 그리고 오류 격리가 매우 중요한 환경에서 최신 디지털 통신을 가능하게 하는 핵심 요소입니다. 지속적인 채택은 개방형 아키텍처와 소프트웨어 정의 기능이 표준으로 자리 잡고 있는 항공우주 및 방위 시스템의 확장성 및 모듈화 추세를 뒷받침합니다. 따라서 항공우주 및 방위 산업 분야에서 데이터 버스에 대한 수요 증가는 데이터 버스 시장 성장을 촉진합니다.
지속적인 기술 발전
글로벌 데이터 버스 시장의 핵심 동력은 고성능 컴퓨팅 및 AI 기반 데이터 전송 시스템의 병목 현상 해결에 중점을 둔 지속적인 기술 발전입니다. 최근 주목할 만한 사례로 NEO Semiconductor가 2024년 8월 5일, AI 처리를 3D DRAM에 직접 통합하여 AI 워크로드의 데이터 버스 혼잡을 완화하도록 설계된 획기적인 혁신 기술인 3D X-AI 칩 기술을 공개했습니다. 이 혁신은 단순한 하드웨어 업그레이드가 아닙니다. 이는 생성형 AI 및 머신 러닝 환경에서 수행되는 것과 같은 연산 집약적인 작업에서 고대역폭 메모리(HBM)와 GPU 간의 데이터 관리에 있어 패러다임의 전환을 의미합니다.
AI, 자율 시스템, 데이터 센터, 첨단 컴퓨팅 등 다양한 분야에서 처리 속도와 데이터량이 증가함에 따라 더욱 효율적인 데이터 버스 시스템의 필요성이 그 어느 때보다 중요해졌습니다. NEO의 솔루션은 기존 데이터 버스의 부담을 어느 정도 완화하는 동시에, 하이브리드 버스 아키텍처, 지능형 메모리 시스템, 임베디드 프로세싱으로의 시장 전환을 가속화하여 전반적인 혁신을 촉진하고 있습니다. 또한 이러한 임베디드 AI 메모리 아키텍처를 보완하거나 통합할 수 있는 적응형 데이터 버스 기술에 대한 추가 연구 개발을 촉진합니다.
데이터 버스 시장 보고서 세분화 분석
데이터 버스 시장 분석 도출에 기여한 주요 부문은 구성 요소, 유형 및 애플리케이션입니다.
- 구성 요소를 기준으로 시장은 하드웨어와 소프트웨어로 구분됩니다. 하드웨어 부문은 2024년에 더 큰 데이터 버스 시장 점유율을 차지했습니다.
- 유형 측면에서 시장은 ARINC 429/629, MIL-STD-1553 등으로 세분화됩니다. MIL-STD-1553 부문은 2024년에 가장 큰 데이터 버스 시장 점유율을 기록했습니다.
- 애플리케이션을 기준으로 시장은 해양, 자동차, 상업 항공 및 군용 항공으로 세분화됩니다. 군용 항공 부문은 2024년 데이터 버스 시장에서 가장 큰 점유율을 차지했습니다.
지역별 데이터 버스 시장 점유율 분석
- 데이터 버스 시장은 북미, 유럽, 아시아 태평양(APAC), 중동 및 아프리카(MEA), 중남미의 5개 주요 지역으로 구분됩니다. 북미는 2024년 시장을 장악했습니다. 유럽은 글로벌 데이터 버스 시장에서 두 번째로 큰 비중을 차지하며, 아시아 태평양 지역이 그 뒤를 따릅니다.
- 북미는 세계 최대 방위 및 항공우주 산업의 본거지인 미국을 필두로 글로벌 데이터 버스 시장에서 지배적인 위치를 차지하고 있습니다. 록히드 마틴, 레이시온 테크놀로지스, 노스럽 그루먼, 보잉과 같은 주요 기업들의 존재는 특히 군용 항공, 무인 항공기(UAV), 우주 탐사 분야에서 최첨단 데이터 버스 시스템에 대한 지속적인 투자를 촉진합니다. 미국 국방부는 임무 수행에 필수적인 애플리케이션에서 안전하고 내결함성이 뛰어난 데이터 통신을 위해 MIL-STD-1553과 같은 엄격한 표준을 요구합니다. 북미는 또한 NASA, DARPA, FAA와 같은 기관의 지원을 받는 이더넷 기반 및 하이브리드 버스 아키텍처 혁신의 중심지입니다. 또한, 미국과 캐나다에서 커넥티드카 시장이 성장하고 첨단 운전자 지원 시스템(ADAS)이 통합됨에 따라 CAN, FlexRay, 자동차 이더넷과 같은 데이터 버스의 도입이 증가하고 있습니다. 활발한 연구 개발 활동, 성숙한 방산업체 생태계, 그리고 강력한 규제 프레임워크는 북미를 첨단 데이터 버스 시스템의 기술 개발 및 상업적 도입 모두에서 세계적인 선두주자로 자리매김하게 했습니다.
- 아시아 태평양 지역은 급속한 산업화, 국방 예산 증가, 그리고 항공우주 및 자동차 산업의 성장에 힘입어 빠르게 성장하고 전략적으로 중요한 데이터 버스 기술 시장으로 부상하고 있습니다. 중국, 인도, 일본, 한국은 국내 제조 역량 강화와 국방 현대화에 대한 집중적인 관심으로 선두를 달리고 있습니다. 예를 들어, 인도의 '메이크 인 인디아(Make in India)' 및 '아트마니르바르 바라트(Atmanirbhar Bharat)' 정책은 군용 항공기, 해군 플랫폼, 위성 개발과 관련된 자체 프로그램으로 이어졌고, MIL-STD-1553 및 ARINC 호환 데이터 버스 시스템에 대한 높은 수요를 창출했습니다. DRDO, ISRO, HAL과 같은 기관들은 국내외 기술 파트너들과 긴밀히 협력하여 데이터 통신 인프라를 강화하고 있습니다. 중국에서는 상업용 항공우주 및 첨단 군사 플랫폼의 급속한 성장으로 고급 데이터 버스 아키텍처의 국내 생산 및 통합이 증가하고 있습니다.
데이터 버스 시장 보고서 범위
데이터 버스 시장 뉴스 및 최근 동향
데이터 버스 시장은 1차 및 2차 조사 이후 주요 기업 간행물, 협회 데이터, 데이터베이스 등 정성적 및 정량적 데이터를 수집하여 평가합니다. 데이터 버스 시장의 주요 동향은 다음과 같습니다.
- 키사이트와 SPHEREA는 항공우주 및 방위 산업 분야에서 고객에게 향상된 테스트 역량을 제공하기 위해 협력했습니다. 이번 협력을 통해 키사이트의 고성능 전자 테스트 및 측정 시스템 전문성과 SPHEREA의 설계 및 통합 역량을 활용하여 고객에게 신뢰할 수 있는 기술을 기반으로 한 현지 솔루션을 제공할 수 있게 되었습니다. (출처: 키사이트, 보도자료, 2025년 5월)
- 에머슨은 데이터 수집(DAQ) 제품군의 최신 제품인 NI cDAQ-9187 및 cDAQ-9183 이더넷 섀시와 NI 9204 입력 모듈을 발표했습니다. NI FlexLogger DAQ 소프트웨어 플러그인을 위한 GitHub 저장소와 함께, 이 새로운 솔루션은 이더넷을 통해 고성능 테스트 및 측정 시스템을 배포하기 위한 비용 효율적인 옵션을 제공합니다.
(출처: Emerson, 보도자료, 2025년 2월)
데이터 버스 시장 보고서 범위 및 제공 내용
"데이터 버스 시장 규모 및 예측(2021~2031)"은 아래 언급된 영역을 포괄하는 시장에 대한 자세한 분석을 제공합니다.
- 범위에 포함된 모든 주요 시장 세그먼트에 대한 글로벌, 지역 및 국가 수준의 데이터 버스 시장 규모 및 예측
- 데이터 버스 시장 동향 및 성장 요인, 제약 및 주요 기회와 같은 시장 역학
- 상세한 PEST 및 SWOT 분석
- 주요 시장 동향, 글로벌 및 지역 프레임워크, 주요 업체, 규정 및 최근 시장 개발 사항을 포괄하는 데이터 버스 시장 분석
- 시장 집중도, 히트맵 분석을 포괄하는 산업 환경 및 경쟁 분석 주요 업체 및 데이터 버스 시장의 최근 동향
- 자세한 회사 프로필
데이터 버스 시장 지역별 통찰력
The Insight Partners의 분석가들은 예측 기간 동안 데이터 버스 시장에 영향을 미치는 지역별 동향과 요인들을 면밀히 분석했습니다. 이 섹션에서는 북미, 유럽, 아시아 태평양, 중동 및 아프리카, 그리고 중남미 지역의 데이터 버스 시장 부문 및 지역별 현황도 다룹니다.
데이터 버스 시장 보고서 범위
| 보고서 속성 | 세부 |
|---|---|
| 시장 규모 2024 | US$ 22.51 Billion |
| 시장규모별 2031 | US$ 32.01 Billion |
| 글로벌 CAGR (2025 - 2031) | 5.3% |
| 이전 데이터 | 2021-2023 |
| 예측 기간 | 2025-2031 |
| 다루는 세그먼트 |
By 구성 요소
|
| 포함된 지역 및 국가 |
북미
|
| 시장 선도 기업 및 주요 회사 프로필 |
|
데이터 버스 시장 참여자 밀도: 비즈니스 역학에 미치는 영향 이해
데이터 버스 시장은 소비자 선호도 변화, 기술 발전, 그리고 제품 이점에 대한 인식 제고 등의 요인으로 인한 최종 사용자 수요 증가에 힘입어 빠르게 성장하고 있습니다. 수요 증가에 따라 기업들은 제품 및 서비스 확장, 소비자 니즈 충족을 위한 혁신, 그리고 새로운 트렌드를 적극 활용하며 시장 성장을 더욱 가속화하고 있습니다.
- 을 얻으세요 데이터 버스 마켓 주요 주요 플레이어 개요

나빈은 맞춤형, 신디케이트 및 컨설팅 프로젝트 전반에 걸쳐 9년 이상의 전문 지식을 보유한 시장 조사 및 컨설팅 전문가입니다. 현재 부사장으로 재직 중이며, 프로젝트 가치 사슬 전반의 이해관계자들을 성공적으로 관리해 왔으며, 100편 이상의 연구 보고서와 30건 이상의 컨설팅 업무를 수행했습니다. 그는 산업 및 정부 프로젝트 전반에 걸쳐 다양한 업무를 수행하며 고객 성공과 데이터 기반 의사 결정에 크게 기여하고 있습니다.
나빈은 카르나타카주 VTU에서 전자통신 공학 학위를, 마니팔 대학교에서 마케팅 및 운영 MBA를 취득했습니다. 그는 9년 동안 IEEE 회원으로 활발하게 활동하며 컨퍼런스, 기술 심포지엄에 참여하고 지역 및 지역 차원에서 자원봉사 활동을 해왔습니다. 현재 직책을 맡기 전에는 IndustryARC에서 준전략 컨설턴트로, 휴렛팩커드(HP Global)에서 산업용 서버 컨설턴트로 근무했습니다.
- 포괄적인 시장 규모 산정 및 전망 분석
- 상세 시장 세분화 분석
- 심층적인 시장 동향 및 요인 분석
- 지역 및 국가별 인사이트
- 경쟁 구도 및 기업 벤치마킹
- 전략적 비즈니스 인텔리전스
사용 후기
Insight Partners의 SCADA 시스템 시장 보고서는 포괄적이며, 현재 동향과 미래 전망에 대한 귀중한 통찰력을 제공합니다. 팀은 매우 전문적이고, 신속하게 대응하며, 처음부터 끝까지 지원해 주었습니다. 저희는 매우 만족하며 Insight Partners의 서비스를 적극 추천합니다.
란 케뎀 파트너, Reali Technologies LTDs아주 구체적인 소프트웨어 시장에 대한 보고서를 요청했는데, 팀에서 며칠 만에 보고서를 작성해 주셨습니다. 정보는 매우 관련성이 높고 잘 정리되어 있었습니다. 그 후 보고서에 몇 가지 수정과 추가 사항을 요청했습니다. 팀원들의 응답도 매우 빨랐고, 일주일도 채 되지 않아 최종 보고서를 받았습니다.
장-에르브 젠 의장, 퓨처 애널리티카The Insight Partners와 함께 중요한 시장 조사 및 예측 작업을 진행했습니다. Insight Partners는 기회와 위험에 대한 명확한 통찰력을 제공하여 계획을 세우는 데 큰 도움이 되었습니다. The Insight Partners의 조사는 사용하기 쉬웠고, 탄탄한 데이터를 기반으로 했습니다. 덕분에 현명하고 자신 있는 결정을 내릴 수 있었습니다. The Insight Partners를 강력 추천합니다.
피유시 나그팔 수석 부사장, 하이빔 글로벌Insight Partners는 탄탄한 분야 전문성을 바탕으로 통찰력 있고 체계적인 시장 조사를 제공했습니다. Insight Partners 팀은 처음부터 끝까지 전문적이고 신속하게 대응했습니다. 사용자 친화적인 웹사이트 덕분에 업계 보고서에 쉽게 접근할 수 있었습니다. 신뢰할 수 있고 고품질의 조사 서비스를 원하신다면 Insight Partners를 강력 추천합니다.
아다치 유키히코 대표이사, 딥블루 주식회사The Insight Partners에서 시장 보고서를 구매한 것은 이번이 처음입니다. 처음에는 확신이 없었지만, 웹사이트를 방문하고 나서 위험을 감수하고 시장 보고서를 구매하는 것이 더 편하다는 것을 알게 되었습니다. 보고서의 품질과 고객 서비스에 매우 만족합니다. 처음 보고서를 보고 몇 가지 질문과 의견이 있었지만, 분석가와 이메일로 몇 차례 대화를 나눈 후, 전략 기획 과정에 참고할 수 있는 보고서를 확보했다고 생각합니다. 시간을 내어 긍정적인 경험을 선사해 주셔서 정말 감사합니다. 다른 사람들에게도 귀사의 서비스를 적극 추천할 것이며, 추가적인 시장 데이터가 필요할 때면 가장 먼저 귀사에 연락하겠습니다.
존 스즈키 사장 겸 최고 경영자, 이사회 이사, BK 테크놀로지스나이지리아 감염성 질환 IVD 시장 관련 정보 요청에 응해 주신 귀사의 지원과 전문성에 감사드립니다. 귀사의 인내심과 지도, 그리고 할인 혜택을 기꺼이 제공해 주셔서 결국 계약을 성사시킬 수 있었습니다. 첫 만남을 통해 귀사가 저에게 심어주신 좋은 인상을 바탕으로 앞으로도 The Insight Partners와 함께할 수 있기를 기대합니다.
치지오케 박사 오니아 전무이사, 파인크레스트 헬스케어 유한회사구매 이유
- 정보에 기반한 의사 결정
- 시장 역학 이해
- 경쟁 분석
- 고객 인사이트
- 시장 예측
- 위험 완화
- 전략 기획
- 투자 타당성 분석
- 신흥 시장 파악
- 마케팅 전략 강화
- 운영 효율성 향상
- 규제 동향에 발맞춰 대응


