
Bus de datos Crecimiento del mercado, tamaño, participación, tendencias, análisis de actores clave y pronóstico hasta 2028
Bus de datos Crecimiento del mercado, tamaño, participación, tendencias, análisis de actores clave y pronósticos hasta 2028
- Estado : Publicada
- Código de informe : TIPTE100000505
- Categoría : Electrónica y semiconductores
- Número de páginas : 250
- Formatos de informe disponibles :


- Fecha de última actualización : July 03, 2025

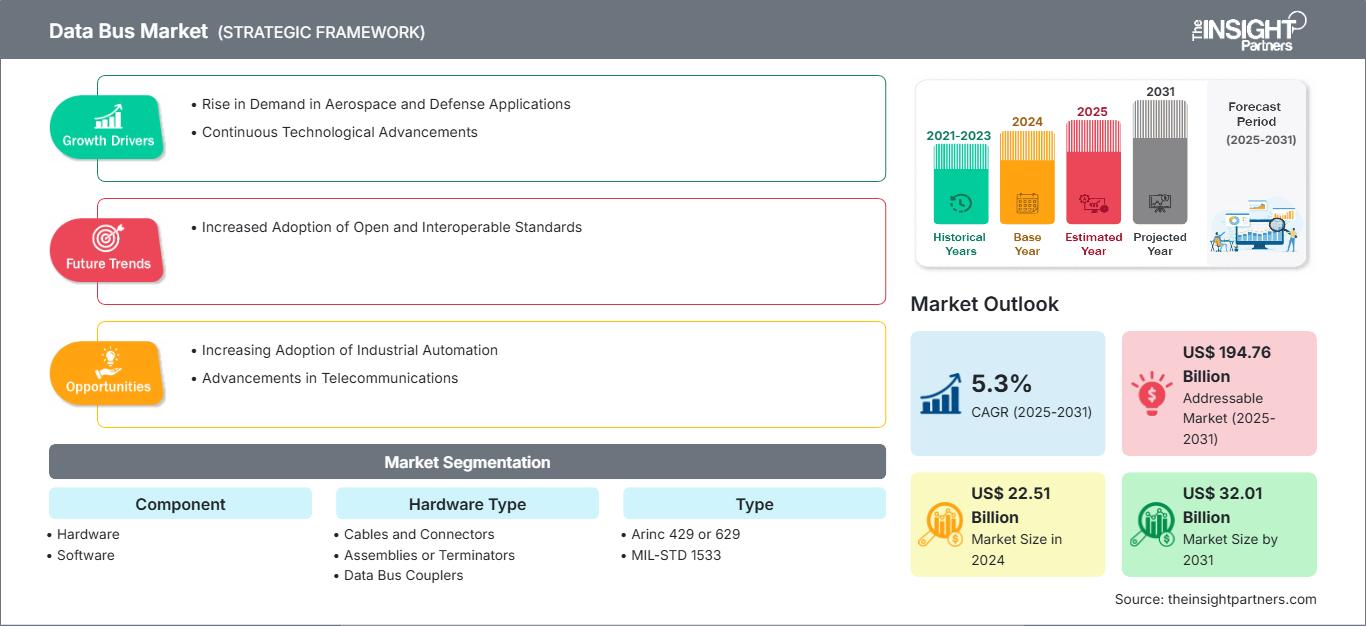
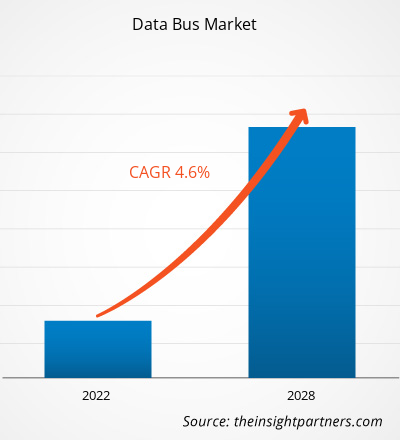
El tamaño del mercado de buses de datos se valoró en 22 510 millones de dólares estadounidenses en 2024 y se espera que alcance los 32 010 millones de dólares estadounidenses para 2031; se estima que registrará una tasa de crecimiento anual compuesta (TCAC) del 5,3 % entre 2025 y 2031. Es probable que la creciente adopción de estándares abiertos e interoperables genere una nueva tendencia en el mercado.
Análisis del mercado de buses de datos
Factores como el aumento de la demanda en aplicaciones aeroespaciales y de defensa y los continuos avances tecnológicos impulsan el mercado de buses de datos. Se espera que el mercado crezca durante el período de pronóstico debido a la creciente adopción de la automatización industrial y los avances en telecomunicaciones. Se prevé que la creciente adopción de estándares abiertos e interoperables sea una de las tendencias clave del mercado. Sin embargo, los altos costos de implementación podrían frenar el crecimiento del mercado de buses de datos.
Descripción general del mercado de buses de datos
Un bus de datos es un subsistema crucial dentro de una computadora o sistema digital que facilita la transferencia de datos entre diversos componentes, como la unidad central de procesamiento (CPU), la memoria y los dispositivos periféricos. Consiste en un conjunto de cables paralelos o rutas eléctricas que transportan información binaria (bits) y pueden transferir datos en cualquier dirección, dependiendo de la arquitectura y los requisitos del sistema. El ancho de un bus de datos, medido en bits (p. ej., 8 bits, 16 bits, 32 bits, 64 bits), determina la cantidad de datos que se pueden transmitir simultáneamente, lo que afecta directamente al rendimiento general del sistema y a la capacidad de procesamiento de datos. Un bus más ancho permite transferir más datos a la vez, lo que agiliza el procesamiento y la comunicación entre los elementos de hardware. A diferencia de los buses de direcciones, que transportan información sobre la ubicación de los datos, y de los buses de control, que transportan señales para gestionar las operaciones, el bus de datos es específicamente responsable del movimiento real de los datos. En los sistemas informáticos modernos, el bus de datos trabaja en coordinación con los buses de direcciones y control, guiado por el reloj del sistema y el conjunto de instrucciones, para garantizar una comunicación de datos sincronizada, precisa y eficiente en toda la arquitectura del sistema.
Obtendrá personalización en cualquier informe, sin cargo, incluidas partes de este informe o análisis a nivel de país, paquete de datos de Excel, así como también grandes ofertas y descuentos para empresas emergentes y universidades.
Mercado de buses de datos: Perspectivas estratégicas
-
Obtenga las principales tendencias clave del mercado de este informe.Esta muestra GRATUITA incluirá análisis de datos, desde tendencias del mercado hasta estimaciones y pronósticos.
Impulsores y oportunidades del mercado del bus de datos
Aumento de la demanda en aplicaciones aeroespaciales y de defensa
El mercado de buses de datos está experimentando una expansión acelerada, debido principalmente a la creciente necesidad de comunicaciones seguras y de alta velocidad en entornos de misión crítica. El protocolo MIL-STD-1553B, a pesar de su origen con décadas de antigüedad, continúa cobrando relevancia gracias a su rendimiento determinista y robustez demostrada, especialmente en aplicaciones donde los fallos son inevitables. Los transformadores de bus de datos 1553B no son solo componentes heredados, sino que facilitan la comunicación digital moderna en entornos donde la redundancia, la resiliencia a las interferencias electromagnéticas (EMI) y el aislamiento de fallos son fundamentales. Su adopción continua respalda las tendencias de escalabilidad y modularización en los sistemas aeroespaciales y de defensa, donde las arquitecturas abiertas y las capacidades definidas por software se están convirtiendo en la norma. Por lo tanto, la creciente demanda de buses de datos en aplicaciones aeroespaciales y de defensa impulsa el crecimiento del mercado.
Avances tecnológicos continuos
Un factor clave del mercado global de buses de datos es el continuo avance tecnológico, enfocado en resolver los cuellos de botella en la computación de alto rendimiento y los sistemas de transferencia de datos basados en IA. Un ejemplo reciente y convincente proviene de NEO Semiconductor, que el 5 de agosto de 2024 presentó su tecnología de chip 3D X-AI, una innovación revolucionaria diseñada para aliviar la congestión del bus de datos en las cargas de trabajo de IA mediante la integración del procesamiento de IA directamente en la DRAM 3D. Esta innovación no es una simple actualización de hardware; representa un cambio de paradigma en la gestión de datos entre la memoria de alto ancho de banda (HBM) y las GPU durante tareas de computación intensiva, como las realizadas en entornos de IA generativa y aprendizaje automático.
A medida que la velocidad de procesamiento y el volumen de datos aumentan en sectores como la IA, los sistemas autónomos, los centros de datos y la informática avanzada, la necesidad de sistemas de bus de datos más eficientes nunca ha sido tan crucial. La solución de NEO, si bien alivia la presión sobre los buses de datos tradicionales, también refuerza la transición del mercado hacia arquitecturas de bus híbridas, sistemas de memoria inteligente y procesamiento embebido, tendencias que impulsan la innovación en todos los ámbitos. Además, impulsa la investigación y el desarrollo de tecnologías de bus de datos adaptativos que pueden complementar o integrarse con dichas arquitecturas de memoria embebidas para IA.
Análisis de segmentación del informe de mercado de bus de datos
Los segmentos clave que contribuyeron a la derivación del análisis del mercado de bus de datos son el componente, el tipo y la aplicación.
- Según los componentes, el mercado se divide en hardware y software. El segmento de hardware tuvo la mayor cuota de mercado en buses de datos en 2024.
- En cuanto al tipo, el mercado se segmenta en ARINC 429/629, MIL-STD-1553 y otros. El segmento MIL-STD-1553 tuvo la mayor cuota de mercado de buses de datos en 2024.
- Según la aplicación, el mercado se segmenta en los sectores marítimo, automotriz, de aviación comercial y militar. El segmento de aviación militar tuvo la mayor participación en el mercado de buses de datos en 2024.
Análisis de la cuota de mercado del bus de datos por geografía
- El mercado de buses de datos se segmenta en cinco regiones principales: Norteamérica, Europa, Asia Pacífico (APAC), Oriente Medio y África (MEA), y Sudamérica y Centroamérica. Norteamérica dominó el mercado en 2024. Europa es el segundo mayor contribuyente al mercado global de buses de datos, seguida de Asia Pacífico.
- Norteamérica ocupa una posición dominante en el mercado global de buses de datos, impulsada principalmente por Estados Unidos, sede de la industria aeroespacial y de defensa más grande del mundo. La presencia de importantes empresas como Lockheed Martin, Raytheon Technologies, Northrop Grumman y Boeing impulsa la inversión sostenida en sistemas de buses de datos de vanguardia, especialmente en la aviación militar, los vehículos aéreos no tripulados (UAV) y la exploración espacial. El Departamento de Defensa de Estados Unidos exige estándares estrictos como el MIL-STD-1553 para la comunicación de datos segura y con tolerancia a fallos en aplicaciones de misión crítica. Norteamérica también es un centro de innovación en arquitecturas de buses basadas en Ethernet e híbridas, con el apoyo de instituciones como la NASA, la DARPA y la Administración Federal de Aviación (FAA). Además, el creciente mercado de vehículos conectados y la integración de sistemas avanzados de asistencia al conductor (ADAS) en Estados Unidos y Canadá han impulsado la creciente adopción de buses de datos como CAN, FlexRay y Ethernet automotriz. Una sólida actividad de investigación y desarrollo, un ecosistema maduro de contratistas de defensa y fuertes marcos regulatorios posicionan colectivamente a América del Norte como líder mundial tanto en el desarrollo tecnológico como en la adopción comercial de sistemas avanzados de bus de datos.
- La región Asia-Pacífico se perfila como un mercado de rápido crecimiento y estratégicamente importante para las tecnologías de bus de datos, impulsado por la rápida industrialización, el aumento de los presupuestos de defensa y la expansión de las industrias aeroespacial y automotriz. China, India, Japón y Corea del Sur están a la vanguardia, con una creciente capacidad de fabricación nacional y un enfoque cada vez mayor en la modernización de la defensa. Por ejemplo, las iniciativas de la India en el marco de Make in India y Atmanirbhar Bharat han dado lugar a programas autóctonos que involucran aeronaves de defensa, plataformas navales y desarrollo de satélites, lo que ha generado una alta demanda de sistemas de bus de datos compatibles con MIL-STD-1553 y ARINC. Organizaciones como DRDO, ISRO y HAL colaboran estrechamente con socios tecnológicos nacionales e internacionales para fortalecer sus infraestructuras de comunicación de datos. En China, el rápido crecimiento de la industria aeroespacial comercial y las plataformas militares de alta tecnología ha impulsado el aumento de la producción local y la integración de arquitecturas avanzadas de bus de datos.
Perspectivas regionales del mercado de buses de datos
Los analistas de The Insight Partners han explicado detalladamente las tendencias regionales y los factores que influyen en el mercado de buses de datos durante el período de pronóstico. Esta sección también analiza los segmentos y la geografía del mercado de buses de datos en Norteamérica, Europa, Asia Pacífico, Oriente Medio y África, y Sudamérica y Centroamérica.
Alcance del informe de mercado de bus de datos
| Atributo del informe | Detalles |
|---|---|
| Tamaño del mercado en 2024 | US$ 22.51 mil millones |
| Tamaño del mercado en 2031 | US$ 32.01 mil millones |
| CAGR global (2025-2031) | 5,3% |
| Datos históricos | 2021-2023 |
| Período de pronóstico | 2025-2031 |
| Segmentos cubiertos |
Por componente
|
| Regiones y países cubiertos |
América del norte
|
| Líderes del mercado y perfiles de empresas clave |
|
Densidad de actores del mercado de buses de datos: comprensión de su impacto en la dinámica empresarial
El mercado de buses de datos está creciendo rápidamente, impulsado por la creciente demanda de los usuarios finales debido a factores como la evolución de las preferencias de los consumidores, los avances tecnológicos y un mayor conocimiento de las ventajas del producto. A medida que aumenta la demanda, las empresas amplían su oferta, innovan para satisfacer las necesidades de los consumidores y aprovechan las tendencias emergentes, lo que impulsa aún más el crecimiento del mercado.
- Obtenga una descripción general de los principales actores clave del mercado de bus de datos
Noticias y desarrollos recientes del mercado de buses de datos
El mercado de buses de datos se evalúa mediante la recopilación de datos cualitativos y cuantitativos tras la investigación primaria y secundaria, que incluye importantes publicaciones corporativas, datos de asociaciones y bases de datos. A continuación, se enumeran algunos de los desarrollos clave en el mercado de buses de datos:
- Keysight y SPHEREA unieron fuerzas para ofrecer a los clientes capacidades de prueba mejoradas en el sector aeroespacial y de defensa. Esta nueva colaboración aprovecha la experiencia de Keysight en pruebas electrónicas de alto rendimiento y sistemas de medición, así como las capacidades de diseño e integración de SPHEREA, para brindar a los clientes soluciones locales basadas en tecnología de confianza. (Fuente: Keysight, comunicado de prensa, mayo de 2025)
- Emerson presentó las últimas incorporaciones a su línea de adquisición de datos (DAQ), con la introducción de los chasis Ethernet NI cDAQ-9187 y cDAQ-9183 y el módulo de entrada NI 9204. Junto con un repositorio de GitHub para los complementos del software DAQ de NI FlexLogger, estas nuevas soluciones ofrecen opciones rentables para implementar sistemas de prueba y medición de alto rendimiento a través de Ethernet.
(Fuente: Emerson, comunicado de prensa, febrero de 2025)
Informe de mercado de bus de datos: cobertura y resultados
El informe "Tamaño y pronóstico del mercado de buses de datos (2021-2031)" ofrece un análisis detallado del mercado que abarca las siguientes áreas:
- Tamaño del mercado de bus de datos y pronóstico a nivel global, regional y nacional para todos los segmentos clave del mercado cubiertos bajo el alcance
- Tendencias del mercado de bus de datos, así como dinámicas del mercado como impulsores, restricciones y oportunidades clave
- Análisis PEST y FODA detallado
- Análisis del mercado de bus de datos que cubre las tendencias clave del mercado, el marco global y regional, los principales actores, las regulaciones y los desarrollos recientes del mercado.
- Análisis del panorama industrial y de la competencia que abarca la concentración del mercado, el análisis de mapas de calor, los actores destacados y los desarrollos recientes del mercado de buses de datos.
- Perfiles detallados de empresas

Naveen es un experimentado profesional en investigación de mercados y consultoría con más de 9 años de experiencia en proyectos personalizados, sindicados y de consultoría. Actualmente se desempeña como Vicepresidente Asociado, donde ha gestionado con éxito a las partes interesadas en toda la cadena de valor del proyecto y ha redactado más de 100 informes de investigación y más de 30 proyectos de consultoría. Su trabajo abarca proyectos industriales y gubernamentales, contribuyendo significativamente al éxito de los clientes y a la toma de decisiones basada en datos.
Naveen es licenciado en Ingeniería Electrónica y Comunicaciones por la VTU (Karnataka) y tiene un MBA en Marketing y Operaciones por la Universidad de Manipal. Ha sido miembro activo del IEEE durante 9 años, participando en conferencias, simposios técnicos y realizando voluntariado tanto a nivel de sección como regional. Antes de su puesto actual, trabajó como Consultor Estratégico Asociado en IndustryARC y como Consultor de Servidores Industriales en Hewlett Packard (HP Global).
- Análisis exhaustivo del tamaño del mercado y previsiones
- Análisis detallado de la segmentación
- Evaluación en profundidad de la dinámica del mercado
- Información a nivel regional y nacional
- Panorama competitivo y análisis comparativo de empresas
- Inteligencia empresarial estratégica
Testimonios
El informe de mercado de sistemas SCADA de Insight Partners es completo y ofrece información valiosa sobre las tendencias actuales y las previsiones futuras. El equipo fue altamente profesional, receptivo y me brindó un gran apoyo en todo momento. Estamos muy satisfechos y recomendamos ampliamente sus servicios.
RAN KEDEM Socio, Reali Technologies LTDsSolicité un informe sobre un mercado de software muy específico y el equipo lo elaboró en pocos días. La información era muy relevante y estaba bien presentada. Posteriormente, solicité algunos cambios y adiciones al informe. El equipo fue muy receptivo y recibí el informe final en menos de una semana.
JEAN-HERVE JENN Presidente, Future AnalyticaTrabajamos con The Insight Partners para un importante estudio y pronóstico de mercado. Nos brindaron una visión clara de las oportunidades y los riesgos, lo que nos ayudó a definir nuestros planes. Su investigación fue fácil de usar y se basó en datos sólidos. Nos ayudó a tomar decisiones inteligentes y seguras. Los recomendamos ampliamente.
PIYUSH NAGPAL Vicepresidente Sénior, , High Beam GlobalThe Insight Partners realizó una investigación de mercado profunda y bien estructurada con una sólida experiencia en el sector. Su equipo fue profesional y receptivo en todo momento. El sitio web, fácil de usar, facilitó el acceso a los informes del sector. Los recomendamos ampliamente por sus servicios de investigación confiables y de alta calidad.
YUKIHIKO ADACHI Director Ejecutivo, , Deep Blue, LLCEsta es la primera vez que compro un informe de mercado de The Insight Partners. Aunque al principio tenía dudas, visité su sitio web y me sentí más cómodo al arriesgarme y comprarlo. Estoy completamente satisfecho con la calidad del informe y el servicio al cliente. Tenía varias preguntas y comentarios sobre el informe inicial, pero después de un par de conversaciones por correo electrónico con su analista, creo que tengo un informe que puedo usar como base para nuestro proceso de planificación estratégica. Muchas gracias por tomarse el tiempo y hacer de esta una experiencia positiva. Sin duda, recomendaré sus servicios y serán mi primera opción cuando necesitemos más datos de mercado.
JOHN SUZUKI Presidente y Director Ejecutivo, Director de la Junta Directiva, BK TechnologiesAgradezco su apoyo y la profesionalidad que demostraron al atender mi solicitud de información sobre el mercado de diagnóstico in vitro (IVD) para enfermedades infecciosas en Nigeria. Agradezco su paciencia, su orientación y su disposición a ofrecerme un descuento, lo que finalmente nos permitió cerrar un trato. Espero poder colaborar con The Insight Partners en el futuro, gracias a la impresión que me causó este primer encuentro.
DRA. CHIJIOKE ONYIA, DIRECTORA GENERAL, PineCrest Healthcare Ltd.Razón para comprar
- Toma de decisiones informada
- Comprensión de la dinámica del mercado
- Análisis competitivo
- Información sobre clientes
- Pronósticos del mercado
- Mitigación de riesgos
- Planificación estratégica
- Justificación de la inversión
- Identificación de mercados emergentes
- Mejora de las estrategias de marketing
- Impulso de la eficiencia operativa
- Alineación con las tendencias regulatorias


