추적 솔루션 시장 개요, 성장, 동향, 분석, 연구 보고서(2021-2031)
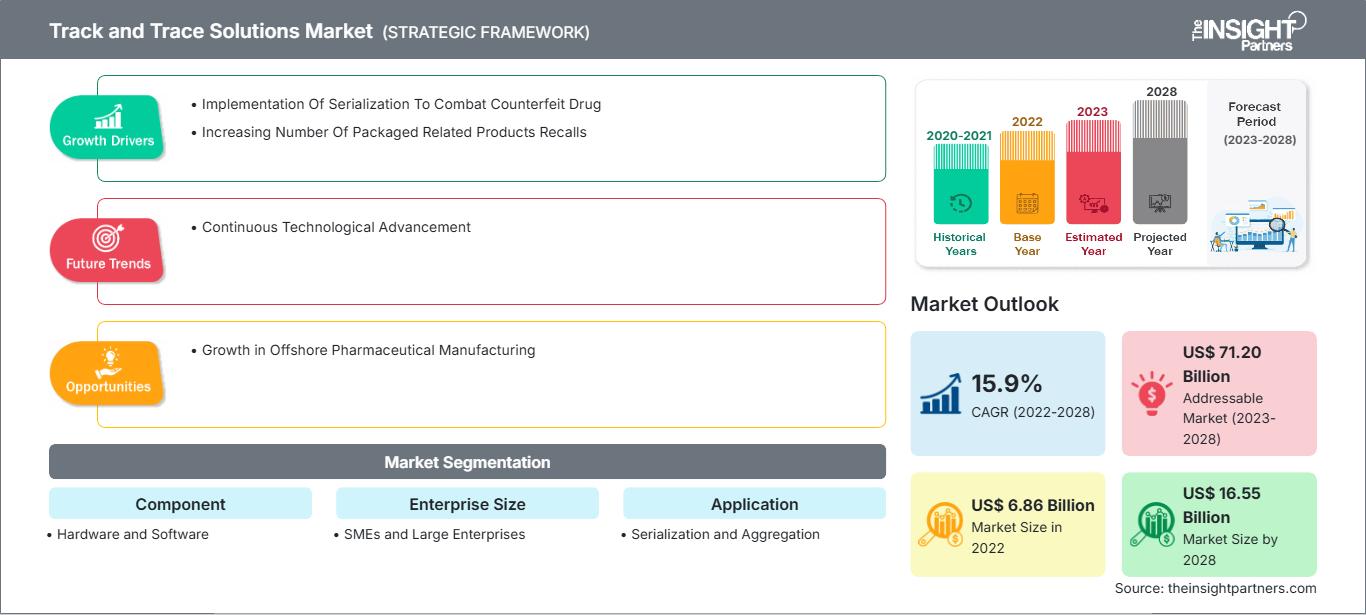
이전 데이터 : 2020-2021 | 기준 연도 : 2022 | 예측 기간 : 2023-2028추적 및 추적 솔루션 시장 규모 및 예측(2020~2030년), 글로벌 및 지역별 점유율, 추세 및 성장 기회 분석 보고서 범위: 구성 요소(하드웨어 및 소프트웨어), 기업 규모(중소기업 및 대기업), 애플리케이션(직렬화 및 집계), 산업(제약, 의료 기기, 소비재, 식음료 및 기타)별
- 상태 : 게시됨
- 보고서 코드 : TIPHE100000989
- 범주 : 기술, 미디어 및 통신
- 페이지 수 : 210
- 사용 가능한 보고서 형식 :


[연구 보고서] 추적 및 추적 솔루션 시장 규모는 2022년 68억 5천만 달러로 평가되었으며, 2030년에는 227억 달러에 이를 것으로 예상됩니다. 2022년부터 2030년까지 연평균 성장률 16.2%를 기록할 것으로 예상됩니다.
시장 통찰력 및 분석가 의견:
추적 및 추적 솔루션은 여러 지역에서 규정 준수를 지원하는 것을 목표로 합니다. 도입 후, 제약 회사가 추적 및 추적 규정을 쉽게 준수하고, 리콜을 효과적으로 관리하며, 제조 공정의 전반적인 효율성을 높일 수 있도록 포괄적이고 지식이 풍부한 환경을 제공합니다. 엄격한 일련번호 부여 기준 및 기준, 그리고 포장 관련 제품 리콜 증가는 시장 성장의 주요 원인입니다. 또한, 해외 제약 제조 시장의 성장은 예측 기간 동안 전체 시장 성장에 수익성 있는 시장 기회를 제공합니다. 위조 의약품 방지를 위한 일련번호 제도 도입과 포장 관련 제품 리콜 증가는 추적 및 추적 솔루션 시장 성장을 촉진하고 있습니다. 또한, 지속적인 기술 발전으로 향후 몇 년 동안 새로운 추적 및 추적 솔루션 시장 트렌드가 형성될 것으로 예상됩니다.
추적 및 추적 솔루션 시장 성장 동력:
전 세계적으로 제약 회사들은 의약품의 위조 방지 및 추적성을 보장하기 위해 일련번호 제도 관련 규정을 준수하고 있습니다. 대부분의 선진국과 개발도상국은 이미 일련번호 제도에 대한 규제 로드맵을 수립했거나 시행할 계획입니다. 의약품 공급망을 보호하기 위한 규제 강화는 의약품 관련 불법 활동 증가와 공급망 비효율성 증가에 기인합니다. 의약품 위조 및 무단 병행 공급망 문제 해결, 공급망 가시성 향상, 반품 또는 리콜 추적, 그리고 환자 행동 예측을 위한 데이터 기반 도구의 부족을 목표로 합니다. 의료 제품의 일련번호 표시를 의무화하는 정부 규정의 몇 가지 예는 다음과 같습니다.
미국에서는 2013년에 약물 공급망 보안법(DSCSA)이 시행되었습니다. DSCSA는 미국 내 유통 과정 전반에 걸쳐 의약품을 식별하고 추적할 수 있는 상호 운용 가능한 전자 시스템에 대한 요건을 정의합니다. 이 요건의 일환으로, 의약품에는 국가 의약품 코드(NDC), 일련번호, 제조 번호 및 유효기간이 표시되어야 합니다. 미국 식품의약국(FDA)은 제조업체가 FDA로부터 추적 시스템 구축 명령을 받으면 전체 유통망에서 특정 기기를 추적하도록 의무화합니다. 이러한 기기는 1등급, 2등급 또는 3등급으로 분류될 수 있습니다.
요구 사항에 맞게 이 보고서를 사용자 정의하십시오.
이 보고서의 일부, 국가 수준 분석, Excel 데이터 팩을 포함하여 모든 보고서에 대한 사용자 정의를 무료로 받을 수 있을 뿐만 아니라 스타트업 및 대학을 위한 훌륭한 제안 및 할인을 이용할 수 있습니다
추적 및 추적 솔루션 시장: 전략적 통찰력
-
이 보고서의 주요 주요 시장 동향을 확인하세요.이 무료 샘플에는 시장 동향부터 추정 및 예측에 이르기까지 데이터 분석이 포함됩니다.
또한 유럽 연합(EU)은 위조 의약품 지침(FMD)을 제정하여 규정 준수 요건을 준수했습니다. 단위 단위 일련번호 표시 및 조제자 인증이 의무화되었습니다. 또한 터키에서는 일련번호 표시 구현의 첫 단계로 각 단위 포장에 관련 코드와 정보를 인라인 인쇄하는 것이었습니다. 터키와 프랑스 제약 공장의 초기 요건은 2D 코드 인라인 인쇄와 관련된 위험과 어려움을 드러냈으며, 이를 해결하는 데 3년이 걸렸습니다. 2021년 5월 발효된 유럽 연합 의료기기 규정(EU MDR)은 의료기기의 전체 수명 주기에 걸쳐 안전성과 성능을 향상시키도록 설계되었습니다. 이 규정은 EU 회원국의 투명성과 정보 접근성을 향상시켜 의료기기 정보의 조정을 강화할 계획입니다.
2012년 인도 대외무역총국(DGFT) 또한 2차 및 3차 수준의 일련번호 표시를 의무화하고 수출 선적 보고 지침을 수립했습니다. 여러 국가에서도 제조 및 수입에 대해 유사한 규정을 시행하고 있습니다. 브라질에서는 모든 의약품의 단위 및 케이스(운송 포장 용기)에 일련번호를 부여하는 것이 의무화되어 있습니다. 케이스에는 해당 단위에 대한 정보가 포함되어야 합니다. 제조/수입업체, 도매업체, 유통업체, 약국 등 각 단계의 공급망 추적이 의무화됩니다. 여러 국가의 정부는 위조가 제품 일련번호 부여를 통해 해결할 수 있는 조직범죄라고 생각하며, 많은 국가가 이와 관련하여 조치를 취하고 있습니다. 일련번호화를 통해 고급 분석 프로그램을 실행하여 소비 패턴, 지역 침투율, 매출, 마케팅 지출 효과 등에 대한 심층적인 인사이트를 얻을 수 있습니다. 2013년 의약품 공급망 보안법(Drug Supply Chain Security Act)에 따라 2017년 11월부터 미국에서 처방약을 판매하는 모든 제약 회사는 제조업체에서 약국 또는 병원까지의 제품 추적을 지원하기 위해 판매 가능한 모든 의약품 단위에 일련번호를 부여해야 합니다. EU 위조 의약품 지침(EU FMD)에 따라 2019년 2월까지 EU 시장에서 사업을 하는 제약 회사는 일련번호화를 시행해야 합니다. 제약 회사는 이러한 의무를 준수하지 않을 경우 위반 시 벌금 부과부터 제품 출시 금지까지 막대한 불이익을 받을 수 있습니다. 기업이 일련번호화를 하지 않으면 미국 내 어떤 도매업체도 해당 제품을 구매하지 않을 것입니다. 공급망 내에서 품질, 가시성, 완벽한 추적성을 제공하는 것 외에도, 성공적인 일련번호화 프로그램은 기업에 중요한 차별화 요소이자 확실한 경쟁 우위를 제공할 것입니다. 따라서 개발도상국의 위조 의약품 방지를 위한 의약품 일련번호 부여는 추적 솔루션 시장 성장을 촉진합니다.
보고서 세분화 및 범위:
추적 솔루션 시장 분석은 구성 요소, 기업 규모, 응용 분야, 산업 및 지역별로 구분하여 수행되었습니다. 구성 요소별로 시장은 하드웨어와 소프트웨어로 구분됩니다. 하드웨어 구성 요소는 바코드 스캐너, 무선 주파수 식별 판독기 등으로 세분화됩니다. 소프트웨어 구성 요소는 플랜트 관리자, 라인 컨트롤러 등으로 세분화됩니다. 기업 규모별로 시장은 중소기업과 대기업으로 구분됩니다. 응용 분야별로 시장은 일련번호 부여 및 집계로 구분됩니다. 산업별로 시장은 제약, 의료기기, 소비재, 식음료 등으로 세분화됩니다. 추적 및 추적 솔루션 시장 보고서의 범위는 북미(미국, 캐나다, 멕시코), 유럽(스페인, 영국, 독일, 프랑스, 이탈리아 및 기타 유럽), 아시아 태평양(한국, 중국, 일본, 인도, 호주 및 기타 아시아 태평양), 중동 및 아프리카(남아프리카, 사우디아라비아, UAE 및 기타 중동 및 아프리카), 남미 및 중미(브라질, 아르헨티나 및 기타 남미 및 중미)를 포함합니다.
세분화 분석:
추적 및 추적 솔루션 시장은 유형별로 하드웨어와 소프트웨어로 나뉩니다. 하드웨어 구성 요소는 바코드 스캐너, 무선 주파수 식별 판독기 등으로 세분화됩니다. 소프트웨어 구성 요소는 플랜트 관리자, 라인 컨트롤러 등으로 세분화됩니다. 2022년에는 소프트웨어 부문이 시장 점유율을 확대했으며 2022년부터 2030년까지 더 높은 CAGR을 기록할 것으로 예상됩니다. 추적 소프트웨어는 다양한 용도로 사용되며 전체 일련번호 부여 및 집계 프로세스를 완벽하게 관리합니다. 이 솔루션은 연결성이 제한된 단일 라인이든 여러 생산 라인의 모든 프로세스를 모니터링하는 소프트웨어가 필요하든 유연성을 제공합니다. 이 소프트웨어는 규정 준수에 필요한 모든 문서와 정보를 제공합니다. 이 추적 소프트웨어는 제약, 생산, 식음료, 해산물 산업에 사용됩니다. Rfxcel Corp., METTLER TOLEDO, JDA Software Group, Inc 등이 추적 소프트웨어를 제공하는 회사입니다. 이 소프트웨어는 관리 업무 감소 및 품질 이벤트에 대한 신뢰도 향상, 노출된 제품의 범위를 넓혀 품질 이벤트의 신속한 관리, 고객 및 브랜드 이미지 보호와 같은 고유한 이점을 제공합니다. 추적 솔루션 시장은 애플리케이션별로 일련번호 부여 솔루션과 집계 솔루션으로 구분됩니다. 2022년에는 일련번호 부여 솔루션 부문이 더 큰 시장 점유율을 기록했습니다. 또한, 이 부문은 2022년부터 2030년까지 가장 높은 연평균 성장률(CAGR)을 기록할 것으로 예상됩니다. 일련번호 부여는 모든 제품에 미리 정해진 유형의 코드를 부여하고 고유한 식별 태그를 부착하여 사실상 언제든지 제품을 추적할 수 있도록 하는 것을 의미하며, 생산, 공급망 및/또는 마케팅 체인의 모든 단계, 또는 제품 수명 주기의 어느 시점에서든 제품의 위치를 추적할 수 있습니다. 오늘날 모든 산업의 공급망은 그 어느 때보다 길고 복잡해지고 있습니다. 따라서 위조, 그레이 마케팅, 제품 혼입과 같은 사고가 빠르게 증가하고 있습니다. 제약, 의료기기, 생명 과학과 같은 산업에 대한 글로벌 규정 준수를 위한 일련의 규제 요건을 갖춘 대부분의 국가는 제품 종단 간 무결성을 보장하고 입증하기 위한 표준화된 방법이 필요합니다. 추적 및 추적 시스템을 위한 일련번호 부여 솔루션은 이러한 문제를 직접 해결함으로써 제약 및 의료기기 공급망의 책임성을 강화했습니다. 글로벌 제약 산업에서 공급망 내 의약품 추적 기능은 의약품 안전을 개선하고 위조를 방지하기 위해 규제적으로 매우 중요하며 끊임없이 발전해 왔습니다. 일련번호 솔루션을 사용하면 제품에 유통기한, 로트 코드, 일련번호, GTIN, 2D 매트릭스 코드, GSI-DataMatrix 기호를 인코딩하여 위조 방지를 위한 제품 추적을 지원할 수 있습니다. 또한 일련번호를 통해 공급망 전체에서 제품을 추적하고 브랜드 및 소비자를 보호하며 규정을 준수할 수 있습니다.
기업 규모를 기준으로 전 세계 추적 솔루션 시장은 중소기업과 대기업으로 구분됩니다. 2022년에는 대기업 부문의 시장 점유율이 더 높았습니다. 중소기업 부문은 2022년부터 2030년까지 더 높은 연평균 성장률을 기록할 것으로 예상됩니다.
산업별 추적 솔루션 시장은 제약, 의료기기, 소비재, 식음료 등으로 세분화됩니다. 2022년 제약 부문은 시장 점유율 1위를 차지했으며, 2022년부터 2030년까지 가장 높은 연평균 성장률(CAGR)을 기록할 것으로 예상됩니다.
지역 분석:
지리적으로 시장은 북미, 유럽, 아시아 태평양, 중동 및 아프리카, 중남미로 구분됩니다. 북미는 세계 시장에 가장 큰 기여를 하는 지역입니다. 아시아 태평양 지역은 2022년부터 2030년까지 가장 높은 연평균 성장률을 기록할 것으로 예상됩니다. 북미는 혁신적인 제품 출시와 기술 발전을 거듭하는 대형 업체들의 존재감으로 2022년 세계 추적 솔루션 시장에서 가장 큰 점유율을 기록했습니다. 북미 지역에서는 미국이 2022년 추적 솔루션 시장 점유율 1위를 차지했습니다.
추적 및 추적 솔루션 시장 지역별 통찰력
The Insight Partners의 분석가들은 예측 기간 동안 추적 솔루션 시장에 영향을 미치는 지역별 동향과 요인을 면밀히 분석했습니다. 이 섹션에서는 북미, 유럽, 아시아 태평양, 중동 및 아프리카, 그리고 중남미 지역의 추적 솔루션 시장 부문 및 지역별 현황도 다룹니다.
추적 및 추적 솔루션 시장 보고서 범위
| 보고서 속성 | 세부 |
|---|---|
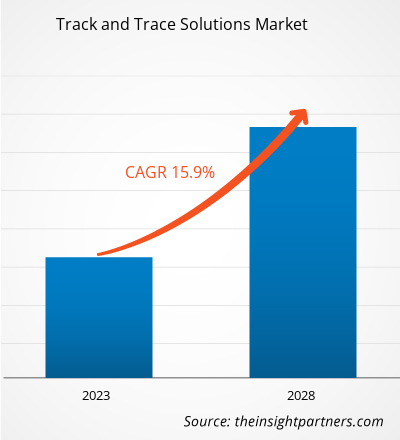
| 시장 규모 2022 | US$ 6.86 Billion |
| 시장규모별 2028 | US$ 16.55 Billion |
| 글로벌 CAGR (2022 - 2028) | 15.9% |
| 이전 데이터 | 2020-2021 |
| 예측 기간 | 2023-2028 |
| 다루는 세그먼트 |
By 구성 요소
|
| 포함된 지역 및 국가 |
북미
|
| 시장 선도 기업 및 주요 회사 프로필 |
|
추적 및 추적 솔루션 시장 참여자 밀도: 비즈니스 역학에 미치는 영향 이해
추적 및 추적 솔루션 시장은 소비자 선호도 변화, 기술 발전, 그리고 제품 이점에 대한 인식 제고 등의 요인으로 인한 최종 사용자 수요 증가에 힘입어 빠르게 성장하고 있습니다. 수요가 증가함에 따라 기업들은 제품 및 서비스를 확장하고, 소비자 니즈를 충족하기 위한 혁신을 추진하며, 새로운 트렌드를 적극 활용하고 있으며, 이는 시장 성장을 더욱 가속화하고 있습니다.
- 을 얻으세요 추적 및 추적 솔루션 시장 주요 주요 플레이어 개요
추적 및 추적 솔루션 시장 전망은 주요 기업 간행물, 협회 데이터, 데이터베이스 등 다양한 2차 및 1차 연구 결과를 기반으로 추산됩니다. 추적 및 추적 솔루션 시장에서 활동하는 주요 업체의 전략은 다음과 같습니다.
- 2023년 11월, Sys-Tech Solutions Inc.는 UniSecure 플랫폼 출시를 발표했습니다. 이 플랫폼은 제품 오남용 및 위조를 감지하는 종합적인 제품 보안 솔루션입니다. 공급망 프로세스 전반에 걸쳐 스마트폰을 통해 고유 제품 식별, 추적 및 제품 검증 기능을 제공합니다. 새롭게 출시된 이 플랫폼은 제약, 건강기능식품, 의료 제품, 스킨케어 및 기타 시장을 대상으로 합니다.
- 2022년 10월, Zebra Technologies Corporation은 RFID 및 실시간 위치 시스템(RTLS) 판매에 중점을 둔 파트너를 위한 새로운 PartnerConnect 위치 및 추적 전문화 프로그램을 발표했습니다. Zebra의 수상 경력에 빛나는 PartnerConnect 프로그램의 전략적 구성 요소로 개발된 새로운 위치 및 추적 전문화 프로그램은 리셀러에게 RFID 및 RTLS 판매를 촉진하고 기업이 혁신적인 비즈니스 이점을 위해 이러한 솔루션을 성공적으로 구축할 수 있도록 지원하는 데 필요한 도구를 제공합니다.
경쟁 환경 및 주요 기업:
ACG, Axway Software SA, Antares Vision SPA, Markem-Imaje AG, Mettler-Toledo International Inc, Optel Group, SEA Vision Grp, Siemens AG, TraceLink Inc, Zebra Technologies Corp는 추적 및 추적 솔루션 시장 보고서에 소개된 주요 기업입니다. 또한, 시장과 생태계에 대한 전체적인 관점을 얻기 위해 연구 기간 동안 여러 다른 기업들을 연구 및 분석했습니다. 이들 기업은 전 세계 소비자의 증가하는 수요를 충족하고 특수 포트폴리오의 제품 범위를 확대하기 위해 지리적 확장 및 제품 출시에 집중하고 있습니다. 이러한 글로벌 입지를 통해 광범위한 고객 기반을 확보하고 시장 확장을 촉진하고 있습니다.

안키타는 기술, 미디어, 정보통신기술(ICT), 전자 및 반도체 분야에서 8년 이상의 경력을 보유한 역동적인 시장 조사 및 컨설팅 전문가입니다. Microsoft, Oracle, NEC Corporation, SAP, KPMG, Expeditors International 등 글로벌 고객을 대상으로 100건 이상의 컨설팅 및 조사 업무를 성공적으로 이끌고 수행했습니다. 그녀의 핵심 역량은 시장 평가, 데이터 분석, 예측, 전략 수립, 경쟁 정보 분석, 보고서 작성입니다.
안키타는 사전 판매 제안서 설계 및 고객 논의부터 실행 가능한 인사이트의 사후 판매까지 전체 프로젝트 주기를 능숙하게 처리합니다. 또한, 여러 부서의 팀을 관리하고, 복잡한 조사 모듈을 구성하며, 고객별 비즈니스 목표에 맞춰 솔루션을 조정하는 데 능숙합니다. 뛰어난 의사소통, 리더십, 그리고 프레젠테이션 능력을 바탕으로 빠르게 변화하는 시장 환경에서도 가치 중심의 성과를 꾸준히 달성해 왔습니다.
- 과거 분석(2년), 기준 연도, CAGR을 포함한 예측(7년)
- PEST 및 SWOT 분석
- 시장 규모 가치/거래량 - 글로벌, 지역, 국가
- 산업 및 경쟁 환경
- Excel 데이터세트
사용 후기
Insight Partners의 SCADA 시스템 시장 보고서는 포괄적이며, 현재 동향과 미래 전망에 대한 귀중한 통찰력을 제공합니다. 팀은 매우 전문적이고, 신속하게 대응하며, 처음부터 끝까지 지원해 주었습니다. 저희는 매우 만족하며 Insight Partners의 서비스를 적극 추천합니다.
란 케뎀 파트너, Reali Technologies LTDs아주 구체적인 소프트웨어 시장에 대한 보고서를 요청했는데, 팀에서 며칠 만에 보고서를 작성해 주셨습니다. 정보는 매우 관련성이 높고 잘 정리되어 있었습니다. 그 후 보고서에 몇 가지 수정과 추가 사항을 요청했습니다. 팀원들의 응답도 매우 빨랐고, 일주일도 채 되지 않아 최종 보고서를 받았습니다.
장-에르브 젠 의장, 퓨처 애널리티카The Insight Partners와 함께 중요한 시장 조사 및 예측 작업을 진행했습니다. Insight Partners는 기회와 위험에 대한 명확한 통찰력을 제공하여 계획을 세우는 데 큰 도움이 되었습니다. The Insight Partners의 조사는 사용하기 쉬웠고, 탄탄한 데이터를 기반으로 했습니다. 덕분에 현명하고 자신 있는 결정을 내릴 수 있었습니다. The Insight Partners를 강력 추천합니다.
피유시 나그팔 수석 부사장, 하이빔 글로벌Insight Partners는 탄탄한 분야 전문성을 바탕으로 통찰력 있고 체계적인 시장 조사를 제공했습니다. Insight Partners 팀은 처음부터 끝까지 전문적이고 신속하게 대응했습니다. 사용자 친화적인 웹사이트 덕분에 업계 보고서에 쉽게 접근할 수 있었습니다. 신뢰할 수 있고 고품질의 조사 서비스를 원하신다면 Insight Partners를 강력 추천합니다.
아다치 유키히코 대표이사, 딥블루 주식회사The Insight Partners에서 시장 보고서를 구매한 것은 이번이 처음입니다. 처음에는 확신이 없었지만, 웹사이트를 방문하고 나서 위험을 감수하고 시장 보고서를 구매하는 것이 더 편하다는 것을 알게 되었습니다. 보고서의 품질과 고객 서비스에 매우 만족합니다. 처음 보고서를 보고 몇 가지 질문과 의견이 있었지만, 분석가와 이메일로 몇 차례 대화를 나눈 후, 전략 기획 과정에 참고할 수 있는 보고서를 확보했다고 생각합니다. 시간을 내어 긍정적인 경험을 선사해 주셔서 정말 감사합니다. 다른 사람들에게도 귀사의 서비스를 적극 추천할 것이며, 추가적인 시장 데이터가 필요할 때면 가장 먼저 귀사에 연락하겠습니다.
존 스즈키 사장 겸 최고 경영자, 이사회 이사, BK 테크놀로지스나이지리아 감염성 질환 IVD 시장 관련 정보 요청에 응해 주신 귀사의 지원과 전문성에 감사드립니다. 귀사의 인내심과 지도, 그리고 할인 혜택을 기꺼이 제공해 주셔서 결국 계약을 성사시킬 수 있었습니다. 첫 만남을 통해 귀사가 저에게 심어주신 좋은 인상을 바탕으로 앞으로도 The Insight Partners와 함께할 수 있기를 기대합니다.
치지오케 박사 오니아 전무이사, 파인크레스트 헬스케어 유한회사구매 이유
- 정보에 기반한 의사 결정
- 시장 역학 이해
- 경쟁 분석
- 고객 인사이트
- 시장 예측
- 위험 완화
- 전략 기획
- 투자 타당성 분석
- 신흥 시장 파악
- 마케팅 전략 강화
- 운영 효율성 향상
- 규제 동향에 발맞춰 대응


 무료 샘플 받기 - 추적 및 추적 솔루션 시장