
Data Visualization Tools Market Demand, Trends & Forecast by 2034
Data Visualization Tools Market Size and Forecasts (2021 - 2034), Global and Regional Share, Trends, and Growth Opportunity Analysis Report Coverage : By Component (Software, Service), Organization Size (Large Size Enterprises, Small and Medium Sized Enterprises), Deployment (Cloud, On-premise), End-users (BFSI, IT and Telecommunication, Manufacturing, Healthcare & Life Sciences, Retail and E-commerce, Government, Others)
- Status : Data Released
- Report Code : TIPRE00039807
- Category : Technology, Media and Telecommunications
- No. of Pages : 150
- Available Report Formats :


- Last update date : January 16, 2025

2025 Market Size
US$ 13.35 Bn
Base year value
2034 Forecast
US$ 34.46 Bn
Projected by 2034
CAGR 2026-2034
11.11 %
Growth rate
Addressable Market
US$ 211.07 Bn
(2026-2034)
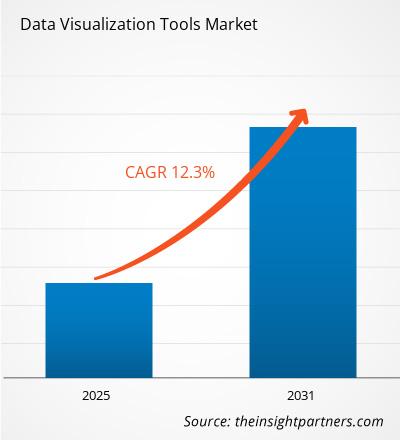
Data Visualization Tools market is expected to register a CAGR of 11.11% from 2026 to 2034, with the market size expanding from US$ 13.35 Billion in 2025 to US$ 34.46 Billion by 2034.
The report is segmented By Component (Software, Service), Organization Size (Large Size Enterprises, Small and Medium Sized Enterprises), Deployment (Cloud, On-premise), End-users (BFSI, IT and Telecommunication, Manufacturing, Healthcare & Life Sciences, Retail and E-commerce, Government, Others). The global analysis is further broken-down at regional level and major countries. The report offers the value in USD for the above analysis and segments
Purpose of the Report
The report Data Visualization Tools Market by The Insight Partners aims to describe the present landscape and future growth, top driving factors, challenges, and opportunities. This will provide insights to various business stakeholders, such as:
- Technology Providers/Manufacturers: To understand the evolving market dynamics and know the potential growth opportunities, enabling them to make informed strategic decisions.
- Investors: To conduct a comprehensive trend analysis regarding the market growth rate, market financial projections, and opportunities that exist across the value chain.
- Regulatory bodies: To regulate policies and police activities in the market with the aim of minimizing abuse, preserving investor trust and confidence, and upholding the integrity and stability of the market.
Data Visualization Tools Market Segmentation
Component
- Software
- Service
Organization Size
- Large Size Enterprises
- Small and Medium Sized Enterprises
Deployment
- Cloud
- On-premise
End-users
- BFSI
- IT and Telecommunication
- Manufacturing
- Healthcare & Life Sciences
- Retail and E-commerce
- Government
Market Research Highlights
- Global market for Data Visualization Tools was valued at US$ 13.35 Billion in 2025
- Annual market size is expected to reach US$ 34.46 Billion by 2034
- Total addressable market (TAM) during 2026-2034 is projected to reach approximately US$ 211.07 Billion
- Market is anticipated to register a CAGR of 11.11% during the forecast period
- The United States represents a key market, supported by Enhancing decision-making through real-time data visualization tools., Increasing demand for interactive dashboards in business intelligence solutions., Expanding adoption of cloud-based platforms for data visualization services., as well as evolving industry dynamics
- Market analysis covers North America, Europe, Asia-Pacific, South and Central America, Middle East and Africa, with growth evaluated across the forecast period
- Market opportunities such as Exploring AI-driven analytics for enhanced data insights., Developing user-friendly interfaces for non-technical users., Integrating real-time collaboration features for remote teams. are expected to influence market dynamics and addressable market
- Report profiles industry participants, including Salesforce, Inc., Alibaba Cloud, Oracle, Amazon Web Services, Inc., SAS Institute Inc., Sisense Inc., Microsoft Corporation, TIBCO software, IBM, SAP, while analyzing competitive strategies and innovation developments
-
Source: The Insight Partners' analysis based on proprietary research, government publications, company annual reports, investor presentations, industry databases, and expert interviews.
● REPORT CUSTOMIZATION
Tailor This Report To Align With Your Specific Business Requirements
This report can be customized to align precisely with your business objectives, scope, and target markets. Customization options include tailored segmentation, geography, competitive analysis, and strategic insights to support informed decision-making.
Customize This Report →WHAT YOU CAN ADJUST
- ● Segmentations
- ● Geography
- ● Competitive Analysis
- ● Language Preferences
Data Visualization Tools Market: Strategic Insights

-
Get Top Key Market Trends of this report.This FREE sample will include data analysis, ranging from market trends to estimates and forecasts.
Data Visualization Tools Market Growth Drivers
- Increasing Data Volume and Complexity: As organizations generate and store massive amounts of data, the complexity of analyzing and deriving insights grows. Data visualization tools help users make sense of large, complex datasets by presenting them in an easy-to-understand visual format. This demand for efficient data interpretation is driving the adoption of data visualization tools across various industries, from finance to healthcare.
- Rising Demand for Real-Time Analytics: The growing need for real-time data analysis is a key driver of the data visualization market. Businesses are increasingly relying on real-time dashboards and visual analytics to make quicker, data-driven decisions. These tools allow companies to monitor performance, track KPIs, and respond to market changes instantly, boosting the demand for effective visualization software.
- Growing Focus on Data-Driven Decision Making: More organizations are adopting data-driven strategies to stay competitive. Data visualization tools enable decision-makers to view trends, identify patterns, and analyze KPIs easily. By transforming raw data into interactive visuals, these tools support faster and more accurate decision-making, driving market growth across industries.
Data Visualization Tools Market Future Trends
- Integration with Advanced Analytics: Data visualization tools are increasingly being integrated with advanced analytics technologies, such as artificial intelligence (AI) and machine learning (ML). This integration allows users to create more predictive and actionable insights through enhanced visualizations. As these capabilities evolve, they are pushing the adoption of data visualization tools, making them more valuable for businesses looking to extract deeper insights from their data.
- Cloud-Based Data Visualization Solutions: Cloud-based data visualization tools are becoming more prevalent due to their scalability, ease of access, and cost-effectiveness. These solutions allow businesses to collaborate on visual analytics from anywhere, reduce the need for on-premise infrastructure, and provide real-time access to data. This trend is driving the growth of cloud-based platforms within the data visualization market, especially for remote teams and global enterprises.
Data Visualization Tools Market Opportunities
- Adoption by Small and Medium Enterprises (SMEs): Traditionally, data visualization tools were primarily adopted by large enterprises. However, as these tools become more affordable and user-friendly, there is a growing opportunity to cater to small and medium-sized enterprises (SMEs). Offering tailored, cost-effective solutions to SMEs allows vendors to tap into an underserved market, expanding the data visualization tools market significantly.
- Expansion into Industry-Specific Solutions: There is an increasing demand for data visualization tools that are customized for specific industries, such as healthcare, finance, and retail. By developing vertical-specific solutions, providers can address unique needs like regulatory compliance, financial forecasting, or patient care insights. This industry-focused approach presents a significant opportunity for growth, as organizations seek tailored solutions for more precise and relevant data visualization.
Data Visualization Tools Market Report Scope
| Report Attribute | Details |
|---|---|
| Market size in 2025 | US$ 13.35 Billion |
| Market Size by 2034 | US$ 34.46 Billion |
| Global CAGR (2026 - 2034) | 11.11% |
| Historical Data | 2021-2024 |
| Forecast period | 2026-2034 |
| Segments Covered |
By Component
|
| Regions and Countries Covered |
North America
|
| Market leaders and key company profiles |
|
Data Visualization Tools Market Players Density: Understanding Its Impact on Business Dynamics
The Data Visualization Tools Market is growing rapidly, driven by increasing end-user demand due to factors such as evolving consumer preferences, technological advancements, and greater awareness of the product's benefits. As demand rises, businesses are expanding their offerings, innovating to meet consumer needs, and capitalizing on emerging trends, which further fuels market growth.
Key Selling Points
- Comprehensive Coverage: The report comprehensively covers the analysis of products, services, types, and end users of the Data Visualization Tools Market, providing a holistic landscape.
- Expert Analysis: The report is compiled based on the in-depth understanding of industry experts and analysts.
- Up-to-date Information: The report assures business relevance due to its coverage of recent information and data trends.
- Customization Options: This report can be customized to cater to specific client requirements and suit the business strategies aptly.
The research report on the Data Visualization Tools Market can, therefore, help spearhead the trail of decoding and understanding the industry scenario and growth prospects. Although there can be a few valid concerns, the overall benefits of this report tend to outweigh the disadvantages.
Frequently Asked Questions

- Comprehensive Market Sizing and Forecast Analysis
- Detailed Segmentation Analysis
- In-Depth Market Dynamics Assessment
- Regional and Country-Level Insights
- Competitive Landscape and Company Benchmarking
- Strategic Business Intelligence
Recent Reports
Testimonials
The Insight Partners' SCADA System Market report is comprehensive, with valuable insights on current trends and future forecasts. The team was highly professional, responsive, and supportive throughout. We are very satisfied and highly recommend their services.
RAN KEDEM Partner, Reali Technologies LTDsI requested a report on a very specific software market and the team produced the report in a few days. The information was very relevant and well presented. I then requested some changes and additions to the report. The team was again very responsive and I got the final report in less than a week.
JEAN-HERVE JENN Chairman, Future AnalyticaWe worked with The Insight Partners for an important market study and forecast. They gave us clear insights into opportunities and risks, which helped shape our plans. Their research was easy to use and based on solid data. It helped us make smart, confident decisions. We highly recommend them.
PIYUSH NAGPAL Sr. Vice President, High Beam GlobalThe Insight Partners delivered insightful, well-structured market research with strong domain expertise. Their team was professional and responsive throughout. The user-friendly website made accessing industry reports seamless. We highly recommend them for reliable, high-quality research services
YUKIHIKO ADACHI CEO, Deep Blue, LLC.This is the first time I have purchased a market report from The Insight Partners.While I was unsure at first, I visited their web site and felt more comfortable to take the risk and purchase a market report.I am completely satisfied with the quality of the report and customer service. I had several questions and comments with the initial report, but after a couple of dialogs over email with their analyst I believe I have a report that I can use as input to our strategic planning process.Thank you so much for taking the extra time and making this a positive experience.I will definitely recommend your service to others and you will be my first call when we need further market data.
JOHN SUZUKI President and Chief Executive Officer, Board Director, BK TechnologiesI wish to appreciate your support and the professionalism you displayed in the course of attending to my request for information regarding to infectious disease IVD market in Nigeria. I appreciate your patience, your guidance, and the fact that you were willing to offer a discount, which eventually made it possible for us to close a deal. I look forward to engaging The Insight Partners in the future, all thanks to the impression you have created in me as a result of this first encounter.
DR CHIJIOKE ONYIA MANAGING DIRECTOR, PineCrest Healthcare Ltd.Reason to Buy
- Informed Decision-Making
- Understanding Market Dynamics
- Competitive Analysis
- Identifying Emerging Markets
- Customer Insights
- Market Forecasts
- Risk Mitigation
- Boosting Operational Efficiency
- Strategic Planning
- Investment Justification
- Tracking Industry Innovations
- Aligning with Regulatory Trends


