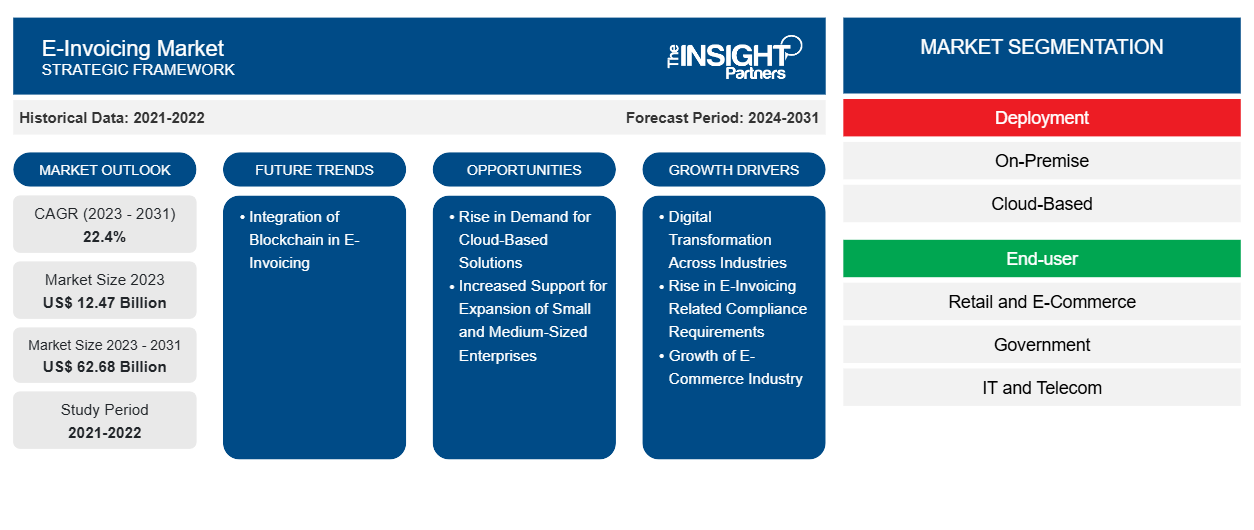
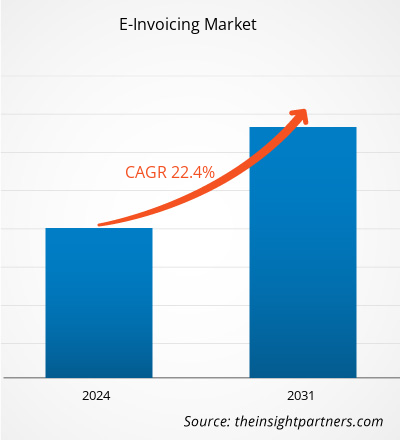
The e-invoicing market size is projected to reach US$ 62.68 billion by 2031 from US$ 12.47 billion in 2023. The market is expected to register a CAGR of 22.4% during 2023–2031.
The report includes growth prospects in light of current e-invoicing market trends and driving factors influencing the market growth.
E-Invoicing Market Analysis
The rising demand for digital solutions to combat tax evasion and financial fraud among government organizations and tax authorities is driving the growth in e-invoicing mandates in various countries. Various supportive initiatives taken by government organizations and associations, such as the European E-Invoicing Service Providers Association (EESPA), CEN, UN/CEFACT, OpenPEPPOL, and GS1, are playing a crucial role in driving the development of e-invoicing standards/frameworks/formats and adoption of e-invoicing across countries. In terms of e-invoicing adoption, Brazil, Chile, and Mexico are the market leaders, followed by countries such as Italy, which mandated e-invoicing in 2019. The successful implementation of e-invoicing in these countries and its benefits are driving other countries, such as Bolivia, France, Colombia, Guatemala, China, India, Kyrgyzstan, Uzbekistan, Vietnam, Croatia, Estonia, Serbia, and Portugal, to implement e-invoicing mandates.E-invoicing Market Overview
E-invoicing is a growing market with rising adoption in various segments such as business-to-business (B2B), business-to-customer (B2C), and business-to-government (B2G). E-invoicing exclusively refers to the electronic invoice exchange between buyers and suppliers. Various countries define e-invoicing differently based on the regulations and nature of businesses prevalent in specific countries. For the exchange of e-invoices, various models are being used across industries, such as supplier direct model, buyer direct model, SaaS/PaaS model, network model, four corner model, multi-cloud model, and hybrid cloud model. Organizations across the world either exchange e-invoices directly with their customers or use third-party service providers. The growing trend of digitalizing various documents for efficient processing and compliance requirements is boosting the transition from manual paper-based invoices to electronic invoices on a global scale.
Customize This Report To Suit Your Requirement
You will get customization on any report - free of charge - including parts of this report, or country-level analysis, Excel Data pack, as well as avail great offers and discounts for start-ups & universities
E-Invoicing Market: Strategic Insights
- Get Top Key Market Trends of this report.This FREE sample will include data analysis, ranging from market trends to estimates and forecasts.
E-Invoicing Market Drivers and Opportunities
Digital Transformation Across Industries to Favor Market
The global business environment is undergoing a profound shift as organizations increasingly leverage digital technologies to enhance productivity, streamline operations, and reduce costs. This digital evolution is not confined to large corporations; small and medium-sized enterprises (SMEs) are equally embracing a wide spectrum of technologies, including web-based platforms, cloud infrastructure, artificial intelligence (AI), Internet of Things (IoT), big data analytics, and predictive modeling. Digital transformation is rapidly becoming a strategic imperative, enabling organizations to not only automate core functions but also deliver improved customer experiences, make data-informed decisions, and generate new revenue streams. Governments around the world are playing a catalytic role in this evolution. Policy frameworks such as Digital India, the U.S. Digital Government Strategy, and Germany’s Digital Strategy 2025 are accelerating the digital adoption curve by investing in infrastructure, innovation, and skills development. These initiatives are fostering a more connected and technology-driven ecosystem, encouraging market players across industries to digitize their operations for increased efficiency and scalability. One of the critical domains undergoing rapid digitalization is the invoicing function. Traditionally, invoicing in B2B, B2C, and B2G transactions has been reliant on manual, paper-based processes that are both time-consuming and resource-intensive. Globally, billions of invoices are issued daily, yet only a small percentage are processed electronically. This reveals a considerable market gap and presents a strong growth trajectory for the e-invoicing segment. Manual invoicing is often prone to errors, delays, and inefficiencies, ultimately impacting business performance. In contrast, e-invoicing systems automate the generation, transmission, and reconciliation of invoices, yielding multiple operational and financial benefits. These include cost reduction, improved accuracy, faster payment cycles, enhanced compliance with tax regulations, and more effective cash flow management. Furthermore, the shift from paper to digital formats supports corporate sustainability objectives by reducing paper consumption and associated carbon footprints. Beyond cost savings, e-invoicing also enhances transparency and governance in financial workflows. By integrating seamlessly with enterprise resource planning (ERP) and accounting systems, businesses can gain real-time visibility into their payables and receivables, thereby improving strategic decision-making. For suppliers and buyers alike, this translates into streamlined interactions, reduced disputes, and improved working capital efficiency. As digital transformation continues to accelerate globally, e-invoicing is poised to become a foundational element in the digital finance ecosystem. Organizations that proactively invest in scalable and secure e-invoicing solutions are likely to gain a competitive edge in an increasingly automated and data-driven marketplace.Rise in Demand for Cloud-Based Solutions
Cloud computing is becoming the driving force for digital transformation across industries. The demand for cloud-based solutions across businesses is growing at an unprecedented rate owing to the advantages offered by these solutions over on-premise deployment. Major advantages of cloud-based solutions include easy deployment, interoperability, cost savings, high efficiency, and on-demand features. Services such as Infrastructure as a Service (IaaS) and Software as a Service (SaaS) are growing rapidly. However, the adoption of cloud-based solutions varies across geographies and businesses depending on factors such as regulatory environment and competitive scenarios. The demand for cloud-based solutions is high in small and medium enterprises owing to the cost benefits related to these solutions. Most large organizations are still using on-premise solutions as implementing new processes across large organizations and their networks is a complex task and requires changes in traditional work practices.E-Invoicing Market Report Segmentation Analysis
Key segments that contributed to the derivation of the e-invoicing market analysis are deployment, end user, application, and type.- By deployment model, the e-invoicing market is segmented into cloud and on-premise. In 2023, the cloud segment held a larger e-invoicing market share owing to advantages such as easy implementation, cost savings, and operational flexibility.
- Based on end user, the market is segmented into retail and e-commerce, government, IT and telecom, BFSI, and others. The government segment held the largest e-invoicing market share in 2023.
- Based on type, the e-invoicing market is segmented into PO invoices and non-PO invoices. In 2023, the non-PO invoices segment dominated the market with a larger market share and is expected to register a higher CAGR during the forecast period.
- Based on application, the e-invoicing market is categorized into B2B, B2C, and B2G. The B2G segment held the largest share of the global e-invoicing market, and the B2B segment is anticipated to be the fastest-growing segment over the forecast period.
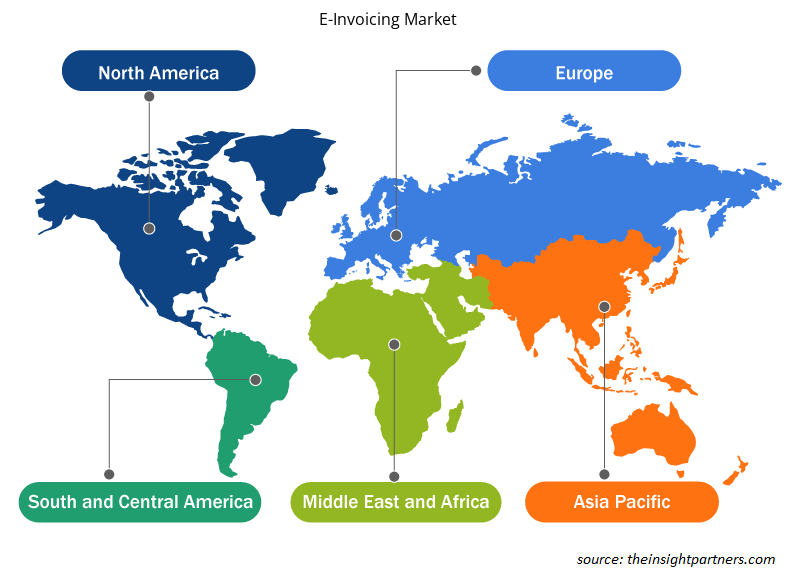
E-Invoicing Market Share Analysis by Geography
The e-invoicing market is segmented into five major regions—North America, Europe, Asia Pacific (APAC), the Middle East & Africa (MEA), and South and Central America. North America held the largest e-invoicing market share in 2023. In terms of market share, Europe, South and Central America, and APAC held second, third, and fourth place, respectively, in 2023. Europe is another crucial market for e-invoicing. Recently, Italy became the first country in Europe to mandate e-invoicing to combat tax fraud and tax evasion, as well as to increase the efficiency of the fiscal system. Other European countries are also expected to follow Italy and adopt e-invoicing, positively boosting the market.E-Invoicing Market Regional Insights
The regional trends and factors influencing the E-Invoicing Market throughout the forecast period have been thoroughly explained by the analysts at Insight Partners. This section also discusses E-Invoicing Market segments and geography across North America, Europe, Asia Pacific, Middle East and Africa, and South and Central America.
- Get the Regional Specific Data for E-Invoicing Market
E-Invoicing Market Report Scope
| Report Attribute | Details |
|---|---|
| Market size in 2023 | US$ 12.47 Billion |
| Market Size by 2031 | US$ 62.68 Billion |
| Global CAGR (2023 - 2031) | 22.4% |
| Historical Data | 2021-2022 |
| Forecast period | 2024-2031 |
| Segments Covered |
By Deployment
|
| Regions and Countries Covered | North America
|
| Market leaders and key company profiles |
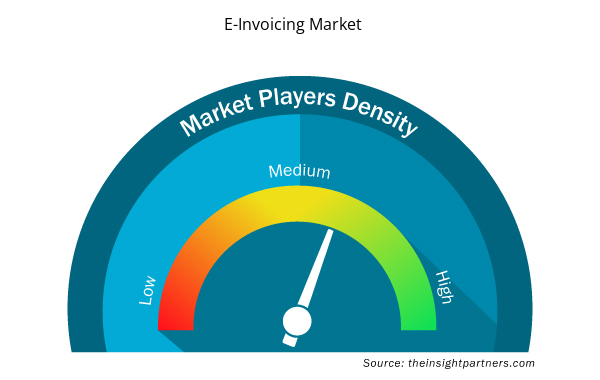
E-Invoicing Market Players Density: Understanding Its Impact on Business Dynamics
The E-Invoicing Market is growing rapidly, driven by increasing end-user demand due to factors such as evolving consumer preferences, technological advancements, and greater awareness of the product's benefits. As demand rises, businesses are expanding their offerings, innovating to meet consumer needs, and capitalizing on emerging trends, which further fuels market growth.
Market players density refers to the distribution of firms or companies operating within a particular market or industry. It indicates how many competitors (market players) are present in a given market space relative to its size or total market value.
Major Companies operating in the E-Invoicing Market are:
- Cegedim SA
- Sage Group Plc
- Comarch SA
- Nipendo Ltd
- Tradeshift
- Transcepta LLC
Disclaimer: The companies listed above are not ranked in any particular order.
- Get the E-Invoicing Market top key players overview
E-Invoicing Market News and Recent Developments
The e-invoicing market is evaluated by gathering qualitative and quantitative data post primary and secondary research, which includes important corporate publications, association data, and databases. The following is a list of developments in the market for e-invoicing:- In 2021, Coupa Software, one of the leaders in business spend management (BSM), announced that it had become an official member of the E-Invoice Promotion Association (EIPA), an organization that develops, demonstrates, and promotes standard specifications of electronic invoices. (Source: Coupa Software, Press Release)
- In 2024, Basware, a global leader in AP automation and invoice processing, announced major global expansion plans as bookings rose by 52% and recurring revenue growth accelerated year-over-year (YoY) in 2023. (Source: Sweco AB, Press Release)
- In 2023, Toyota Boshoku Asia signed a contract with Comarch for the implementation of e-invoicing in Thailand. Comarch will support Toyota Boshoku Asia in setting up an e-invoicing solution for preparing, delivering, and storing digital documents, with digital signatures for tax invoices and receipts complying with Thailand's Revenue Department conditions and requirements. (Source: Toyota Boshoku, Press Release)
E-Invoicing Market Report Coverage and Deliverables
The "E-Invoicing Market Size and Forecast (2022–2030)" provides a detailed analysis of the market covering the areas mentioned below:- E-invoicing market size and forecast at global, regional, and country levels for all the key market segments covered under the scope
- E-invoicing market dynamics such as drivers, restraints, and key opportunities
- Key future trends in the e-invoicing market
- Detailed PEST/Porter's Five Forces and SWOT analysis
- Global and regional market analysis covering key market trends, major players, regulations, and recent market developments
- Industry landscape and competition analysis covering market concentration, heat map analysis, prominent players, and recent developments in the e-invoicing market
- Detailed company profiles
- Historical Analysis (2 Years), Base Year, Forecast (7 Years) with CAGR
- PEST and SWOT Analysis
- Market Size Value / Volume - Global, Regional, Country
- Industry and Competitive Landscape
- Excel Dataset

Report Coverage
Revenue forecast, Company Analysis, Industry landscape, Growth factors, and Trends

Segment Covered
Type ; End User ; and Geography

Regional Scope
North America, Europe, Asia Pacific, Middle East & Africa, South & Central America

Country Scope
Argentina, Australia, Brazil, Canada, China, France, Germany, India, Italy, Japan, Mexico, Russian Federation, Saudi Arabia, South Africa, South Korea, United Arab Emirates, United Kingdom, United States
Frequently Asked Questions
What are the driving factors impacting the global e-invoicing market?
Digital transformation across industries, rise in e-invoicing related compliance requirements, and growth of e-commerce industry are the major factors that propel the e-invoicing market.
What is the incremental growth of the global e-invoicing market during the forecast period?
The incremental growth expected to be recorded for the global e-invoicing market during the forecast period is US$ 50.20 billion.
Which are the key players holding the major market share of the global e-invoicing market?
The key players holding majority shares in the global e-invoicing market are Basware Corporation, Cegedim SA, Comarch SA, Coupa Software Inc, International Business Machines Corp, and Nipendo Ltd.
What will be the market size of the global e-invoicing market by 2031?
The global e-invoicing market is expected to reach US$ 62.27 billion by 2031.
What is the estimated market size for the global e-invoicing market in 2023?
The global e-invoicing market was estimated to be US$ 12.47 billion in 2023 and is expected to grow at a CAGR of 22.4% during the forecast period 2023 - 2031.
What are the future trends of the global e-invoicing market?
Integration of blockchain in e-invoicing is anticipated to play a significant role in the global e-invoicing market in the coming years.
Trends and growth analysis reports related to Technology, Media and Telecommunications : READ MORE..
The List of Companies - E-Invoicing Market
- Cegedim SA
- Sage Group Plc
- Comarch SA
- Nipendo Ltd
- Tradeshift
- Transcepta LLC
- Basware Corporation
- Coupa Software Inc
- International Business Machines Corp
- SAP SE
 Get Free Sample For