
Graphing Calculator Market Size, Share & Trends by 2034
Coverage: By Application (Education, Engineering, Finance, Scientific Research), By End Use (Schools, Colleges, Universities, Corporate), By Type (Traditional Graphing Calculators, Smart Graphing Calculators, Online Graphing Calculators), By Distribution Channel (Online Retail, Specialty Stores, Department Stores), and Geography (North America, Europe, Asia Pacific, and South and Central America)
- Status : Data Released
- Report Code : TIPTE100000434
- Category : Electronics and Semiconductor
- No. of Pages : 150
- Available Report Formats :


- Last update date : June 11, 2026

2025 Market Size
US$ 1.39 Bn
Base year value
2034 Forecast
US$ 3.16 Bn
Projected by 2034
CAGR 2026-2034
9.51 %
Growth rate
Addressable Market
US$ 20.25 Bn
(2026-2034)
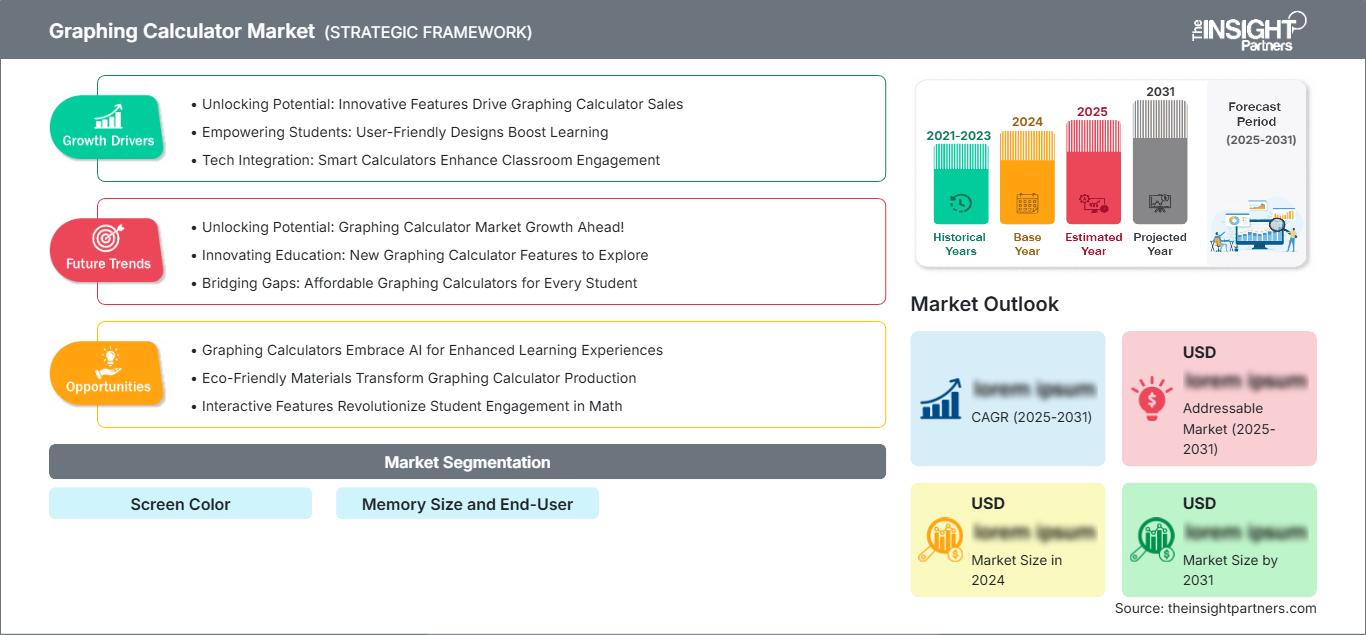
The global graphing calculator market size is projected to reach US$ 3.16 billion by 2034 from US$ 1.39 billion in 2025. The market is anticipated to register a CAGR of 9.51% during the forecast period 2026–2034.
Key market dynamics include a heightening global focus on STEM education, rising enrollment in higher education institutions, and the continued requirement of standardized testing boards for physical, non-internet-connected devices. Additionally, the market is expected to benefit from the growing integration of Python programming capabilities in handheld devices, the expansion of educational infrastructure in emerging economies, and the increasing inclusion of advanced color-display calculators in high-school and university-level mathematics curricula.
Graphing Calculator Market Analysis
The graphing calculator market analysis shows a shift toward high-performance computing handhelds as educators prioritize multi-functional tools that bridge the gap between abstract theory and visual representation. The market is diversifying into traditional high-school-led institutional and high-growth professional engineering segments. Strategic opportunities are emerging in software-hardware synchronization, where calculator-based laboratory systems allow for real-time data collection in physics and chemistry, offering a clear competitive advantage over basic scientific models. The market expansion depends on compatibility with international testing standards and battery efficiency for long-term classroom use. Competitive differentiation now stands out depending on hardware durability, user-interface intuitiveness, and the ability to run complex simulations or 3D graphing. This approach helps established manufacturers maintain premium pricing in a market with high barriers to entry regarding educational certifications.
Graphing Calculator Market Overview
Graphing calculators have evolved from niche engineering tools to mainstream educational essentials. The market includes CAS-enabled devices, touchscreen models, and Python-integrated calculators. Both global electronics giants and specialized educational technology firms compete in this market, using advanced chipsets and high-resolution backlit displays. Growing demand for interactive learning tools among tech-savvy students in North America and Europe has sustained the popularity of graphing calculators as a reliable offline computing solution. North America leads in revenue due to its standardized testing mandates and established one-calculator-per-student culture, while Asia-Pacific is advancing in technical education adoption and local manufacturing innovation. The US market is the most developed, driven by rigorous curriculum requirements and the broad availability of educational support resources. Competition among brands is fueling greater memory capacity and the inclusion of rechargeable lithium-ion batteries and wireless data transfer features.
Market Assessment and Insights
- Global market for Graphing Calculator was valued at US$ 1.39 Billion in 2025
- Annual market size is expected to reach US$ 3.16 Billion by 2034
- Total addressable market (TAM) during 2026-2034 is projected to reach approximately US$ 20.25 Billion
- Market is anticipated to register a CAGR of 9.51% during the forecast period
- The United States represents a key market, supported by Unlocking Potential: Innovative Features Drive Graphing Calculator Sales, Empowering Students: User-Friendly Designs Boost Learning, Tech Integration: Smart Calculators Enhance Classroom Engagement, as well as evolving industry dynamics
- Market analysis covers North America, Europe, Asia-Pacific, South and Central America, Middle East and Africa, with growth evaluated across the forecast period
- Market opportunities such as Graphing Calculators Embrace AI for Enhanced Learning Experiences, Eco-Friendly Materials Transform Graphing Calculator Production, Interactive Features Revolutionize Student Engagement in Math are expected to influence market dynamics and addressable market
- Report profiles industry participants, including Casio, Datex, Texas Instruments, HP, Guerrilla, Sharp, Antoble, NiceTQ, while analyzing competitive strategies and innovation developments
-
Source: The Insight Partners' analysis based on proprietary research, government publications, company annual reports, investor presentations, industry databases, and expert interviews.
● REPORT CUSTOMIZATION
Tailor This Report To Align With Your Specific Business Requirements
This report can be customized to align precisely with your business objectives, scope, and target markets. Customization options include tailored segmentation, geography, competitive analysis, and strategic insights to support informed decision-making.
Customize This Report →WHAT YOU CAN ADJUST
- ● Segmentations
- ● Geography
- ● Competitive Analysis
- ● Language Preferences
Graphing Calculator Market: Strategic Insights
-
Get Top Key Market Trends of this report.This FREE sample will include data analysis, ranging from market trends to estimates and forecasts.
Graphing Calculator Market Drivers and Opportunities
Market Drivers:
- Mandatory Use in Standardized Testing: Major examination boards require or permit graphing calculators while banning internet-enabled devices like smartphones. This regulatory environment creates a consistent replacement and upgrade cycle.
- Growth of STEM-Focused Curricula: The global emphasis on engineering and data science education has increased the need for tools that can perform complex regressions, matrix calculations, and statistical modeling, sustaining high demand for advanced graphing units.
- Technological Integration of Programming: The recent addition of Python and other coding languages into standard graphing calculators allows these devices to serve as introductory platforms for computer science, expanding their utility beyond pure mathematics.
Market Opportunities:
- Expansion into Vocational and Technical Training: Beyond traditional schools, graphing calculators offer significant opportunities in vocational training centers for electronics, construction, and aviation, where portable, rugged computing is required.
- Growth in Emerging APAC Educational Markets: Forming strategic partnerships between global manufacturers and regional ministries of education may facilitate access to high-margin market segments in China, India, and Southeast Asia as they modernize their secondary education systems.
- Diversification into Hybrid Software Solutions: There is a growing opportunity for producers to offer bundled hardware and software licenses, allowing students to use identical emulators on their laptops while maintaining the physical device for exam conditions.
Graphing Calculator Market Report Segmentation Analysis
The Graphing Calculator Market share is analyzed across various segments to provide a clearer understanding of its structure, growth potential, and emerging trends. Below is the standard segmentation approach used in most industry reports:
By Application:
- Education: The largest segment, driven by K-12 and higher education requirements for mathematics, statistics, and science courses.
- Engineering: A high-value niche where professionals and students use advanced CAS models for structural analysis and circuit design.
- Finance: Utilized for complex time-value-of-money calculations and statistical forecasting in specialized business environments.
- Scientific Research: Employed in laboratory settings for data visualization and immediate computational needs without the distraction of internet connectivity.
By End Use:
- Schools: Primary drivers for mid-range graphing models are often purchased in bulk for classroom sets or required via student supply lists.
- Colleges and Universities: A major market for high-end CAS and color-display units used in advanced calculus and engineering degrees.
- Corporate: Utilized by professional services, construction firms, and technical offices requiring dedicated, reliable calculation hardware.
By Type:
- Traditional Graphing Calculators: Standalone handheld units with standard tactile keys, valued for durability and compliance with strict exam regulations.
- Smart Graphing Calculators: Newer generation devices featuring touchscreens, high-speed processors, and advanced connectivity for data sharing and app installations.
- Online Graphing Calculators: Fast-growing digital platforms and emulators used for remote learning and interactive classroom presentations.
By Distribution Channel:
- Online Retail
- Specialty Stores
- Department Stores
By Geography:
- North America
- Europe
- Asia Pacific
- South & Central America
- Middle East & Africa
Graphing Calculator Market Report Scope
| Report Attribute | Details |
|---|---|
| Market size in 2025 | US$ 1.39 Billion |
| Market Size by 2034 | US$ 3.16 Billion |
| Global CAGR (2026 - 2034) | 9.51% |
| Historical Data | 2021-2024 |
| Forecast period | 2026-2034 |
| Segments Covered |
By Application
|
| Regions and Countries Covered |
North America
|
| Market leaders and key company profiles |
|
Graphing Calculator Market Players Density: Understanding Its Impact on Business Dynamics
The Graphing Calculator Market is growing rapidly, driven by increasing end-user demand due to factors such as evolving consumer preferences, technological advancements, and greater awareness of the product's benefits. As demand rises, businesses are expanding their offerings, innovating to meet consumer needs, and capitalizing on emerging trends, which further fuels market growth.
Graphing Calculator Market Share Analysis by Geography
Asia-Pacific is expected to grow fastest in the coming years. Emerging markets in South & Central America, the Middle East, and Africa also have many untapped opportunities for premium educational technology producers and specialized hardware manufacturers to expand.
The graphing calculator market is undergoing a significant transformation, moving from simple monochromatic screens to high-definition, color-display hubs for STEM learning. Below is a summary of market share and trends by region:
North America
- Market Share: Holds the largest share globally, anchored by deep integration of proprietary technology in the K-12 and collegiate systems.
- Key Drivers:
- Mandatory SAT and ACT requirements
- High disposable income for premium educational tools
- Presence of market leaders like Texas Instruments
- Trends: Scaling of rechargeable models and the successful adoption of Python-integrated handhelds to appeal to computer-science students.
Europe
- Market Share: A mature and stable segment with high demand for exam-compliant hardware in the UK, Germany, and France.
- Key Drivers:
- National curricula that emphasize graphical analysis
- Strict regulations on internet-enabled devices in exam halls
- Government support for STEM literacy
- Trends: A strategic shift toward open-source hardware designs and increasing focus on eco-friendly materials to meet European sustainability standards.
Asia-Pacific
- Market Share: The fastest-growing region, with major growth in China and India as they modernize secondary and tertiary education.
- Key Drivers:
- Massive student population seeking a competitive advantage in entrance exams
- Government-supported digital literacy initiatives
- Rising disposable incomes leading to a preference for premium global brands
- Trends: Heavy reliance on e-commerce platforms and institutional B2B contracts for bulk-buying programs in technical universities.
South and Central America
- Market Share: Emerging market with a growing private education in countries like Brazil and Chile.
- Key Drivers:
- Increasing awareness of the importance of interactive learning tools
- Modernization of small-scale school systems into high-tech educational centers
- Rising interest in International Baccalaureate programs
- Trends: Growth of boutique educational tech brands and the introduction of localized language support for graphing software.
Middle East and Africa
- Market Share: Developing market transitioning toward formalized commercial production and high-tech classroom environments.
- Key Drivers:
- Strategic investments in engineering fields requiring technical tools
- High demand for durable, battery-efficient products in varying climates
- Government-led food security and technical self-reliance programs
- Trends: Implementation of modern educational technologies to reduce import reliance and a focus on high-performance units for engineering students.
High Market Density and Competition
Competition is intensifying due to the presence of established leaders such as Texas Instruments, Casio, and HP. Regional innovators and niche players like NumWorks and Sharp, alongside software integration partners, also contribute to a diverse and rapidly expanding market landscape.
This competitive environment pushes vendors to differentiate through:
- Functional Branding: Positioning graphing calculators as superior professional tools by emphasizing higher processing speeds and 3D visualization.
- Product Bundling: Companies offer more than just hardware; they provide probiotic software updates, teacher training, and specialized exam-mode firmware.
- Supply Chain Control: Producers manage the entire chain, from custom processor design to retail distribution. This ensures quality, transparency, and meets rigorous academic standards.
- New Processing Technologies: Faster CPUs and improved LCD drivers help create high-quality displays used in advanced data analysis and programming applications.
Opportunities and Strategic Moves
- Partner with high-end retail channels and e-commerce platforms to tap into the surging demand for advanced educational tools in Asia-Pacific and North American markets.
- Incorporate sustainable manufacturing practices and recyclable components to appeal to environmentally conscious millennials and Gen Z consumers seeking ethical technology alternatives.
Major Companies operating in the Graphing Calculator Market are:
- Casio
- Datex
- Texas Instruments
- HP
- Guerrilla
- Sharp
- Antoble
- NiceTQ
Disclaimer: The companies listed above are not ranked in any particular order.
Graphing Calculator Market News and Recent Developments
- In April 2026, Texas Instruments Education Technology (TI), a division of the global semiconductor company, announced the launch of the TI-84 Evo Graphing Calculator, the latest and most powerful addition to the TI-84 series. Featuring a 3x faster processor, 50% more graphing space, and a redesigned keypad, the TI-84 Evo is a deliberate evolution of a platform educators and students have relied on for decades, built to meet the demands of today's math classroom and grow with students from middle school algebra all the way through college and future STEM careers.
- In April 2025, Casio Computer Co., Ltd. announced the release of the MS-20UC-J commemorative calculator models featuring traditional Japanese patterns to celebrate the 60th anniversary of Casio calculators. The new MS-20UC-J series is based on the user-friendly MS-20UC model, which is ideal for everyday use, with each design showcasing traditional Japanese patterns that have been cherished in Japan since ancient times.
Graphing Calculator Market Report Coverage and Deliverables
The Graphing Calculator Market Size and Forecast (2021–2034) report provides a detailed analysis of the market covering below areas:
- Graphing Calculator Market size and forecast at global, regional, and country levels for all the key market segments covered under the scope.
- Graphing Calculator Market trends, as well as market dynamics such as drivers, restraints, and key opportunities.
- Detailed PEST and SWOT analysis.
- Graphing Calculator Market analysis covering key market trends, global and regional framework, major players, regulations, and recent market developments.
- Industry landscape and competition analysis covering market concentration, heat map analysis, prominent players, and recent developments in the Graphing Calculator Market.
- Detailed company profiles.
Frequently Asked Questions

- Comprehensive Market Sizing and Forecast Analysis
- Detailed Segmentation Analysis
- In-Depth Market Dynamics Assessment
- Regional and Country-Level Insights
- Competitive Landscape and Company Benchmarking
- Strategic Business Intelligence
Recent Reports
Testimonials
The Insight Partners' SCADA System Market report is comprehensive, with valuable insights on current trends and future forecasts. The team was highly professional, responsive, and supportive throughout. We are very satisfied and highly recommend their services.
RAN KEDEM Partner, Reali Technologies LTDsI requested a report on a very specific software market and the team produced the report in a few days. The information was very relevant and well presented. I then requested some changes and additions to the report. The team was again very responsive and I got the final report in less than a week.
JEAN-HERVE JENN Chairman, Future AnalyticaWe worked with The Insight Partners for an important market study and forecast. They gave us clear insights into opportunities and risks, which helped shape our plans. Their research was easy to use and based on solid data. It helped us make smart, confident decisions. We highly recommend them.
PIYUSH NAGPAL Sr. Vice President, High Beam GlobalThe Insight Partners delivered insightful, well-structured market research with strong domain expertise. Their team was professional and responsive throughout. The user-friendly website made accessing industry reports seamless. We highly recommend them for reliable, high-quality research services
YUKIHIKO ADACHI CEO, Deep Blue, LLC.This is the first time I have purchased a market report from The Insight Partners.While I was unsure at first, I visited their web site and felt more comfortable to take the risk and purchase a market report.I am completely satisfied with the quality of the report and customer service. I had several questions and comments with the initial report, but after a couple of dialogs over email with their analyst I believe I have a report that I can use as input to our strategic planning process.Thank you so much for taking the extra time and making this a positive experience.I will definitely recommend your service to others and you will be my first call when we need further market data.
JOHN SUZUKI President and Chief Executive Officer, Board Director, BK TechnologiesI wish to appreciate your support and the professionalism you displayed in the course of attending to my request for information regarding to infectious disease IVD market in Nigeria. I appreciate your patience, your guidance, and the fact that you were willing to offer a discount, which eventually made it possible for us to close a deal. I look forward to engaging The Insight Partners in the future, all thanks to the impression you have created in me as a result of this first encounter.
DR CHIJIOKE ONYIA MANAGING DIRECTOR, PineCrest Healthcare Ltd.Reason to Buy
- Informed Decision-Making
- Understanding Market Dynamics
- Competitive Analysis
- Identifying Emerging Markets
- Customer Insights
- Market Forecasts
- Risk Mitigation
- Boosting Operational Efficiency
- Strategic Planning
- Investment Justification
- Tracking Industry Innovations
- Aligning with Regulatory Trends


