Non-Alcoholic Beverages Market Size, Share, and Analysis by 2028
Non-Alcoholic Beverages Market Forecast to 2028 - Analysis By Type [Carbonated Soft Drinks, Juices & Nectars (Sparkling Fruit Juices and Others), Bottled Water Dairy-Based Beverages, Dairy Alternative Beverages, RTD Tea & Coffee, Non-Alcoholic Beers, Malt Beverages, and Others], Packaging Type (Bottles, Cartons, Cans, and Pouches), Category (Sugar-Free and Conventional), and Distribution Channel (Supermarkets & Hypermarkets, Convenience Stores, Online Retail, and Others)
Historic Data: 2020-2021 | Base Year: 2022 | Forecast Period: 2023-2028- Report Date : Nov 2022
- Report Code : TIPRE00029575
- Category : Food and Beverages
- Status : Published
- Available Report Formats :


- No. of Pages : 254
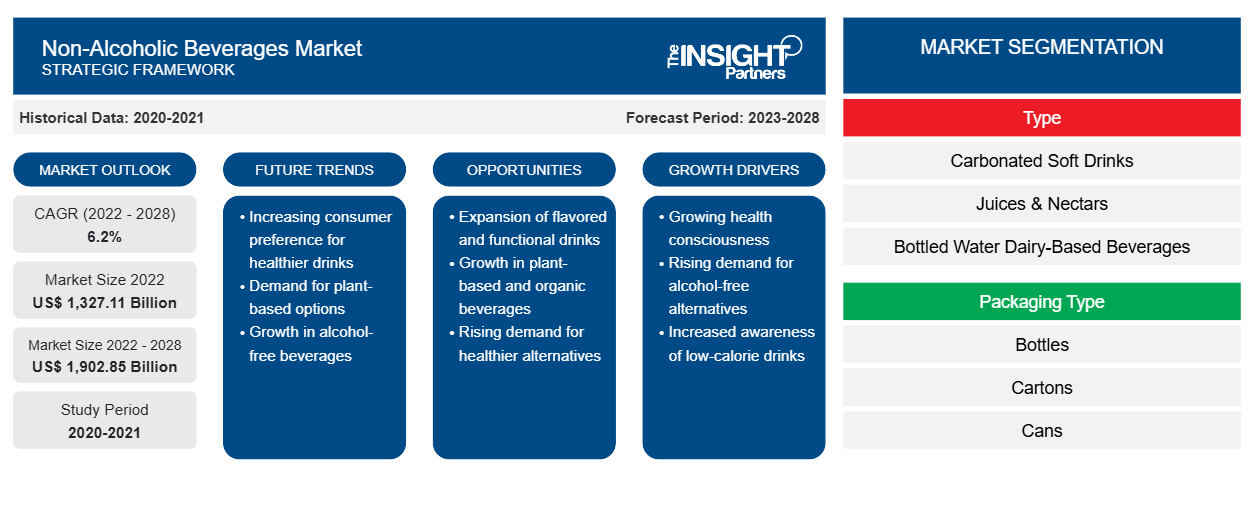
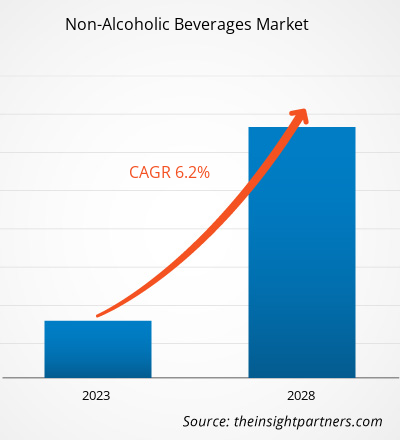
The non-alcoholic beverages market size is expected to grow from US$ 1,327.11 billion in 2022 to US$ 1,902.85 billion by 2028. It is estimated to grow at a CAGR of 6.2% from 2022 to 2028.
Carbonated soft drinks, bottled waters, juices & nectars, dairy-based and dairy alternative beverages, RTD tea and coffee, and energy drinks are the different types of non-alcoholic beverages available in the market. The sugar-free category is gaining significant traction among consumers due to the rise in health concerns and the high prevalence of obesity, diabetes, and heart diseases in various countries across the globe. Functional drinks and fortified beverages are witnessing high demand due to the growing focus on health and nutrition. Non-alcoholic malt beverages and premixes are widely consumed in Middle Eastern countries such as Saudi Arabia, Iran, and the UAE owing to the strict regulations on alcoholic beverage consumption and malt beverages getting halal certifications. This factor is fueling the growth of the non-alcoholic malt beverages segment in the global non-alcoholic beverages market.
In 2021, Asia Pacific held the largest revenue share of the global non-alcoholic beverages market. Major factors driving the market in Asia Pacific are increasing health awareness among consumers, high demand for alternative dairy beverages, and rising popularity of natural and organic fruit juices. In countries such as Japan and South Korea, the majority of the population is lactose intolerant. This factor is boosting the popularity of dairy alternative beverages in the countries. Further, the Asia Pacific non-alcoholic beverages market is lucrative owing to the presence of a potential consumer base, strong demand for healthy beverages, and extensive retail landscape. The NOLO (no/low alcoholic beers, spirits, and cocktails) category is experiencing a significant demand in Asia Pacific due to changing consumption habits and rising consumer focus on healthy eating and drinking. Therefore, many emerging companies that offer non-alcoholic or low-alcoholic beers and spirits are expanding their footprints across Asia Pacific. For instance, Sipfree, an online shopping platform for non-alcoholic beers, spirits, and wines, was launched in Hong Kong in January 2020, and despite the COVID-19 outbreak, the sales of Sipfree increased considerably. Such expansions are expected to open lucrative opportunities in the Asia Pacific non-alcoholic beverages market growth over the forecast period.
Customize This Report To Suit Your Requirement
Get FREE CUSTOMIZATIONNon-Alcoholic Beverages Market: Strategic Insights
-
Get Top Key Market Trends of this report.This FREE sample will include data analysis, ranging from market trends to estimates and forecasts.
Impact of COVID-19 Pandemic on Non-Alcoholic Beverages Market
In the pre-pandemic period, the non-alcoholic beverages market was mainly driven by high demand for healthy drinks and on-the-go beverages. However, due to the outbreak of COVID-19 in 2020, many industries faced unprecedented challenges. The food and beverage manufacturers witnessed a slow growth in the initial phase of the pandemic due to the shutdown of manufacturing units and supply chain disruptions. However, a shift in consumer lifestyle, a rise in preference for healthy dietary practices, and an increase in the health-conscious population have substantially promoted the demand for non-alcoholic beverages. The demand for plant-based beverages such as soy, almond, and coconut milk increased two-fold after the pandemic, as consumers believe that plant-based beverages offer more nutritional value than conventional ones. According to the Mintel report published in June 2020, 25% of the surveyed consumers in the UK agreed that a vegan diet seemed appealing due to the pandemic. These factors had a positive impact on the non-alcoholic beverages market growth.
The health and wellness trends were triggered after the COVID-19 outbreak. Consumers are engaging in various fitness activities such as yoga, jogging, and cycling to stay healthy. This factor is expected to provide the strong potential to the non-alcoholic beverages market, especially in the energy and sports drinks space, in the coming years.
Market Insights
Surging Adoption of Sports Drinks to Drive Non-Alcoholic Beverages Market
Nutrition plays a significant role in improving sports performance. Athletes and sportspersons must follow adequate nutrition to meet their daily energy and nutrients demand. Along with professional athletes and sportspersons, many people are engaged in daily physical activity to maintain their overall health. The number of fitness enthusiasts increased in recent years due to increased health and wellness concerns. Sports drinks replenish the level of electrolytes, water, and energy lost during exercise and physical activities. These drinks typically contain carbohydrates, potassium, sodium, magnesium, and calcium that serve to rehydrate, replenish glycogen stores, and delay fatigue after exercise. The rising health and fitness concerns and an increasing number of sports enthusiasts are the key factors driving the sales of sports drinks globally. Thus, the rising adoption of sports drinks is significantly driving the non-alcoholic beverages market.
Type Insights
Based on type, the global non-alcoholic beverages market has been segmented into carbonated soft drinks, bottled waters, juices & nectars, dairy-based beverages, dairy alternative beverages, RTD tea & coffee, non-alcoholic beers, malt beverages, and others. The juices & nectars segment is further subsegmented into sparkling fruit juices and others. The carbonated soft drinks segment held the largest share of the global non-alcoholic beverages market in 2021, and the dairy alternative beverages segment is expected to grow at the fastest CAGR over the forecast period. Carbonated soft drinks are fizzy non-alcoholic beverages made from clean water, sugar, natural sweeteners or sugar alternatives (in diet drinks), caffeine, artificial flavoring ingredients, fruit juice concentrations, preservatives, and coloring additives. Sprite, Coca-Cola, Mountain Dew, and Monster are some of the well-known soft drink brands worldwide. Carbonated soft drinks are widely available across convenience stores, supermarkets and hypermarkets, vending machines, movie theatres, soda stores, and online retail stores. Changing lifestyles of consumers, rising disposable income, and increasing demand for convenience food and beverages are driving the market for the carbonated soft drinks segment.
Category Insights
Based on category, the global non-alcoholic beverages market has been segmented into sugar-free and conventional. The conventional segment held a larger market share in 2021. The rising prevalence of obesity, diabetes, high blood pressure, and cardiovascular diseases drives the demand for sugar-free drinks. According to the International Federation of Diabetes, approximately 537 million people worldwide had diabetes in 2021. Many beverage manufacturers are proactively developing products with natural, low-calorie sweeteners to meet the rising demand for sugar-free beverages. This factor is driving the market for the segment.
Non-Alcoholic Beverages Market Report Scope
| Report Attribute | Details |
|---|---|
| Market size in 2022 | US$ 1,327.11 Billion |
| Market Size by 2028 | US$ 1,902.85 Billion |
| Global CAGR (2022 - 2028) | 6.2% |
| Historical Data | 2020-2021 |
| Forecast period | 2023-2028 |
| Segments Covered |
By Type
|
| Regions and Countries Covered |
North America
|
| Market leaders and key company profiles |
|
Non-Alcoholic Beverages Market Players Density: Understanding Its Impact on Business Dynamics
The Non-Alcoholic Beverages Market is growing rapidly, driven by increasing end-user demand due to factors such as evolving consumer preferences, technological advancements, and greater awareness of the product's benefits. As demand rises, businesses are expanding their offerings, innovating to meet consumer needs, and capitalizing on emerging trends, which further fuels market growth.
Key players operating in the global non-alcoholic beverages market include The Coca Cola Company, PepsiCo, Nestle, Red Bull, Suntory Holdings Limited, Danone S.A., Califia Farms LLC, Keurig Dr Pepper Inc, Asahi Group Holdings Limited, Bolthouse Farms Inc., Heineken NV, Coolberg Beverages Pvt Ltd, Goya Foods Inc, Anheuser-Busch InBev NV, and Carlsberg AS. Players operating in the global non-alcoholic beverages market are focusing on providing organic, GMO-free, plant-based, and gluten-free products with new flavors to meet the changing consumer requirements. For instance, in 2019, Coca-Cola Europacific Partners launched two sparkling juices to its Honest Organic Lemonade range. The product is manufactured from organic fruit juice and sugar, whereas it does not contain sweeteners or artificial flavors. Such innovative products are expected to gain immense consumer traction, driving the non-alcoholic beverages market growth.
Report Spotlights
- Progressive industry trends in the non-alcoholic beverages market to help players develop effective long-term strategies
- Business growth strategies adopted by developed and developing markets
- Quantitative analysis of the non-alcoholic beverages market from 2020 to 2028
- Estimation of global demand for non-alcoholic beverages
- Porter’s Five Forces analysis to illustrate the efficacy of buyers and suppliers operating in the industry
- Recent developments to understand the competitive market scenario
- Market trends and outlook, as well as factors driving and restraining the growth of the non-alcoholic beverages market
- Assistance in the decision-making process by highlighting market strategies that underpin commercial interest, leading to the market growth
- The size of the non-alcoholic beverages market at various nodes
- Detailed overview and segmentation of the market, as well as the non-alcoholic beverages industry dynamics
- Size of the non-alcoholic beverages market in various regions with promising growth opportunities
Frequently Asked Questions

- Historical Analysis (2 Years), Base Year, Forecast (7 Years) with CAGR
- PEST and SWOT Analysis
- Market Size Value / Volume - Global, Regional, Country
- Industry and Competitive Landscape
- Excel Dataset
Recent Reports
Testimonials
The Insight Partners' SCADA System Market report is comprehensive, with valuable insights on current trends and future forecasts. The team was highly professional, responsive, and supportive throughout. We are very satisfied and highly recommend their services.
RAN KEDEM Partner, Reali Technologies LTDsI requested a report on a very specific software market and the team produced the report in a few days. The information was very relevant and well presented. I then requested some changes and additions to the report. The team was again very responsive and I got the final report in less than a week.
JEAN-HERVE JENN Chairman, Future AnalyticaWe worked with The Insight Partners for an important market study and forecast. They gave us clear insights into opportunities and risks, which helped shape our plans. Their research was easy to use and based on solid data. It helped us make smart, confident decisions. We highly recommend them.
PIYUSH NAGPAL Sr. Vice President, High Beam GlobalThe Insight Partners delivered insightful, well-structured market research with strong domain expertise. Their team was professional and responsive throughout. The user-friendly website made accessing industry reports seamless. We highly recommend them for reliable, high-quality research services
YUKIHIKO ADACHI CEO, Deep Blue, LLC.This is the first time I have purchased a market report from The Insight Partners.While I was unsure at first, I visited their web site and felt more comfortable to take the risk and purchase a market report.I am completely satisfied with the quality of the report and customer service. I had several questions and comments with the initial report, but after a couple of dialogs over email with their analyst I believe I have a report that I can use as input to our strategic planning process.Thank you so much for taking the extra time and making this a positive experience.I will definitely recommend your service to others and you will be my first call when we need further market data.
JOHN SUZUKI President and Chief Executive Officer, Board Director, BK TechnologiesI wish to appreciate your support and the professionalism you displayed in the course of attending to my request for information regarding to infectious disease IVD market in Nigeria. I appreciate your patience, your guidance, and the fact that you were willing to offer a discount, which eventually made it possible for us to close a deal. I look forward to engaging The Insight Partners in the future, all thanks to the impression you have created in me as a result of this first encounter.
DR CHIJIOKE ONYIA MANAGING DIRECTOR, PineCrest Healthcare Ltd.Reason to Buy
- Informed Decision-Making
- Understanding Market Dynamics
- Competitive Analysis
- Identifying Emerging Markets
- Customer Insights
- Market Forecasts
- Risk Mitigation
- Boosting Operational Efficiency
- Strategic Planning
- Investment Justification
- Tracking Industry Innovations
- Aligning with Regulatory Trends


 Get Free Sample For