
Sports Technology Market Growth, Analysis, and Forecast by 2031
Coverage: By Component (Hardware, Software, and Services) and Technology (Tracking System/Hawk-Eye Technology, Broadcast Technology, Virtual Reality, Wearable Technology, and Other Technologies), and Geography
- Status : Data Released
- Report Code : TIPRE00004095
- Category : Electronics and Semiconductor
- No. of Pages : 150
- Available Report Formats :


- Last update date : February 15, 2025

2023 Market Size
US$ 39.73 Bn
Base year value
2031 Forecast
US$ 112.39 Bn
Projected by 2031
CAGR 2024-2031
13.9 %
Growth rate
Addressable Market
US$ 596.63 Bn
(2024-2031)
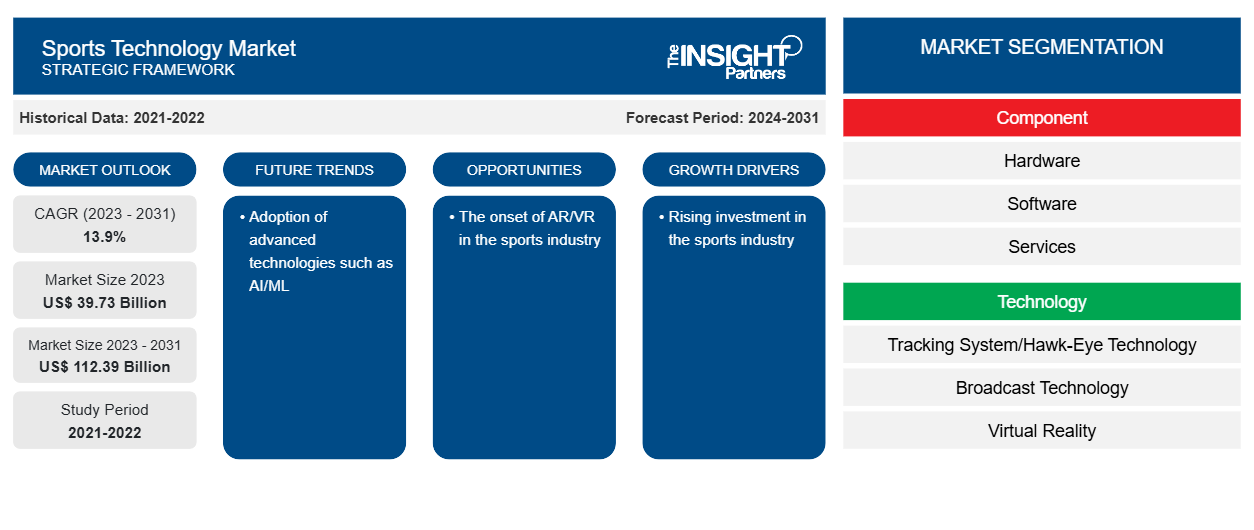
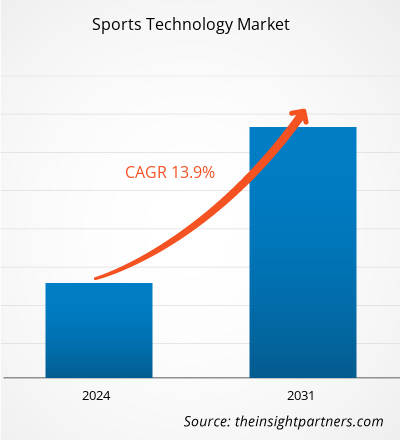
The sports technology market size is projected to reach US$ 112.39 billion by 2031 from US$ 39.73 billion in 2023. The market is expected to register a CAGR of 13.9% in 2023–2031. Investment in the sports industries and inclination towards data-driven decision-making are likely to remain key sports technology market trends.
Sports Technology Market Analysis
The sports technology market growth in demand for technology-based services in the sports industry can be attributed to the digital transformation of arenas and stadiums, coupled with the increased focus on audience participation and entertainment activities. The market is predicted to grow significantly during the forecast period due to the rise in demand for data-driven decision-making and operations, as well as the number of sporting events. The sports technology market is anticipated to continue expanding due to the growing use of social media, Internet of Things (IoT), and data analytics.
Sports Technology Market Overview
Sporting technologies are man-made methods developed to reach human interests or goals relating to a particular sport. Technology in sports refers to the technical means by which athletes attempt to enhance their training and competitive environment in order to enhance their overall athletic performance.
Market Research Highlights
- Global market for Sports Technology was valued at US$ 39.73 Billion in 2023
- Annual market size is expected to reach US$ 112.39 Billion by 2031
- Total addressable market (TAM) during 2024-2031 is projected to reach approximately US$ 596.63 Billion
- Market is anticipated to register a CAGR of 13.9% during the forecast period
- The United States represents a key market, supported by Rising investment in the sports industry, as well as evolving industry dynamics
- Market analysis covers North America, Europe, Asia-Pacific, South and Central America, Middle East and Africa, with growth evaluated across the forecast period
- Market opportunities such as The onset of AR/VR in the sports industry are expected to influence market dynamics and addressable market
- Report profiles industry participants, including Catapult, STATSports, Fitbit, Samsung, Xiaomi, Oracle, Huawei, Panasonic, NEC Corporation, COROS, while analyzing competitive strategies and innovation developments
● REPORT CUSTOMIZATION
Tailor This Report To Align With Your Specific Business Requirements
This report can be customized to align precisely with your business objectives, scope, and target markets. Customization options include tailored segmentation, geography, competitive analysis, and strategic insights to support informed decision-making.
Customize This Report →WHAT YOU CAN ADJUST
- ● Segmentations
- ● Geography
- ● Competitive Analysis
- ● Language Preferences
Sports Technology Market: Strategic Insights
-
Get Top Key Market Trends of this report.This FREE sample will include data analysis, ranging from market trends to estimates and forecasts.
Sports Technology Market Drivers and Opportunities
Rising investment in the sports industry to Favor Market
The sports technology market has grown in recent years as more organizations invest in adopting cutting-edge technologies for tracking player performance and engaging fans. In addition, the government supports the sports industry with investments and partnership activities, which leads to the adoption of technologies in sports. Some of the instances are mentioned below:
- In February 2024, the Biden-Harris Administration announced a new partnership with major sports leagues and players associations to boost physical activity and increase nutrition programming across the country.
- In India, under the National Investment Pipeline, capital expenditure of US$ 1.1 billion (FY20-FY25) has been earmarked for developing sports infrastructure in the country.
Adoption of advanced technologies such as AI/ML – An Opportunity in the Sports Technology Market
The mounting adoption of artificial intelligence (AI)/ machine learning (ML) technology has created significant opportunities in the sports technology market. AI/ML technologies are used to analyze player performance data to assist coaches and trainers in identifying areas for improvement. For example, AI-powered cameras can track and analyze players' movements, accuracy, speed, and other performance metrics. This information can then be used to develop personalized training plans for players looking to improve their skills. Thus, industry leaders are focused on bringing AI technology into the sports industry, which will fuel the sports technology market in the coming years. In April 2024, The International Olympic Committee (IOC) launched the Olympic AI Agenda, setting out the envisioned impact that Artificial Intelligence (AI) can deliver for sports and how the IOC intends to lead the global implementation of AI within sports.
Sports Technology Market Report Segmentation Analysis
Key segments that contributed to the derivation of the sports technology market analysis are component and technology.
- Based on the components, the market is segmented into hardware, software, and services. The hardware segment held a larger market share in 2023.
- By technology, the market is segmented into tracking system/hawk-eye technology, broadcast technology, virtual reality, wearable technology, and other technologies. The broadcast technology segment held a larger market share in 2023.
Sports Technology Market Share Analysis by Geography
The geographic scope of the sports technology market report is mainly divided into five regions: North America, Asia Pacific, Europe, Middle East & Africa, and South America/South & Central America.
In terms of revenue, North America accounted for the largest sports technology market share in 2023. North America is an early adopter of technological solutions which leads to its soaring market share. Asia Pacific is expected to grow with the highest CAGR. The market growth in APAC is attributed to the presence of a larger number of sports technology market players.
Sports Technology Market Report Scope
| Report Attribute | Details |
|---|---|
| Market size in 2023 | US$ 39.73 Billion |
| Market Size by 2031 | US$ 112.39 Billion |
| Global CAGR (2023 - 2031) | 13.9% |
| Historical Data | 2021-2022 |
| Forecast period | 2024-2031 |
| Segments Covered |
By Component
|
| Regions and Countries Covered |
North America
|
| Market leaders and key company profiles |
|
Sports Technology Market Players Density: Understanding Its Impact on Business Dynamics
The Sports Technology Market is growing rapidly, driven by increasing end-user demand due to factors such as evolving consumer preferences, technological advancements, and greater awareness of the product's benefits. As demand rises, businesses are expanding their offerings, innovating to meet consumer needs, and capitalizing on emerging trends, which further fuels market growth.
Sports Technology Market News and Recent Developments
The Sports Technology Marketis evaluated by gathering qualitative and quantitative data post primary and secondary research, which includes important corporate publications, association data, and databases. The following is a list of developments in the market:
- In November 2023, Tech Mahindra, a leading provider of digital transformation, consulting, and business re-engineering services and solutions, announced it had collaborated with Amazon Web Services (AWS) to build a sports cloud platform. The offering focuses on building next-generation digital capabilities for sports organizations and delivering immersive and personalized experiences to sporting enthusiasts worldwide. The sports cloud offering is the result of a Strategic Collaboration Agreement (SCA) signed between the two organizations in September 2023, with a shared vision to bring the sports institutions closer to the fans and the fans closer to the action. The SCA supports ease of access for Tech Mahindra to AWS resources and services and allows both entities to participate in joint go-to-market initiatives and drive business growth. (Source: Tech Mahindra, Press Release, 2023)
- In March 2024, Atos announced the plan to open a pioneering Sports Technology Centre of Excellence within a newly established Atos MENA HQ in the second quarter of 2024 in Riyadh, Saudi Arabia. Announced at LEAP 2024, the Centre of Excellence will leverage Atos’ global track record in providing best-in-class IT services and solutions to global sporting events. The Centre will develop cutting-edge technology applications to benefit athletes, fans, and the sports movement in Saudi Arabia. (Source: Atos, Press Release, 2024)
Sports Technology Market Report Coverage and Deliverables
The “Sports Technology Market Size and Forecast (2021–2031)” report provides a detailed analysis of the market covering below areas:
- Market size and forecast at global, regional, and country levels for all the key market segments covered under the scope
- Market dynamics such as drivers, restraints, and key opportunities
- Key future trends
- Detailed PEST/Porter’s Five Forces and SWOT analysis
- Global and regional market analysis covering key market trends, major players, regulations, and recent market developments
- Industry landscape and competition analysis covering market concentration, heat map analysis, prominent players, and recent developments
- Detailed company profiles
Frequently Asked Questions

- Comprehensive Market Sizing and Forecast Analysis
- Detailed Segmentation Analysis
- In-Depth Market Dynamics Assessment
- Regional and Country-Level Insights
- Competitive Landscape and Company Benchmarking
- Strategic Business Intelligence
Recent Reports
Testimonials
The Insight Partners' SCADA System Market report is comprehensive, with valuable insights on current trends and future forecasts. The team was highly professional, responsive, and supportive throughout. We are very satisfied and highly recommend their services.
RAN KEDEM Partner, Reali Technologies LTDsI requested a report on a very specific software market and the team produced the report in a few days. The information was very relevant and well presented. I then requested some changes and additions to the report. The team was again very responsive and I got the final report in less than a week.
JEAN-HERVE JENN Chairman, Future AnalyticaWe worked with The Insight Partners for an important market study and forecast. They gave us clear insights into opportunities and risks, which helped shape our plans. Their research was easy to use and based on solid data. It helped us make smart, confident decisions. We highly recommend them.
PIYUSH NAGPAL Sr. Vice President, High Beam GlobalThe Insight Partners delivered insightful, well-structured market research with strong domain expertise. Their team was professional and responsive throughout. The user-friendly website made accessing industry reports seamless. We highly recommend them for reliable, high-quality research services
YUKIHIKO ADACHI CEO, Deep Blue, LLC.This is the first time I have purchased a market report from The Insight Partners.While I was unsure at first, I visited their web site and felt more comfortable to take the risk and purchase a market report.I am completely satisfied with the quality of the report and customer service. I had several questions and comments with the initial report, but after a couple of dialogs over email with their analyst I believe I have a report that I can use as input to our strategic planning process.Thank you so much for taking the extra time and making this a positive experience.I will definitely recommend your service to others and you will be my first call when we need further market data.
JOHN SUZUKI President and Chief Executive Officer, Board Director, BK TechnologiesI wish to appreciate your support and the professionalism you displayed in the course of attending to my request for information regarding to infectious disease IVD market in Nigeria. I appreciate your patience, your guidance, and the fact that you were willing to offer a discount, which eventually made it possible for us to close a deal. I look forward to engaging The Insight Partners in the future, all thanks to the impression you have created in me as a result of this first encounter.
DR CHIJIOKE ONYIA MANAGING DIRECTOR, PineCrest Healthcare Ltd.Reason to Buy
- Informed Decision-Making
- Understanding Market Dynamics
- Competitive Analysis
- Identifying Emerging Markets
- Customer Insights
- Market Forecasts
- Risk Mitigation
- Boosting Operational Efficiency
- Strategic Planning
- Investment Justification
- Tracking Industry Innovations
- Aligning with Regulatory Trends


