Air Barrier Market Analysis and Opportunities by 2028
Air Barrier Market Forecast to 2028 - Analysis By Category (Coating and Membrane), Type (Vapor Permeable and Vapor Impermeable), and Application (Residential, Commercial, and Industrial)
- Status : Published
- Report Code : TIPRE00009218
- Category : Chemicals and Materials
- No. of Pages : 150
- Available Report Formats :


[Research Report] The air barrier market size was valued at US$ 15,924.68 million in 2022; It is expected to grow at a CAGR of 4.5% from 2022 to 2028.
Air barrier is a material that is used to control airflow in building enclosures. These systems completely enclose the air within a building. The physical properties that distinguish air barriers from other materials are the ability to resist air flow and pressure. Air barriers can be located anywhere in the building enclosure at the exterior surface, interior surface, or at any location in between. Interior air barriers in heating climates help control the exfiltration of the interior, whereas exterior air barriers control the infiltration of exterior air and prevent wind-washing through insulation.
Impact of COVID-19 Pandemic on Air Barrier Market
Before the COVID-19 pandemic, the air barrier market across the globe was mainly driven by their increasing use in residential, commercial, and industrial construction sectors. However, in 2020, various industries had to slow down their operations due to disruptions in value chains caused by the shutdown of national and international boundaries. The COVID-19 pandemic adversely affected economies and industries due to lockdowns, travel bans, and business shutdowns. The COVID-19 pandemic caused supply chain disruptions in key raw materials and hampered manufacturing processes due to restrictions imposed by government authorities. The COVID-19 pandemic brought unprecedented impacts on the construction industry, negatively impacting the air barrier market growth. Moreover, material required in the construction industry has seen price inflation due to supply chain disruption, increased labor costs, and high demand.
However, the market is reviving on account of significant measures taken by the governments of various countries. The construction industry is also overcoming the challenges of supply chain disruptions of their raw materials. The resumption of construction activities globally has created a demand for air barriers.
Customize Research To Suit Your Requirement
We can optimize and tailor the analysis and scope which is unmet through our standard offerings. This flexibility will help you gain the exact information needed for your business planning and decision making.
Air Barrier Market: Strategic Insights
Market Size Value in US$ 15,924.68 Million in 2022 Market Size Value by US$ 20,752.35 Million by 2028 Growth rate CAGR of 4.5% from 2022 to 2028 Forecast Period 2022-2028 Base Year 2022

Shejal
Have a question?
Shejal will walk you through a 15-minute call to present the report’s content and answer all queries if you have any.
 Speak to Analyst
Customize Research To Suit Your Requirement
We can optimize and tailor the analysis and scope which is unmet through our standard offerings. This flexibility will help you gain the exact information needed for your business planning and decision making.
Air Barrier Market: Strategic Insights
| Market Size Value in | US$ 15,924.68 Million in 2022 |
| Market Size Value by | US$ 20,752.35 Million by 2028 |
| Growth rate | CAGR of 4.5% from 2022 to 2028 |
| Forecast Period | 2022-2028 |
| Base Year | 2022 |
Shejal
Have a question?
Shejal will walk you through a 15-minute call to present the report’s content and answer all queries if you have any.
Speak to Analyst
Market Insights
Various Advantages of Using Air Barriers
Air barrier systems help prevent the loss of conditioned air. They also help keep out pollutants such as suspended particulates, dust, allergens, insects, odors, and noise. Mold commonly occurs in buildings where moist air accumulates on vulnerable wall components, including insulation, exterior sheathing, or interior wall boards. This may adversely impact indoor air quality and occupant health. Moreover, air barriers help in energy savings. Energy savings can translate into significant cost savings. Further, air barriers can increase the value of commercial buildings by reducing operating costs. Hence, various advantages of using air barriers translate into higher adoption in residential, commercial, and industrial sectors, thereby driving its market.
Category Insights
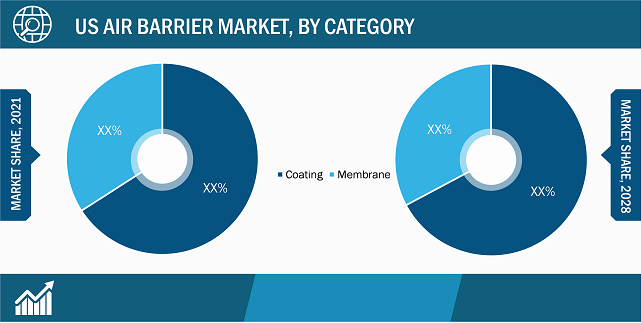
Based on category, the air barrier market is segmented into coating and membrane. The coating segment held a larger share of the air barrier market in 2021. The air barrier coating is sprayed or rolled onto the wall substrate. It helps save labor costs during installation. The air barriers are easily used for complex substrate geometry. They are efficient at adhering to and waterproofing various wall conditions.
Type Insights
Based on type, the air barrier market is segmented into vapor permeable and vapor impermeable. The vapor impermeable segment held a larger share of the air barrier market in 2021. Vapor-impermeable air barriers are designed to block moisture vapor and air while allowing virtually no passage of water vapor through the material. These are vital factors fueling the demand for vapor-impermeable air barriers.
The key players operating in the market include BASF SE, Dow Inc, 3M, W. R. Meadows Inc, GCP Applied Technologies Inc, CertainTeed LLC, Tamarack Materials Inc, VaproShield LLC, TK Products Construction Coating, Henry Co, Carlisle Companies Inc, and General Electric Co. Players operating in the market are focusing on providing high-quality products to fulfill customer demand. They are also focusing on strategies such as investments in research and development activities and new product launches.
Air Barrier Market Report Scope
Report Spotlights
- Progressive industry trends in the air barrier market to help players develop effective long-term strategies
- Business growth strategies adopted by developed and developing markets
- Quantitative analysis of the air barrier market from 2020 to 2028
- Estimation of the demand for air barriers
- PEST analysis to illustrate the efficacy of buyers and suppliers operating in the industry
- Recent developments to understand the competitive market scenario
- Market trends and outlook, as well as factors driving and restraining the air barrier market growth
- Assistance in the decision-making process by highlighting market strategies that underpin commercial interest, leading to the market growth
- The air barrier market size at various nodes
- Detailed overview and segmentation of the market, and the chemicals & materials industry dynamics
- The air barrier market size in various regions with promising growth opportunities
Based on category, the air barrier market is segmented into coating and membrane. In terms of type, the market is segmented into vapor permeable and vapor impermeable. Based on application, the market is segmented into residential, commercial, and industrial.
Company Profiles
- BASF SE
- Dow Inc
- 3M
- W. R. Meadows Inc
- GCP Applied Technologies Inc
- CertainTeed LLC
- Tamarack Materials Inc
- VaproShield LLC
- TK Products Construction Coating
- Henry Co
- Carlisle Companies Inc
- General Electric Co.

Report Coverage
Revenue forecast, Company Analysis, Industry landscape, Growth factors, and Trends

Segment Covered
Category, Type, and Application

Regional Scope
North America, Europe, Asia Pacific, Middle East & Africa, South & Central America

Country Scope
Argentina, Australia, Brazil, Canada, China, France, Germany, India, Italy, Japan, Mexico, Russian Federation, Saudi Arabia, South Africa, South Korea, United Arab Emirates, United Kingdom, United States
Frequently Asked Questions
Based on application, residential is the fastest-growing segment.
Increasing advantages of using air barriers for various applications and the growth of the residential construction sector are some of the key driving factors for the air barriers market.
Asia Pacific accounted for the largest share of the global air barrier market owing to the presence of a strong industrial base that is making this region the workshop of the world. As regional pollution increases, air barriers will become essential in these areas.
Based on the type, the vapor impermeable segment accounted for the largest revenue share owing to its property of blocking moisture vapor and air while allowing virtually no passage of water vapor through the material.
Manufacturers are making significant investments in research & development, partnerships, and collaborations to launch innovative products to tap into emerging market opportunities.
The major players operating in the global air barrier market are Cargill, Incorporated; Tate & Lyle PLC; AGRANA Beteiligungs-AG; Manildra Group; Roquette Frères; Sinofi Ingredients; Tokai Denpun Co., Ltd.; Sanwa Starch Co., Ltd.; New Zealand Starch Limited; and SAMYANG CORPORATION among few others.
1. Introduction
1.1 Study Scope
1.2 The Insight Partners Research Report Guidance
1.3 Market Segmentation
1.3.1 Air Barrier Market, by Category
1.3.2 Air Barrier Market, by Type
1.3.3 Air Barrier Market, by Application
1.3.4 Air Barrier Market, by Geography
2. Key Takeaways
3. Research Methodology
3.1 Scope of the Study
3.2 Research Methodology
3.2.1 Data Collection:
3.2.2 Primary Interviews:
3.2.3 Hypothesis formulation:
3.2.4 Macro-economic factor analysis:
3.2.5 Developing base number:
3.2.6 Data Triangulation:
3.2.7 Country level data:
4. Air Barrier Market Landscape
4.1 Market Overview
4.2. PORTER’S FIVE FORCES ANALYSIS
4.2.1 Bargaining Power of Buyers
4.2.2 Bargaining Power of Suppliers
4.2.3 Threat to Substitute
4.2.4 Threat to New Entrants
4.2.5 Competitive Rivalry
4.3. EXPERT OPINIONS
4.4. ECOSYSTEM ANALYSIS
5. Air Barrier Market – Key Market Dynamics
5.1 Market Drivers
5.1.1 Advantages of Using Air Barriers
5.1.2 Growth of Residential Construction Sector
5.2 Market Restraints
5.2.1 Lack of Presence of Skilled Labour
5.3 Market Opportunities
5.3.1 New Product Launches
5.4 Future Trends
5.4.1 Increasing Use of Fluid-Applied Air Barriers
5.5 Impact Analysis
6. Air Barrier– Global Market Analysis
6.1 Air Barrier Market Overview
6.2 Air Barrier Market –Revenue and Forecast to 2028 (US$ Million)
6.3 Competitive Positioning – Key Market Players
7. Air Barrier Market Analysis – By Category
7.1 Overview
7.2 Air Barrier Market, By Category (2021 and 2028)
7.3 Coating
7.3.1 Overview
7.3.2 Coating: Air Barrier Market – Revenue and Forecast to 2028 (US$ Million)
7.3.3 Acrylic
7.3.3.1 Acrylic: US Air Barrier Market – Revenue and Forecast to 2028 (US$ Mn)
7.3.4 Silicone
7.3.4.1 Silicone: US Air Barrier Market – Revenue and Forecast to 2028 (US$ Mn)
7.3.5 Others
7.3.5.1 Others: US Air Barrier Market – Revenue and Forecast to 2028 (US$ Mn)
7.4 Membrane
7.4.1 Overview
7.4.2 Membrane: Air Barrier Market – Revenue and Forecast to 2028 (US$ Million)
8. Air Barrier Market Analysis – By Type
8.1 Overview
8.2 Air Barrier Market, By Type (2021 and 2028)
8.3.1 Overview
8.3.2 Vapor Permeable: Air Barrier Market – Revenue and Forecast to 2028 (US$ Million)
8.4 Vapor Impermeable
8.4.1 Overview
8.4.2 Vapor Impermeable: Air Barrier Market – Revenue and Forecast to 2028 (US$ Million)
9. Air Barrier Market Analysis – By Application
9.1 Overview
9.2 Air Barrier Market, By Application (2021 and 2028)
9.3 Residential
9.3.1 Overview
9.3.2 Residential: Air Barrier Market – Revenue and Forecast to 2028 (US$ Million)
9.4 Industrial
9.4.1 Overview
9.4.2 Industrial: Air Barrier Market – Revenue and Forecast to 2028 (US$ Million)
9.5 Commercial
9.5.1 Overview
9.5.2 Commercial: Air Barrier Market – Revenue and Forecast to 2028 (US$ Million)
10. Air Barrier Market – Geographic Analysis
10.1 Overview
10.2 North America: Air Barrier Market
10.2.1 North America: Air Barrier Market – Analysis and Forecast to 2028 (US$ Million)
10.2.2 North America: Air Barrier Market, by Category
10.2.3 North America: Air Barrier Market, by Type
10.2.4 North America: Air Barrier Market, by Application
10.2.5 North America: Air Barrier Market, by Key Country
10.2.5.1 US: Air Barrier Market –Analysis and Forecast to 2028 (US$ Million)
10.2.5.1.1 US: Air Barrier Market, by Category
10.2.5.1.2 US: Air Barrier Market, by Type
10.2.5.1.3 US: Air Barrier Market, by Application
10.2.5.2 Canada: Air Barrier Market –Analysis and Forecast to 2028 (US$ Million)
10.2.5.2.1 Canada: Air Barrier Market, by Category
10.2.5.2.2 Canada: Air Barrier Market, by Type
10.2.5.2.3 Canada: Air Barrier Market, by Application
10.2.5.3 Mexico: Air Barrier Market –Analysis and Forecast to 2028 (US$ Million)
10.2.5.3.1 Mexico: Air Barrier Market, by Category
10.2.5.3.2 Mexico: Air Barrier Market, by Type
10.2.5.3.3 Mexico: Air Barrier Market, by Application
10.3 Europe: Air Barrier Market
10.3.1 Europe: Air Barrier Market –Revenue and Forecast to 2028 (US$ Million)
10.3.2 Europe: Air Barrier Market, by Category
10.3.3 Europe: Air Barrier Market, by Type
10.3.4 Europe: Air Barrier Market, by Application
10.3.5 Europe: Air Barrier Market, by Key Country
10.3.5.1 Germany: Air Barrier Market–Analysis and Forecast to 2028 (US$ Million)
10.3.5.1.1 Germany: Air Barrier Market, by Category
10.3.5.1.2 Germany: Air Barrier Market, by Type
10.3.5.1.3 Germany: Air Barrier Market, by Application
10.3.5.2 France: Air Barrier Market–Analysis and Forecast to 2028 (US$ Million)
10.3.5.2.1 France: Air Barrier Market, by Category
10.3.5.2.2 France: Air Barrier Market, by Type
10.3.5.2.3 France: Air Barrier Market, by Application
10.3.5.3 UK: Air Barrier Market–Revenue and Forecast to 2028 (US$ Million)
10.3.5.3.1 UK: Air Barrier Market, by Category
10.3.5.3.2 UK: Air Barrier Market, by Type
10.3.5.3.3 UK: Air Barrier Market, by Application
10.3.5.4 Italy: Air Barrier Market–Revenue and Forecast to 2028 (US$ Million)
10.3.5.4.1 Italy: Air Barrier Market, by Category
10.3.5.4.2 Italy: Air Barrier Market, by Type
10.3.5.4.3 Italy: Air Barrier Market, by Application
10.3.5.5 Russia: Air Barrier Market–Revenue and Forecast to 2028 (US$ Million)
10.3.5.5.1 Russia: Air Barrier Market, by Category
10.3.5.5.2 Russia: Air Barrier Market, by Type
10.3.5.5.3 Russia: Air Barrier Market, by Application
10.3.5.6 Rest of Europe: Air Barrier Market–Revenue and Forecast to 2028 (US$ Million)
10.3.5.6.1 Rest of Europe: Air Barrier Market, by Category
10.3.5.6.2 Rest of Europe: Air Barrier Market, by Type
10.3.5.6.3 Rest of Europe: Air Barrier Market, by Application
10.4 Asia-Pacific: Air Barrier Market
10.4.1 Asia-Pacific: Air Barrier Market – Analysis and Forecast to 2028 (US$ Million)
10.4.2 Asia-Pacific: Air Barrier Market, by Category
10.4.3 Asia-Pacific: Air Barrier Market, by Type
10.4.4 Asia-Pacific: Air Barrier Market, by Application
10.4.5 Asia-Pacific: Air Barrier Market, by Key Country
10.4.5.1 Australia: Air Barrier Market –Analysis and Forecast to 2028 (US$ Million)
10.4.5.1.1 Australia: Air Barrier Market, by Category
10.4.5.1.2 Australia: Air Barrier Market, by Type
10.4.5.1.3 Australia: Air Barrier Market, by Application
10.4.5.2 China: Air Barrier Market –Analysis and Forecast to 2028 (US$ Million)
10.4.5.2.1 China: Air Barrier Market, by Category
10.4.5.2.2 China: Air Barrier Market, by Type
10.4.5.2.3 China: Air Barrier Market, by Application
10.4.5.3 India: Air Barrier Market –Analysis and Forecast to 2028 (US$ Million)
10.4.5.3.1 India: Air Barrier Market, by Category
10.4.5.3.2 India: Air Barrier Market, by Type
10.4.5.3.3 India: Air Barrier Market, by Application
10.4.5.4 Japan: Air Barrier Market –Analysis and Forecast to 2028 (US$ Million)
10.4.5.4.1 Japan: Air Barrier Market, by Category
10.4.5.4.2 Japan: Air Barrier Market, by Type
10.4.5.4.3 Japan: Air Barrier Market, by Application
10.4.5.5 South Korea: Air Barrier Market –Analysis and Forecast to 2028 (US$ Million)
10.4.5.5.1 South Korea: Air Barrier Market, by Category
10.4.5.5.2 South Korea: Air Barrier Market, by Type
10.4.5.5.3 South Korea: Air Barrier Market, by Application
10.4.5.6 Rest of Asia-Pacific: Air Barrier Market –Analysis and Forecast to 2028 (US$ Million)
10.4.5.6.1 Rest of Asia-Pacific: Air Barrier Market, by Category
10.4.5.6.2 Rest of Asia-Pacific: Air Barrier Market, by Type
10.4.5.6.3 Rest of Asia-Pacific: Air Barrier Market, by Application
10.5 Middle East and Africa: Air Barrier Market
10.5.1 Middle East and Africa: Air Barrier Market – Analysis and Forecast to 2028 (US$ Million)
10.5.2 Middle East and Africa: Air Barrier Market, by Category
10.5.3 Middle East and Africa: Air Barrier Market, by Type
10.5.4 Middle East and Africa: Air Barrier Market, by Application
10.5.5 Middle East and Africa: Air Barrier Market, by Key Country
10.5.5.1 South Africa: Air Barrier Market –Analysis and Forecast to 2028 (US$ Million)
10.5.5.1.1 South Africa: Air Barrier Market, by Category
10.5.5.1.2 South Africa: Air Barrier Market, by Type
10.5.5.1.3 South Africa: Air Barrier Market, by Application
10.5.5.2 Saudi Arabia: Air Barrier Market –Analysis and Forecast to 2028 (US$ Million)
10.5.5.2.1 Saudi Arabia: Air Barrier Market, by Category
10.5.5.2.2 Saudi Arabia: Air Barrier Market, by Type
10.5.5.2.3 Saudi Arabia: Air Barrier Market, by Application
10.5.5.3 UAE: Air Barrier Market –Analysis and Forecast to 2028 (US$ Million)
10.5.5.3.1 UAE: Air Barrier Market, by Category
10.5.5.3.2 UAE: Air Barrier Market, by Type
10.5.5.3.3 UAE: Air Barrier Market, by Application
10.5.5.4 Rest of the Middle East and Africa: Air Barrier Market –Analysis and Forecast to 2028 (US$ Million)
10.5.5.4.1 Rest of the Middle East and Africa: Air Barrier Market, by Category
10.5.5.4.2 Rest of the Middle East and Africa: Air Barrier Market, by Type
10.5.5.4.3 Rest of the Middle East and Africa: Air Barrier Market, by Application
10.6 South and Central America: Air Barrier Market
10.6.1 South and Central America: Air Barrier Market – Analysis and Forecast to 2028 (US$ Million)
10.6.2 South and Central America: Air Barrier Market, by Category
10.6.3 South and Central America: Air Barrier Market, by Type
10.6.4 South and Central America: Air Barrier Market, by Application
10.6.5 South and Central America: Air Barrier Market, by Key Country
10.6.5.1 Brazil: Air Barrier Market –Analysis and Forecast to 2028 (US$ Million)
10.6.5.1.1 Brazil: Air Barrier Market, by Category
10.6.5.1.2 Brazil: Air Barrier Market, by Type
10.6.5.1.3 Brazil: Air Barrier Market, by Application
10.6.5.2 Argentina: Air Barrier Market –Analysis and Forecast to 2028 (US$ Million)
10.6.5.2.1 Argentina: Air Barrier Market, by Category
10.6.5.2.2 Argentina: Air Barrier Market, by Type
10.6.5.2.3 Argentina: Air Barrier Market, by Application
10.6.5.3 Rest of South and Central America: Air Barrier Market –Analysis and Forecast to 2028 (US$ Million)
10.6.5.3.1 Rest of South and Central America: Air Barrier Market, by Category
10.6.5.3.2 Rest of South and Central America: Air Barrier Market, by Type
10.6.5.3.3 Rest of South and Central America: Air Barrier Market, by Application
11. Impact of COVID-19 Pandemic on Air Barrier Market
11.1 Overview
11.2 Impact of COVID-19 on Air Barrier Market
11.3 North America: Impact Assessment of COVID-19 Pandemic
11.4 Europe: Impact Assessment of COVID-19 Pandemic
11.5 Asia Pacific: Impact Assessment of COVID-19 Pandemic
11.6 Middle East & Africa: Impact Assessment of COVID-19 Pandemic
11.7 South and Central America: Impact Assessment of COVID-19 Pandemic
12. Industry Landscape
12.1 Overview
12.2 Strategy and Business Planning
12.3 New Product Development
12.4 Expansion
12.5 Mergers and Acquisitions
13. COMPANY PROFILES
13.1 BASF SE
13.1.1 Key Facts
13.1.2 Business Description
13.1.3 Products and Services
13.1.4 Financial Overview
13.1.5 SWOT Analysis
13.1.6 Key Developments
13.2 Dow Inc.
13.2.1 Key Facts
13.2.2 Business Description
13.2.3 Products and Services
13.2.4 Financial Overview
13.2.5 SWOT Analysis
13.2.6 Key Developments
13.3 3M
13.3.1 Key Facts
13.3.2 Business Description
13.3.3 Products and Services
13.3.4 Financial Overview
13.3.5 SWOT Analysis
13.3.6 Key Developments
13.4 W. R. Meadows Inc
13.4.1 Key Facts
13.4.2 Business Description
13.4.3 Products and Services
13.4.4 Financial Overview
13.4.5 SWOT Analysis
13.4.6 Key Developments
13.5 GCP Applied Technologies Inc
13.5.1 Key Facts
13.5.2 Business Description
13.5.3 Products and Services
13.5.4 Financial Overview
13.5.5 SWOT Analysis
13.5.6 Key Developments
13.6 CertainTeed LLC
13.6.1 Key Facts
13.6.2 Business Description
13.6.3 Products and Services
13.6.4 Financial Overview
13.6.5 SWOT Analysis
13.6.6 Key Developments
13.7 Tamarack Materials Inc
13.7.1 Key Facts
13.7.2 Business Description
13.7.3 Products and Services
13.7.4 Financial Overview
13.7.5 SWOT Analysis
13.7.6 Key Developments
13.8 VaproShield LLC
13.8.1 Key Facts
13.8.2 Business Description
13.8.3 Products and Services
13.8.4 Financial Overview
13.8.5 SWOT Analysis
13.8.6 Key Developments
13.9 TK Products Construction Coating
13.9.1 Key Facts
13.9.2 Business Description
13.9.3 Products and Services
13.9.4 Financial Overview
13.9.5 SWOT Analysis
13.9.6 Key Developments
13.10 Henry Co.
13.10.1 Key Facts
13.10.2 Business Description
13.10.3 Products and Services
13.10.4 Financial Overview
13.10.5 SWOT Analysis
13.10.6 Key Developments
14. Appendix
14.1 About The Insight Partners
14.2 Glossary of Terms
LIST OF TABLES
Table 1. Air Barrier Market –Revenue and Forecast to 2028 (US$ Million)
Table 2. Global Air Barrier Market, by Category – Revenue and Forecast to 2028 (US$ Million)
Table 3. Global Air Barrier Market, by Type – Revenue and Forecast to 2028 (US$ Million)
Table 4. Global Air Barrier Market, by Application – Revenue and Forecast to 2028 (US$ Million)
Table 5. North America Air Barrier Market, by Category – Revenue and Forecast to 2028 (US$ Million)
Table 6. North America Air Barrier Market, by Type– Revenue and Forecast to 2028 (US$ Million)
Table 7. North America Air Barrier Market, by Application– Revenue and Forecast to 2028 (US$ Million)
Table 8. US Air Barrier Market, by Category – Revenue and Forecast to 2028 (US$ Million)
Table 9. US Air Barrier Market, by Type– Revenue and Forecast to 2028 (US$ Million)
Table 10. US Air Barrier Market, by Application– Revenue and Forecast to 2028 (US$ Million)
Table 11. Canada Air Barrier Market, by Category – Revenue and Forecast to 2028 (US$ Million)
Table 12. Canada Air Barrier Market, by Type– Revenue and Forecast to 2028 (US$ Million)
Table 13. Canada Air Barrier Market, by Application– Revenue and Forecast to 2028 (US$ Million)
Table 14. Mexico Air Barrier Market, by Category – Revenue and Forecast to 2028 (US$ Million)
Table 15. Mexico Air Barrier Market, by Type– Revenue and Forecast to 2028 (US$ Million)
Table 16. Mexico Air Barrier Market, by Application– Revenue and Forecast to 2028 (US$ Million)
Table 17. Europe Air Barrier Market, by Category– Revenue and Forecast to 2028 (USD Million)
Table 18. Europe Air Barrier Market, by Type– Revenue and Forecast to 2028 (USD Million)
Table 19. Europe Air Barrier Market, by Application – Revenue and Forecast to 2028 (USD Million)
Table 20. Germany: Air Barrier Market, by Category– Revenue and Forecast to 2028 (US$ Million)
Table 21. Germany: Air Barrier Market, by Type – Revenue and Forecast to 2028 (US$ Million)
Table 22. Germany: Air Barrier Market, by Application – Revenue and Forecast to 2028 (US$ Million)
Table 23. France: Air Barrier Market, by Category– Revenue and Forecast to 2028 (US$ Million)
Table 24. France: Air Barrier Market, by Type – Revenue and Forecast to 2028 (US$ Million)
Table 25. France: Air Barrier Market, by Application – Revenue and Forecast to 2028 (US$ Million)
Table 26. UK Air Barrier Market, by Category– Revenue and Forecast to 2028 (US$ Million)
Table 27. UK Air Barrier Market, by Type – Revenue and Forecast to 2028 (US$ Million)
Table 28. UK Air Barrier Market, by Application – Revenue and Forecast to 2028 (US$ Million)
Table 29. Italy Air Barrier Market, by Category– Revenue and Forecast to 2028 (US$ Million)
Table 30. Italy Air Barrier Market, by Type – Revenue and Forecast to 2028 (US$ Million)
Table 31. Italy Air Barrier Market, by Application – Revenue and Forecast to 2028 (US$ Million)
Table 32. Russia Air Barrier Market, by Category– Revenue and Forecast to 2028 (US$ Million)
Table 33. Russia Air Barrier Market, by Type – Revenue and Forecast to 2028 (US$ Million)
Table 34. Russia Air Barrier Market, by Application – Revenue and Forecast to 2028 (US$ Million)
Table 35. Rest of Europe Air Barrier Market, by Category– Revenue and Forecast to 2028 (US$ Million)
Table 36. Rest of Europe Air Barrier Market, by Type – Revenue and Forecast to 2028 (US$ Million)
Table 37. Rest of Europe Air Barrier Market, by Application – Revenue and Forecast to 2028 (US$ Million)
Table 38. Asia-Pacific Air Barrier Market, by Category– Revenue and Forecast to 2028 (US$ Million)
Table 39. Asia-Pacific Air Barrier Market, by Type– Revenue and Forecast to 2028 (US$ Million)
Table 40. Asia-Pacific Air Barrier Market, by Application – Revenue and Forecast to 2028 (US$ Million)
Table 41. Australia Air Barrier Market, by Category – Revenue and Forecast to 2028 (US$ Million)
Table 42. Australia Air Barrier Market, by Type– Revenue and Forecast to 2028 (US$ Million)
Table 43. Australia Air Barrier Market, by Application– Revenue and Forecast to 2028 (US$ Million)
Table 44. China Air Barrier Market, by Category– Revenue and Forecast to 2028 (US$ Million)
Table 45. China Air Barrier Market, by Type– Revenue and Forecast to 2028 (US$ Million)
Table 46. China Air Barrier Market, by Application– Revenue and Forecast to 2028 (US$ Million)
Table 47. India Air Barrier Market, by Type– Revenue and Forecast to 2028 (US$ Million)
Table 48. India Air Barrier Market, by Application– Revenue and Forecast to 2028 (US$ Million)
Table 49. Japan Air Barrier Market, by Category – Revenue and Forecast to 2028 (US$ Million)
Table 50. Japan Air Barrier Market, by Type– Revenue and Forecast to 2028 (US$ Million)
Table 51. Japan Air Barrier Market, by Application– Revenue and Forecast to 2028 (US$ Million)
Table 52. South Korea Air Barrier Market, by Category – Revenue and Forecast to 2028 (US$ Million)
Table 53. South Korea Air Barrier Market, by Type – Revenue and Forecast to 2028 (US$ Million)
Table 54. South Korea Air Barrier Market, by Application– Revenue and Forecast to 2028 (US$ Million)
Table 55. Rest of Asia-Pacific Air Barrier Market, by Category– Revenue and Forecast to 2028 (US$ Million)
Table 56. Rest of Asia-Pacific Air Barrier Market, by Type– Revenue and Forecast to 2028 (US$ Million)
Table 57. Rest of Asia-Pacific Air Barrier Market, by Application– Revenue and Forecast to 2028 (US$ Million)
Table 58. Middle East and Africa Air Barrier Market, by Category – Revenue and Forecast to 2028 (US$ Million)
Table 59. Middle East and Africa Air Barrier Market, by Type– Revenue and Forecast to 2028 (US$ Million)
Table 60. Middle East and Africa Air Barrier Market, by Application– Revenue and Forecast to 2028 (US$ Million)
Table 61. South Africa Air Barrier Market, by Category – Revenue and Forecast to 2028 (US$ Million)
Table 62. South Africa Air Barrier Market, by Type– Revenue and Forecast to 2028 (US$ Million)
Table 63. South Africa Air Barrier Market, by Application– Revenue and Forecast to 2028 (US$ Million)
Table 64. Saudi Arabia Air Barrier Market, by Category – Revenue and Forecast to 2028 (US$ Million)
Table 65. Saudi Arabia Air Barrier Market, by Type– Revenue and Forecast to 2028 (US$ Million)
Table 66. Saudi Arabia Air Barrier Market, by Application– Revenue and Forecast to 2028 (US$ Million)
Table 67. UAE Air Barrier Market, by Category– Revenue and Forecast to 2028 (US$ Million)
Table 68. UAE Air Barrier Market, by Type– Revenue and Forecast to 2028 (US$ Million)
Table 69. UAE Air Barrier Market, by Application– Revenue and Forecast to 2028 (US$ Million)
Table 70. Rest of the Middle East and Africa Air Barrier Market, by Category – Revenue and Forecast to 2028 (US$ Million)
Table 71. Rest of the Middle East and Africa Air Barrier Market, by Type– Revenue and Forecast to 2028 (US$ Million)
Table 72. Rest of the Middle East and Africa Air Barrier Market, by Application– Revenue and Forecast to 2028 (US$ Million)
Table 73. South and Central America Air Barrier Market, by Category– Revenue and Forecast to 2028 (US$ Million)
Table 74. South and Central America Air Barrier Market, by Type– Revenue and Forecast to 2028 (US$ Million)
Table 75. South and Central America Air Barrier Market, by Application– Revenue and Forecast to 2028 (US$ Million)
Table 76. Brazil Air Barrier Market, by Category – Revenue and Forecast to 2028 (US$ Million)
Table 77. Brazil Air Barrier Market, by Type– Revenue and Forecast to 2028 (US$ Million)
Table 78. Brazil Air Barrier Market, by Application– Revenue and Forecast to 2028 (US$ Million)
Table 79. Argentina Air Barrier Market, by Category – Revenue and Forecast to 2028 (US$ Million)
Table 80. Argentina Air Barrier Market, by Type– Revenue and Forecast to 2028 (US$ Million)
Table 81. Argentina Air Barrier Market, by Application– Revenue and Forecast to 2028 (US$ Million)
Table 82. Rest of South and Central America Air Barrier Market, by Category – Revenue and Forecast to 2028 (US$ Million)
Table 83. Rest of South and Central America Air Barrier Market, by Type– Revenue and Forecast to 2028 (US$ Million)
Table 84. Rest of South and Central America Air Barrier Market, by Application– Revenue and Forecast to 2028 (US$ Million)
Table 85. Glossary of Terms, Global Air Barrier Market
LIST OF FIGURES
Figure 1. Air Barrier Market Segmentation
Figure 2. Air Barrier Market Segmentation – By Geography
Figure 3. Global Air Barrier Market Overview
Figure 4. Global Air Barrier Market, By Category
Figure 5. Global Air Barrier Market, by Geography
Figure 6. Global Air Barrier Market, Industry Landscape
Figure 7. Porter’s Five Forces Analysis
Figure 8. Expert Opinion
Figure 9. Ecosystem analysis
Figure 10. Global Air Barrier Market Impact Analysis of Drivers and Restraints
Figure 11. Geographic Overview of Air Barrier Market
Figure 15. Air Barrier Market – Revenue and Forecast to 2028 (US$ Million)
Figure 16. Air Barrier Market Revenue Share, By Category (2021 and 2028)
Figure 17. Coating: Air Barrier Market – Revenue and Forecast To 2028 (US$ Million)
Figure 18. Membrane: Air Barrier Market – Revenue and Forecast To 2028 (US$ Million)
Figure 20. Air Barrier Market Revenue Share, By Type (2021 and 2028)
Figure 21. Vapor Permeable: Air Barrier Market – Revenue and Forecast To 2028 (US$ Million)
Figure 22. Vapor Impermeable: Air Barrier Market – Revenue and Forecast To 2028 (US$ Million)
Figure 25. Air Barrier Market Revenue Share, By Application (2021 and 2028)
Figure 26. Residential: Air Barrier Market – Revenue and Forecast To 2028 (US$ Million)
Figure 27. Industrial: Air Barrier Market – Revenue and Forecast To 2028 (US$ Million)
Figure 28. Commercial: Air Barrier Market – Revenue and Forecast To 2028 (US$ Million)
Figure 31. Global Air Barrier Market Revenue Share, by Region (2021 and 2028)
Figure 32. North America: Air Barrier Market – Revenue and Forecast to 2028 (US$ Million)
Figure 33. North America: Air Barrier Market Revenue Share, by Category (2021 and 2028)
Figure 34. North America: Air Barrier Market Revenue Share, by Type (2021 and 2028)
Figure 35. North America: Air Barrier Market Revenue Share, by Application (2021 and 2028)
Figure 36. North America: Air Barrier Market Revenue Share, by Key Country (2020 and 2028)
Figure 37. US: Air Barrier Market –Revenue and Forecast to 2028 (US$ Million)
Figure 38. Canada: Air Barrier Market –Revenue and Forecast to 2028 (US$ Million)
Figure 39. Mexico: Air Barrier Market –Revenue and Forecast to 2028 (US$ Million)
Figure 40. Europe: Air Barrier Market – Revenue and Forecast to 2028 (US$ Million)
Figure 41. Europe: Air Barrier Market Revenue Share, by Category (2021 and 2028)
Figure 42. Europe: Air Barrier Market Revenue Share, by Type (2021 and 2028)
Figure 43. Europe: Air Barrier Market Revenue Share, by Application (2021 and 2028)
Figure 44. Europe: Air Barrier Market Revenue Share, by Key Country (2021 and 2028)
Figure 45. Germany: Air Barrier Market–Revenue and Forecast to 2028 (US$ Million)
Figure 46. France: Air Barrier Market–Revenue and Forecast to 2028 (US$ Million)
Figure 47. UK: Air Barrier Market–Revenue and Forecast to 2028 (US$ Million)
Figure 48. Italy: Air Barrier Market–Revenue and Forecast to 2028 (US$ Million)
Figure 49. Russia: Air Barrier Market–Revenue and Forecast to 2028 (US$ Million)
Figure 50. Rest of Europe: Air Barrier Market–Revenue and Forecast to 2028 (US$ Million)
Figure 51. Asia-Pacific: Air Barrier Market – Revenue and Forecast to 2028 (US$ Million)
Figure 52. Asia-Pacific: Air Barrier Market Revenue Share, by Category (2021 and 2028)
Figure 53. Asia-Pacific: Air Barrier Market Revenue Share, by Type (2020 and 2028)
Figure 54. Asia-Pacific: Air Barrier Market Revenue Share, by Application (2021 and 2028)
Figure 55. Asia-Pacific: Air Barrier Market Revenue Share, by Key Country (2021 and 2028)
Figure 56. Australia: Air Barrier Market –Revenue and Forecast to 2028 (US$ Million)
Figure 57. China: Air Barrier Market –Revenue and Forecast to 2028 (US$ Million)
Figure 58. India: Air Barrier Market –Revenue and Forecast to 2028 (US$ Million)
Figure 59. Japan: Air Barrier Market –Revenue and Forecast to 2028 (US$ Million)
Figure 60. South Korea: Air Barrier Market –Revenue and Forecast to 2028 (US$ Million)
Figure 61. Rest of Asia-Pacific: Air Barrier Market –Revenue and Forecast to 2028 (US$ Million)
Figure 62. Middle East and Africa: Air Barrier Market – Revenue and Forecast to 2028 (US$ Million)
Figure 63. Middle East and Africa: Air Barrier Market Revenue Share, by Category (2021 and 2028)
Figure 64. Middle East and Africa: Air Barrier Market Revenue Share, by Type (2021 and 2028)
Figure 65. Middle East and Africa: Air Barrier Market Revenue Share, by Application (2021 and 2028)
Figure 66. Middle East and Africa: Air Barrier Market Revenue Share, By Key Country (2021 And 2028)
Figure 67. South Africa: Air Barrier Market –Revenue and Forecast to 2028 (US$ Million)
Figure 68. Saudi Arabia: Air Barrier Market –Revenue and Forecast to 2028 (US$ Million)
Figure 69. UAE: Air Barrier Market –Revenue and Forecast to 2028 (US$ Million)
Figure 70. Rest of the Middle East and Africa: Air Barrier Market –Revenue and Forecast to 2028 (US$ Million)
Figure 71. South and Central America: Air Barrier Market – Revenue and Forecast to 2028 (US$ Million)
Figure 72. South and Central America: Air Barrier Market Revenue Share, by Category (2021 and 2028)
Figure 73. South and Central America: Air Barrier Market Revenue Share, by Type (2021 and 2028)
Figure 74. South and Central America: Air Barrier Market Revenue Share, by Application (2021 and 2028)
Figure 75. South and Central America: Air Barrier Market Revenue Share, by Key Country (2021 and 2028)
Figure 76. Brazil: Air Barrier Market –Revenue and Forecast to 2028 (US$ Million)
Figure 77. Argentina: Air Barrier Market –Revenue and Forecast to 2028 (US$ Million)
Figure 78. Rest of South and Central America: Air Barrier Market –Revenue and Forecast to 2028 (US$ Million)
Figure 79. Impact of COVID-19 Pandemic on Major Countries in North America
Figure 80. Impact of COVID-19 Pandemic on Major Countries in Europe
Figure 81. Impact of COVID-19 Pandemic on Major Countries in Asia Pacific
Figure 82. Impact of COVID-19 Pandemic in Major Countries in Middle East & Africa
Figure 83. Impact of COVID-19 Pandemic on Major Countries in South and Central America
Yes! We provide a free sample of the report, which includes Report Scope (Table of Contents), report structure, and selected insights to help you assess the value of the full report. Please click on the "Download Sample" button or contact us to receive your copy.
Absolutely - analyst assistance is part of the package. You can connect with our analyst post-purchase to clarify report insights, methodology or discuss how the findings apply to your business needs.
Once your order is successfully placed, you will receive a confirmation email along with your invoice.
• For published reports: You'll receive access to the report within 4-6 working hours via a secured email sent to your email.
• For upcoming reports: Your order will be recorded as a pre-booking. Our team will share the estimated release date and keep you informed of any updates. As soon as the report is published, it will be delivered to your registered email.
We offer customization options to align the report with your specific objectives. Whether you need deeper insights into a particular region, industry segment, competitor analysis, or data cut, our research team can tailor the report accordingly. Please share your requirements with us, and we'll be happy to provide a customized proposal or scope.
The report is available in either PDF format or as an Excel dataset, depending on the license you choose.
The PDF version provides the full analysis and visuals in a ready-to-read format. The Excel dataset includes all underlying data tables for easy manipulation and further analysis.
Please review the license options at checkout or contact us to confirm which formats are included with your purchase.
Our payment process is fully secure and PCI-DSS compliant.
We use trusted and encrypted payment gateways to ensure that all transactions are protected with industry-standard SSL encryption. Your payment details are never stored on our servers and are handled securely by certified third-party processors.
You can make your purchase with confidence, knowing your personal and financial information is safe with us.
Yes, we do offer special pricing for bulk purchases.
If you're interested in purchasing multiple reports, we're happy to provide a customized bundle offer or volume-based discount tailored to your needs. Please contact our sales team with the list of reports you're considering, and we'll share a personalized quote.
Yes, absolutely.
Our team is available to help you make an informed decision. Whether you have questions about the report's scope, methodology, customization options, or which license suits you best, we're here to assist. Please reach out to us at sales@theinsightpartners.com, and one of our representatives will get in touch promptly.
Yes, a billing invoice will be automatically generated and sent to your registered email upon successful completion of your purchase.
If you need the invoice in a specific format or require additional details (such as company name, GST, or VAT information), feel free to contact us, and we'll be happy to assist.
Yes, certainly.
If you encounter any difficulties accessing or receiving your report, our support team is ready to assist you. Simply reach out to us via email or live chat with your order information, and we'll ensure the issue is resolved quickly so you can access your report without interruption.
The Insight Partners performs research in 4 major stages: Data Collection & Secondary Research, Primary Research, Data Analysis and Data Triangulation & Final Review.
- Data Collection and Secondary Research:
As a market research and consulting firm operating from a decade, we have published many reports and advised several clients across the globe. First step for any study will start with an assessment of currently available data and insights from existing reports. Further, historical and current market information is collected from Investor Presentations, Annual Reports, SEC Filings, etc., and other information related to company’s performance and market positioning are gathered from Paid Databases (Factiva, Hoovers, and Reuters) and various other publications available in public domain.
Several associations trade associates, technical forums, institutes, societies and organizations are accessed to gain technical as well as market related insights through their publications such as research papers, blogs and press releases related to the studies are referred to get cues about the market. Further, white papers, journals, magazines, and other news articles published in the last 3 years are scrutinized and analyzed to understand the current market trends.
- Primary Research:
The primarily interview analysis comprise of data obtained from industry participants interview and answers to survey questions gathered by in-house primary team.
For primary research, interviews are conducted with industry experts/CEOs/Marketing Managers/Sales Managers/VPs/Subject Matter Experts from both demand and supply side to get a 360-degree view of the market. The primary team conducts several interviews based on the complexity of the markets to understand the various market trends and dynamics which makes research more credible and precise.
A typical research interview fulfils the following functions:
- Provides first-hand information on the market size, market trends, growth trends, competitive landscape, and outlook
- Validates and strengthens in-house secondary research findings
- Develops the analysis team’s expertise and market understanding
Primary research involves email interactions and telephone interviews for each market, category, segment, and sub-segment across geographies. The participants who typically take part in such a process include, but are not limited to:
- Industry participants: VPs, business development managers, market intelligence managers and national sales managers
- Outside experts: Valuation experts, research analysts and key opinion leaders specializing in the electronics and semiconductor industry.
Below is the breakup of our primary respondents by company, designation, and region:

Once we receive the confirmation from primary research sources or primary respondents, we finalize the base year market estimation and forecast the data as per the macroeconomic and microeconomic factors assessed during data collection.
- Data Analysis:
Once data is validated through both secondary as well as primary respondents, we finalize the market estimations by hypothesis formulation and factor analysis at regional and country level.
- 3.1 Macro-Economic Factor Analysis:
We analyse macroeconomic indicators such the gross domestic product (GDP), increase in the demand for goods and services across industries, technological advancement, regional economic growth, governmental policies, the influence of COVID-19, PEST analysis, and other aspects. This analysis aids in setting benchmarks for various nations/regions and approximating market splits. Additionally, the general trend of the aforementioned components aid in determining the market's development possibilities.
- 3.2 Country Level Data:
Various factors that are especially aligned to the country are taken into account to determine the market size for a certain area and country, including the presence of vendors, such as headquarters and offices, the country's GDP, demand patterns, and industry growth. To comprehend the market dynamics for the nation, a number of growth variables, inhibitors, application areas, and current market trends are researched. The aforementioned elements aid in determining the country's overall market's growth potential.
- 3.3 Company Profile:
The “Table of Contents” is formulated by listing and analyzing more than 25 - 30 companies operating in the market ecosystem across geographies. However, we profile only 10 companies as a standard practice in our syndicate reports. These 10 companies comprise leading, emerging, and regional players. Nonetheless, our analysis is not restricted to the 10 listed companies, we also analyze other companies present in the market to develop a holistic view and understand the prevailing trends. The “Company Profiles” section in the report covers key facts, business description, products & services, financial information, SWOT analysis, and key developments. The financial information presented is extracted from the annual reports and official documents of the publicly listed companies. Upon collecting the information for the sections of respective companies, we verify them via various primary sources and then compile the data in respective company profiles. The company level information helps us in deriving the base number as well as in forecasting the market size.
- 3.4 Developing Base Number:
Aggregation of sales statistics (2020-2022) and macro-economic factor, and other secondary and primary research insights are utilized to arrive at base number and related market shares for 2022. The data gaps are identified in this step and relevant market data is analyzed, collected from paid primary interviews or databases. On finalizing the base year market size, forecasts are developed on the basis of macro-economic, industry and market growth factors and company level analysis.
- Data Triangulation and Final Review:
The market findings and base year market size calculations are validated from supply as well as demand side. Demand side validations are based on macro-economic factor analysis and benchmarks for respective regions and countries. In case of supply side validations, revenues of major companies are estimated (in case not available) based on industry benchmark, approximate number of employees, product portfolio, and primary interviews revenues are gathered. Further revenue from target product/service segment is assessed to avoid overshooting of market statistics. In case of heavy deviations between supply and demand side values, all thes steps are repeated to achieve synchronization.
We follow an iterative model, wherein we share our research findings with Subject Matter Experts (SME’s) and Key Opinion Leaders (KOLs) until consensus view of the market is not formulated – this model negates any drastic deviation in the opinions of experts. Only validated and universally acceptable research findings are quoted in our reports.
We have important check points that we use to validate our research findings – which we call – data triangulation, where we validate the information, we generate from secondary sources with primary interviews and then we re-validate with our internal data bases and Subject matter experts. This comprehensive model enables us to deliver high quality, reliable data in shortest possible time.

Nov 2022
Yttrium Vanadate (YVO4) Crystals Market
Size and Forecast (2021 - 2034), Global and Regional Share, Trend, and Growth Opportunity Analysis Report Coverage: By Crystal Type [Pure YVO4 Crystals, Neodymium Doped (Nd-YVO4) Crystals, Ytterbium Doped (Yb: YVO4) Crystals, and Others], Form (Bulk Single Crystals, Powdered Crystals and Others), and Application (Laser and Optoelectronics, Telecommunications, Medical and Healthcare, Aerospace and Defense, Consumer Electronics, Research and Academics, and Others)
Nov 2022
Rubidium Titanyl Phosphate (RTP) Nonlinear Optic Crystals Market
Size and Forecast (2021 - 2034), Global and Regional Share, Trend, and Growth Opportunity Analysis Report Coverage: By Product Type (Doped RTP and Pure RTP), By Form (Bulk Single Crystals, Powdered Crystals, and Others), By Application (Laser and Optoelectronics, Telecommunications, Medical and Healthcare, Aerospace and Defense, Consumer Electronics, Research and Academics, and Others), and Geography (North America, Europe, Asia Pacific, Middle East and Africa, and South and Central America)
Nov 2022
Crystals Market
Size and Forecast (2021 - 2034), Global and Regional Share, Trend, and Growth Opportunity Analysis Report Coverage: By Crystal Type {Laser and Active Crystals [Nd: YAG, Nd: YVO, Ti: Sapphire, and Others], Nonlinear Optical Crystals [Potassium Titanyl Phosphate (KTP), Barium Borate (BBO), Potassium Dihydrogen Phosphate (KDP), Rubidium Titanyl Phosphate (RTP), and Others], and Others}, By Form (Bulk Single Crystals, Powdered Crystals, and Others), By Application (Laser and Optoelectronics, Telecommunications, Medical and Healthcare, Aerospace and Defense, Consumer Electronics, Research and Academics, and Others), and Geography (North America, Europe, Asia Pacific, Middle East and Africa, and South and Central America)
Nov 2022
Mineral Oil Lubricants Market
Size and Forecast (2021 - 2034), Global and Regional Share, Trend, and Growth Opportunity Analysis Report Coverage: By Type (Hydraulic Fluid, Engine Oil, Driveline Lubricants, Metalworking Fluids, Grease, Process Oils, Coolants, and Others) and Application (Automotive [Passenger Cars, Light Commercial Vehicles, Heavy Commercial Vehicles, and Others], Building and Construction, Power Generation, Mining and Metallurgy, Food Processing, Oil and Gas, Marine, Aviation, and Others)
Nov 2022
Rhamnolipids Market
Size and Forecast (2021 - 2031), Global and Regional Share, Trend, and Growth Opportunity Analysis Report Coverage: By Type (Mono-rhamnolipids and Di-rhamnolipids), Application [Daily Chemicals (Laundry Detergents, Dishwashers, Surface Cleaners, and Others), Personal Care and Cosmetics, Agriculture, Food, Pharmaceuticals, Oilfield and Petroleum, Environmental Protection, and Others] and Geography (North America, Europe, Asia Pacific, Middle East and Africa, and South and Central America)
Nov 2022
Europe Spray Marking Paints Market
Size and Forecast (2021 - 2035), Regional Share, Trend, and Growth Opportunity Analysis Report Coverage: By Propellant Type [LPG, Dimethyl Ether (DME), and Others], By Technology (Solvent-Based, Water-Based, and Others), By Application [Construction (Geodesy and Topography in Building and Construction, Railway Marking, Landscaped/Agricultural/Military Site Marking, and Others), Forestry [Tree Marking, Log Marking, Plank Marking, and Others], Line Marking (Information Marking and Signaling, Parking Spaces, Safety Marking and Signage, and Space Delimitation), Packaging, and Others], and Country
Nov 2022
Adhesives Market
Size and Forecast (2021 - 2031), Global and Regional Share, Trend, and Growth Opportunity Analysis Report Coverage: By Resin Type (Epoxy, Polyurethane, Acrylic, and Others), By End-Use Industry (Automotive, Aerospace, Paper and Packaging, Building and Construction, Electrical and Electronics, Medical, and Others), and Geography (North America, Europe, Asia Pacific, Middle East and Africa, and South and Central America)
Nov 2022
Ester for Synthetic and Bio-Based Lubricants Market
Size and Forecast (2021 - 2031), Global and Regional Share, Trend, and Growth Opportunity Analysis Report Coverage: By Ester Type [Monoesters, Diesters, Polyol Esters (Trimethylolpropane Esters, Pentaerythritol Esters, Neopentyl Glycol Esters, Trimethylol Ethane Esters, and Dipentaerythritol Esters), Trimellitate Esters, Complex Esters, and Others], Lubricant Type (Synthetic Lubricants and Biobased Lubricants), Application [Engine Oil (MCO, PCMO, HDEO, and Other Engines), Compressor Oil, (Refrigeration, Air Compressors, Natural Gas Compressors, and Others Compressors), Hydraulic Fluids, Gear Oil, Transmission Oil, Coolants, and Others], and End Use [Automotive (Conventional Vehicles and Electric Vehicles), Textile, Marine, Mining and Metallurgy, Aviation, Energy and Power, and Others]
 Get Free Sample For