Asia Pacific Robotic Refueling System Market Analysis and Opportunities by 2027
Asia Pacific Robotic Refueling System Market to 2027 - Regional Analysis and Forecasts by Component (Hardware, Software); Fuel (Gaseous Fuel, Gasoline, Diesel, Others); Industry Vertical (Aerospace and Defense, Automotive, Construction, Oil and Gas, Mining, Others); and Country
- Report Date : Sep 2019
- Report Code : TIPRE00006678
- Category : Electronics and Semiconductor
- Status : Published
- Available Report Formats :


- No. of Pages : 130
Robotic refueling system market in the Asia Pacific is expected to grow from US$ 1.68 Mn in 2018 to US$ 24.06 Mn by the year 2027 with a CAGR of 36.1% from the year 2019 to 2027.
The mining industry to ensure robotic refueling systems formidable growth rate, which in turn is anticipated to propel the robotic refueling system market. In addition, the flexibility of dispensing different fuels and low cost of operation is going to act as a catalyst for the robotic refueling system market growth. Moreover, the emergence of AI-based autonomous cars is anticipated to offer significant growth opportunities for the robotic refueling system market in the forecast period. For decades, fuel pumps have been operated by humans, thus, raising the total operational cost of managing the store and the pump. An operator has already been assigned for the task of fueling and managing the monetary operations. A robotic fueling station would eliminate the need for a human to potentially dangerous petrochemical fumes, avoiding driver’s exposure to extreme cold or hot temperatures during fueling, and reducing the labor costs associated with full-service fueling stations. Additionally, fueling a diesel car with petrol or vice versa has always been the most careless mistake while refueling. Robotic refueling systems eliminate the chances of wrong fuelling accidents as each vehicle would have an RFID tag which would inform the refueling station regarding the type of fuel used such as petrol, diesel, or natural gas.
Robotic refueling system market by fuel is classified into gaseous fuel, gasoline, diesel, and others. Gasoline segment of robotic refueling system market led the market in 2018 and is expected to continue its dominance during the forecast period. Emission of harmful greenhouse gasses from gasoline engine after combustion, is considered to be the major factor contributing to the unpopularity of gasoline powered vehicles. It is expected that electric vehicle is going to replace much of the gasoline vehicle during the forecast period from 2019 - 2027 Thus, in the near future during the forecast period, it is expected that other clean energy sources such as gaseous fuels and electric is going to substitute for gasoline powered vehicle. However, the application of diesel powered vehicle cannot be replaced by other fuel type owing to a diesel engine’s low power to weight ration and low end torque. Thus all medium and heavy commercial vehicle along with off-highway trucks and machineries are expected to be powered by diesel.
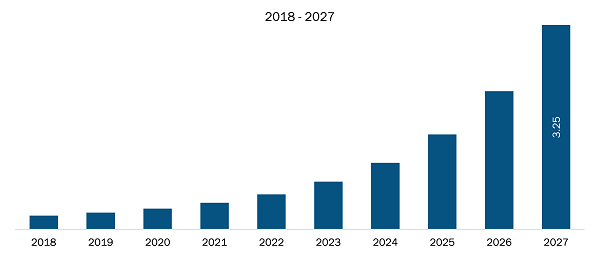
The China dominated the robotic refueling system market in 2018 and is expected to dominate the market with the highest share in the Asia Pacific region through the forecast period. China has increasingly evolved as the second leading crude oil consumer and has ranked fifth in the world in terms of production. The oil & gas market is dominated by the local oil companies that contribute to over 75% of the production. Growing oil & gas industry is expected to increase the adoption of robotic refueling system as it helps the workers to stay far from the stations and reduces human intervention. On the other hand, China aims to be a moderately prosperous society in every aspect, including space technology. Therefore, the country was projected to launch 100 satellites by 2025. For this step, China invested a massive amount in making its own space station by 2022. Such investment by the country towards making the infrastructure fully automated will also require a robotic refueling system. The country projects to be fully developed, rich, and powerful nation by leading in innovation, outer space, and artificial intelligence. The figure given below highlights the revenue share of the Rest of Asia Pacific in the robotic refueling system market in the forecast period:
Rest of Asia Pacific Robotic Refueling System Market Revenue and Forecasts to 2027 (US$ Mn)
- Sample PDF showcases the content structure and the nature of the information with qualitative and quantitative analysis.
- Request discounts available for Start-Ups & Universities
- Sample PDF showcases the content structure and the nature of the information with qualitative and quantitative analysis.
- Request discounts available for Start-Ups & Universities
ASIA PACIFIC ROBOTIC REFUELING SYSTEM MARKET SEGMENTATION
By Fuel
- Gaseous Fuel
- Gasoline
- Diesel
- Others
By Component
- Hardware
- Software
By Industry Vertical
- Aerospace and Defense
- Automotive
- Construction
- Oil and Gas
- Mining
- Others
By Country
- China
- Japan
- South Korea
- Australia
- India
- Rest of APAC
Robotic Refueling System Market - Companies Mentioned
- ABB Ltd.
- Fanuc Corporation
- Fuelmatics AB
- Gazprom Neft PJSC
- Kuka AG
- Neste
- Rotec Engineering
- Scott Technology Limited
- Shaw Development LLC
- Yaskawa Electric Corporation

Report Coverage
Revenue forecast, Company Analysis, Industry landscape, Growth factors, and Trends

Segment Covered
Component, Fuel, Industry Vertical, and Country

Regional Scope
North America, Europe, Asia Pacific, Middle East & Africa, South & Central America

Country Scope
Australia, China, Japan, South Korea
1. Introduction
1.1 Scope of the Study
1.2 The Insight Partners Research Report Guidance
1.3 Market Segmentation
1.3.1 Asia Pacific Robotic Refueling System market – By Component
1.3.2 Asia Pacific Robotic Refueling System Market – By Fuel
1.3.3 Asia Pacific Robotic Refueling System Market – By Industry Vertical
1.3.4 Asia Pacific Robotic Refueling System market – By Country
2. Key Takeaways
3. Research Methodology
3.1 Coverage
3.2 Secondary Research
3.3 Primary Research
4. Robotic Refueling System Market Landscape
4.1 Market Overview
4.2 PEST Analysis – Asia Pacific
4.3 Ecosystem Analysis
4.4 Expert Opinion
5. Robotic Refueling System Market – Key Industry Dynamics
5.1 Key Market Drivers
5.1.1 Flexibility of dispensing different fuels and low cost of operation is going to act as a catalyst for the market’s growth
5.1.2 Mining industry to ensure robotic refuelling systems formidable growth rate
5.2 Market Restraints
5.2.1 Security attacks act as major restraint
5.3 Opportunities
5.3.1 Acceptance of automated systems and solutions in marine applications
5.4 Future Trends
5.4.1 Emergence of AI-based autonomous cars
5.5 Impact Analysis
6. Robotic Refueling System Market – Asia Pacific Analysis
6.1 Overview
6.2 Asia Pacific Robotic Refueling System Market Revenue And Forecasts To 2027 (US$ Mn)
7. Asia Pacific Robotic Refueling System Market Analysis – By Component
7.1 Overview
7.2 Asia Pacific Robotic Refueling System Market Breakdown, By Component, 2018 & 2027
7.3 Hardware
7.3.1 Overview
7.3.2 Asia Pacific Hardware Market Revenue and Forecasts to 2027 (US$ Thousands)
7.4 Software
7.4.1 Overview
7.4.2 Asia Pacific Software Market Revenue and Forecasts to 2027 (US$ Thousands)
8. Asia Pacific Robotic Refueling System Market Analysis – By Fuel
8.1 Overview
8.2 Asia Pacific Robotic Refuelling System Market Breakdown, By Fuel, 2018 & 2027
8.3 Gaseous Fuel
8.3.1 Overview
8.3.2 Asia Pacific Gaseous Fuel Market Revenue and Forecasts to 2027 (US$ Thousands)
8.4 Gasoline
8.4.1 Overview
8.4.2 Asia Pacific Gasoline Market Revenue and Forecasts to 2027 (US$ Thousands)
8.5 Diesel
8.5.1 Overview
8.5.2 Asia Pacific Diesel Market Revenue and Forecasts to 2027 (US$ Thousands)
8.6 Others
8.6.1 Overview
8.6.2 Asia Pacific Others Market Revenue and Forecasts to 2027 (US$ Thousands)
9. Asia Pacific Robotic Refueling System Market Analysis – By Industry Vertical
9.1 Overview
9.2 Asia Pacific Robotic Refueling System Market Breakdown, By Industry Vertical, 2018 & 2027
9.3 Aerospace and Defence
9.3.1 Overview
9.3.2 Asia Pacific Aerospace and Defence Market Revenue and Forecasts to 2027 (US$ Thousands)
9.4 Automotive
9.4.1 Overview
9.4.2 Asia Pacific Automotive Market Revenue and Forecasts to 2027 (US$ Thousands)
9.5 Construction
9.5.1 Overview
9.5.2 Asia Pacific Construction Market Revenue and Forecasts to 2027 (US$ Thousands)
9.6 Oil & Gas
9.6.1 Overview
9.6.2 Asia Pacific Oil & Gas Market Revenue and Forecasts to 2027 (US$ Thousands)
9.7 Mining
9.7.1 Overview
9.7.2 Asia Pacific Mining Market Revenue and Forecasts to 2027 (US$ Thousands)
9.8 Others
9.8.1 Overview
9.8.2 Asia Pacific Others Market Revenue and Forecasts to 2027 (US$ Thousands)
10. Asia Pacific Robotic Refueling System Market – Country Analysis
10.1 Overview
10.1.2 APAC Robotic Refueling System Market Breakdown, by Key Countries
10.1.2.1 China Robotic Refueling System Market Revenue and Forecasts to 2027 (US$ Thousands)
10.1.2.1.1 China Robotic Refueling System Market Breakdown by Component
10.1.2.1.2 China Robotic Refueling System Market Breakdown by Fuel
10.1.2.1.3 China Robotic Refueling System Market Breakdown by Industry Vertical
10.1.2.2 India Robotic Refueling System Market Revenue and Forecasts to 2027 (US$ Thousands)
10.1.2.2.1 India Robotic Refueling System Market Breakdown by Component
10.1.2.2.2 India Robotic Refueling System Market Breakdown by Fuel
10.1.2.2.3 India Robotic Refueling System Market Breakdown by Industry Vertical
10.1.2.3 Japan Robotic Refueling System Market Revenue and Forecasts to 2027 (US$ Thousands)
10.1.2.3.1 Japan Robotic Refueling System Market Breakdown by Component
10.1.2.3.2 Japan Robotic Refueling System Market Breakdown by Fuel
10.1.2.3.3 Japan Robotic Refueling System Market Breakdown by Industry Vertical
10.1.2.4 Australia Robotic Refueling System Market Revenue and Forecasts to 2027 (US$ Thousands)
10.1.2.4.1 Australia Robotic Refueling System Market Breakdown by Component
10.1.2.4.2 Australia Robotic Refueling System Market Breakdown by Fuel
10.1.2.4.3 Australia Robotic Refueling System Market Breakdown by Industry Vertical
10.1.2.5 South Korea Robotic Refueling System Market Revenue and Forecasts to 2027 (US$ Thousands)
10.1.2.5.1 South Korea Robotic Refueling System Market Breakdown by Component
10.1.2.5.2 South Korea Robotic Refueling System Market Breakdown by Fuel
10.1.2.5.3 South Korea Robotic Refueling System Market Breakdown by Industry Vertical
10.1.2.6 Rest of APAC Robotic Refueling System Market Revenue and Forecasts to 2027 (US$ Thousands)
10.1.2.6.1 Rest of APAC Robotic Refueling System Market Breakdown by Component
10.1.2.6.2 Rest of APAC Robotic Refueling System Market Breakdown by Fuel
10.1.2.6.3 Rest of APAC Robotic Refueling System Market Breakdown by Industry Vertical
11. Industry Landscape
11.1 Overview
11.2 Market Initiative
11.3 New Development
12. Company Profiles
12.1 ABB Ltd.
12.1.1 Key Facts
12.1.2 Business Description
12.1.3 Product and Services
12.1.4 Financial Overview
12.1.5 SWOT Analysis
12.1.6 Key Developments
12.2 Fanuc Corporation
12.2.1 Key Facts
12.2.2 Business Description
12.2.3 Products and Services
12.2.4 Financial Overview
12.2.5 SWOT Analysis
12.2.6 Key Developments
12.3 Fuelmatics AB
12.3.1 Key Facts
12.3.2 Business Description
12.3.3 Products and Services
12.3.4 Financial Overview
12.3.5 SWOT Analysis
12.3.6 Key Developments
12.4 Gazprom NeftPJSC
12.4.1 Key Facts
12.4.2 Business Description
12.4.3 Products and Services
12.4.4 Financial Overview
12.4.5 SWOT Analysis
12.4.6 Key Developments
12.5 Kuka AG
12.5.1 Key Facts
12.5.2 Business Description
12.5.3 Products and Services
12.5.4 Financial Overview
12.5.5 SWOT Analysis
12.5.6 Key Developments
12.6 Neste
12.6.1 Key Facts
12.6.2 Business Description
12.6.3 Products and Services
12.6.4 Financial Overview
12.6.5 SWOT Analysis
12.6.6 Key Developments
12.7 Rotec Engineering
12.7.1 Key Facts
12.7.2 Business Description
12.7.3 Products and Services
12.7.4 Financial Overview
12.7.5 SWOT Analysis
12.7.6 Key Developments
12.8 Scott Technology Limited
12.8.1 Key Facts
12.8.2 Business Description
12.8.3 Products and Services
12.8.4 Financial Overview
12.8.5 SWOT Analysis
12.8.6 Key Developments
12.9 Shaw Development LLC.
12.9.1 Key Facts
12.9.2 Business Description
12.9.3 Products and Services
12.9.4 Financial Overview
12.9.5 SWOT Analysis
12.9.6 Key Developments
12.10 Yaskawa Electric Corporation
12.10.1 Key Facts
12.10.2 Business Description
12.10.3 Products and Services
12.10.4 Financial Overview
12.10.5 SWOT Analysis
12.10.6 Key Developments
13. Appendix
13.1 About The Insight Partners
13.2 Glossary of Terms
LIST OF TABLES
Table 1. Asia Pacific Robotic Refueling System Market Revenue and Forecasts to 2027 (US$ Mn)
Table 2. APAC Robotic Refueling System Market Revenue and Forecasts to 2027 – By Component (US$ Thousands)
Table 3. APAC Robotic Refueling System Market Revenue and Forecasts to 2027 – By Fuel (US$ Thousands)
Table 4. APAC Robotic Refueling System Market Revenue and Forecasts to 2027 – By Industry Vertical (US$ Thousands)
Table 5. China Robotic Refueling System Market Revenue and Forecasts to 2027 – By Component (US$ Thousands)
Table 6. China Robotic Refueling System Market Revenue and Forecasts to 2027 – By Fuel (US$ Thousands)
Table 7. China Robotic Refueling System Market Revenue and Forecasts to 2027 – By Industry Vertical (US$ Thousands)
Table 8. India Robotic Refueling System Market Revenue and Forecasts to 2027 – By Component (US$ Thousands)
Table 9. India Robotic Refueling System Market Revenue and Forecasts to 2027 – By Fuel (US$ Thousands)
Table 10. India Robotic Refueling System Market Revenue and Forecasts to 2027 – By Industry Vertical (US$ Thousands)
Table 11. Japan Robotic Refueling System Market Revenue and Forecasts to 2027 – By Component (US$ Thousands)
Table 12. Japan Robotic Refueling System Market Revenue and Forecasts to 2027 – By Fuel (US$ Thousands)
Table 13. Japan Robotic Refueling System Market Revenue and Forecasts to 2027 – By Industry Vertical (US$ Thousands)
Table 14. Australia Robotic Refueling System Market Revenue and Forecasts to 2027 – By Component (US$ Thousands)
Table 15. Australia Robotic Refueling System Market Revenue and Forecasts to 2027 – By Fuel (US$ Thousands)
Table 16. Australia Robotic Refueling System Market Revenue and Forecasts to 2027 – By Industry Vertical (US$ Thousands)
Table 17. South Korea Robotic Refueling System Market Revenue and Forecasts to 2027 – By Type (US$ Thousands)
Table 18. South Korea Robotic Refueling System Market Revenue and Forecasts to 2027 – By Fuel (US$ Thousands)
Table 19. South Korea Robotic Refueling System Market Revenue and Forecasts to 2027 – By Industry Vertical (US$ Thousands)
Table 20. Rest of APAC Robotic Refueling System Market Revenue and Forecasts to 2027 – By Component (US$ Thousands)
Table 21. Rest of APAC Robotic Refueling System Market Revenue and Forecasts to 2027 – By Fuel (US$ Thousands)
Table 22. Rest of APAC Robotic Refueling System Market Revenue and Forecasts to 2027 – By Industry Vertical (US$ Thousands)
Table 23. Glossary of Term: Robotic Refueling System Market
LIST OF FIGURES
Figure 1. Robotic Refueling System Segmentation
Figure 2. Robotic Refueling System Segmentation - Country
Figure 3. Market Overview of Robotic Refueling System (2019-2027)
Figure 4. A Snapshot of Market Strategies
Figure 5. Robotic Refueling System Market By Type -2018 & 2027 (US$ MN)
Figure 6. Asia-Pacific – PEST Analysis
Figure 7. Ecosystem Analysis
Figure 8. Expert Opinion
Figure 9. Robotic Refueling System Market Impact Analysis of Drivers and Restraint
Figure 10. Asia Pacific Robotic Refueling System Market Revenue And Forecasts To 2027 (US$ Mn)
Figure 11. Robotic Refueling System Market Breakdown, By Component, 2018 & 2027 (%)
Figure 12. Asia Pacific Hardware Market Revenue and Forecast to 2027 (US$ Thousands)
Figure 13. Asia Pacific Software Market Revenue and Forecast to 2027 (US$ Thousands)
Figure 14. Robotic Refueling System Market Breakdown, By Fuel, 2018 & 2027 (%)
Figure 15. Asia Pacific Gaseous Fuel Market Revenue and Forecast to 2027 (US$ Thousands)
Figure 16. Asia Pacific Gasoline Market Revenue and Forecasts to 2027 (US$ Thousands)
Figure 17. Asia Pacific Diesel Market Revenue and Forecasts to 2027 (US$ Thousands)
Figure 18. Asia Pacific Others Market Revenue and Forecasts to 2027 (US$ Thousands)
Figure 19. Asia Pacific Robotic Refueling System Market Breakdown, By Industry Vertical, 2018 & 2027 (%)
Figure 20. Asia Pacific Aerospace and Defense Market Revenue and Forecast to 2027 (US$ Thousands)
Figure 21. Asia Pacific Automotive Market Revenue and Forecasts to 2027 (US$ Thousands)
Figure 22. Asia Pacific Construction Market Revenue and Forecasts to 2027 (US$ Thousands)
Figure 23. Asia Pacific Oil & Gas Market Revenue and Forecasts to 2027 (US$ Thousands)
Figure 24. Asia Pacific Mining Market Revenue and Forecasts to 2027 (US$ Thousands)
Figure 25. Asia Pacific Others Market Revenue and Forecasts to 2027 (US$ Thousands)
Figure 26. APAC Robotic Refueling System Market Breakdown by Key Countries, 2018 & 2027(%)
Figure 27. China Robotic Refueling System Market Revenue and Forecasts to 2027 (US$ Thousands)
Figure 28. India Robotic Refueling System Market Revenue and Forecasts to 2027 (US$ Thousands)
Figure 29. Japan Robotic Refueling System Market Revenue and Forecasts to 2027 (US$ Thousands)
Figure 30. Australia Robotic Refueling System Market Revenue and Forecasts to 2027 (US$ Thousands)
Figure 31. South Korea Robotic Refueling System Market Revenue and Forecasts to 2027 (US$ Thousands)
Figure 32. Rest of APAC Robotic Refueling System Market Revenue and Forecasts to 2027 (US$ Thousands)
Yes! We provide a free sample of the report, which includes Report Scope (Table of Contents), report structure, and selected insights to help you assess the value of the full report. Please click on the "Download Sample" button or contact us to receive your copy.
Absolutely - analyst assistance is part of the package. You can connect with our analyst post-purchase to clarify report insights, methodology or discuss how the findings apply to your business needs.
Once your order is successfully placed, you will receive a confirmation email along with your invoice.
• For published reports: You'll receive access to the report within 4-6 working hours via a secured email sent to your email.
• For upcoming reports: Your order will be recorded as a pre-booking. Our team will share the estimated release date and keep you informed of any updates. As soon as the report is published, it will be delivered to your registered email.
We offer customization options to align the report with your specific objectives. Whether you need deeper insights into a particular region, industry segment, competitor analysis, or data cut, our research team can tailor the report accordingly. Please share your requirements with us, and we'll be happy to provide a customized proposal or scope.
The report is available in either PDF format or as an Excel dataset, depending on the license you choose.
The PDF version provides the full analysis and visuals in a ready-to-read format. The Excel dataset includes all underlying data tables for easy manipulation and further analysis.
Please review the license options at checkout or contact us to confirm which formats are included with your purchase.
Our payment process is fully secure and PCI-DSS compliant.
We use trusted and encrypted payment gateways to ensure that all transactions are protected with industry-standard SSL encryption. Your payment details are never stored on our servers and are handled securely by certified third-party processors.
You can make your purchase with confidence, knowing your personal and financial information is safe with us.
Yes, we do offer special pricing for bulk purchases.
If you're interested in purchasing multiple reports, we're happy to provide a customized bundle offer or volume-based discount tailored to your needs. Please contact our sales team with the list of reports you're considering, and we'll share a personalized quote.
Yes, absolutely.
Our team is available to help you make an informed decision. Whether you have questions about the report's scope, methodology, customization options, or which license suits you best, we're here to assist. Please reach out to us at sales@theinsightpartners.com, and one of our representatives will get in touch promptly.
Yes, a billing invoice will be automatically generated and sent to your registered email upon successful completion of your purchase.
If you need the invoice in a specific format or require additional details (such as company name, GST, or VAT information), feel free to contact us, and we'll be happy to assist.
Yes, certainly.
If you encounter any difficulties accessing or receiving your report, our support team is ready to assist you. Simply reach out to us via email or live chat with your order information, and we'll ensure the issue is resolved quickly so you can access your report without interruption.
The Insight Partners performs research in 4 major stages: Data Collection & Secondary Research, Primary Research, Data Analysis and Data Triangulation & Final Review.
- Data Collection and Secondary Research:
As a market research and consulting firm operating from a decade, we have published many reports and advised several clients across the globe. First step for any study will start with an assessment of currently available data and insights from existing reports. Further, historical and current market information is collected from Investor Presentations, Annual Reports, SEC Filings, etc., and other information related to company’s performance and market positioning are gathered from Paid Databases (Factiva, Hoovers, and Reuters) and various other publications available in public domain.
Several associations trade associates, technical forums, institutes, societies and organizations are accessed to gain technical as well as market related insights through their publications such as research papers, blogs and press releases related to the studies are referred to get cues about the market. Further, white papers, journals, magazines, and other news articles published in the last 3 years are scrutinized and analyzed to understand the current market trends.
- Primary Research:
The primarily interview analysis comprise of data obtained from industry participants interview and answers to survey questions gathered by in-house primary team.
For primary research, interviews are conducted with industry experts/CEOs/Marketing Managers/Sales Managers/VPs/Subject Matter Experts from both demand and supply side to get a 360-degree view of the market. The primary team conducts several interviews based on the complexity of the markets to understand the various market trends and dynamics which makes research more credible and precise.
A typical research interview fulfils the following functions:
- Provides first-hand information on the market size, market trends, growth trends, competitive landscape, and outlook
- Validates and strengthens in-house secondary research findings
- Develops the analysis team’s expertise and market understanding
Primary research involves email interactions and telephone interviews for each market, category, segment, and sub-segment across geographies. The participants who typically take part in such a process include, but are not limited to:
- Industry participants: VPs, business development managers, market intelligence managers and national sales managers
- Outside experts: Valuation experts, research analysts and key opinion leaders specializing in the electronics and semiconductor industry.
Below is the breakup of our primary respondents by company, designation, and region:

Once we receive the confirmation from primary research sources or primary respondents, we finalize the base year market estimation and forecast the data as per the macroeconomic and microeconomic factors assessed during data collection.
- Data Analysis:
Once data is validated through both secondary as well as primary respondents, we finalize the market estimations by hypothesis formulation and factor analysis at regional and country level.
- 3.1 Macro-Economic Factor Analysis:
We analyse macroeconomic indicators such the gross domestic product (GDP), increase in the demand for goods and services across industries, technological advancement, regional economic growth, governmental policies, the influence of COVID-19, PEST analysis, and other aspects. This analysis aids in setting benchmarks for various nations/regions and approximating market splits. Additionally, the general trend of the aforementioned components aid in determining the market's development possibilities.
- 3.2 Country Level Data:
Various factors that are especially aligned to the country are taken into account to determine the market size for a certain area and country, including the presence of vendors, such as headquarters and offices, the country's GDP, demand patterns, and industry growth. To comprehend the market dynamics for the nation, a number of growth variables, inhibitors, application areas, and current market trends are researched. The aforementioned elements aid in determining the country's overall market's growth potential.
- 3.3 Company Profile:
The “Table of Contents” is formulated by listing and analyzing more than 25 - 30 companies operating in the market ecosystem across geographies. However, we profile only 10 companies as a standard practice in our syndicate reports. These 10 companies comprise leading, emerging, and regional players. Nonetheless, our analysis is not restricted to the 10 listed companies, we also analyze other companies present in the market to develop a holistic view and understand the prevailing trends. The “Company Profiles” section in the report covers key facts, business description, products & services, financial information, SWOT analysis, and key developments. The financial information presented is extracted from the annual reports and official documents of the publicly listed companies. Upon collecting the information for the sections of respective companies, we verify them via various primary sources and then compile the data in respective company profiles. The company level information helps us in deriving the base number as well as in forecasting the market size.
- 3.4 Developing Base Number:
Aggregation of sales statistics (2020-2022) and macro-economic factor, and other secondary and primary research insights are utilized to arrive at base number and related market shares for 2022. The data gaps are identified in this step and relevant market data is analyzed, collected from paid primary interviews or databases. On finalizing the base year market size, forecasts are developed on the basis of macro-economic, industry and market growth factors and company level analysis.
- Data Triangulation and Final Review:
The market findings and base year market size calculations are validated from supply as well as demand side. Demand side validations are based on macro-economic factor analysis and benchmarks for respective regions and countries. In case of supply side validations, revenues of major companies are estimated (in case not available) based on industry benchmark, approximate number of employees, product portfolio, and primary interviews revenues are gathered. Further revenue from target product/service segment is assessed to avoid overshooting of market statistics. In case of heavy deviations between supply and demand side values, all thes steps are repeated to achieve synchronization.
We follow an iterative model, wherein we share our research findings with Subject Matter Experts (SME’s) and Key Opinion Leaders (KOLs) until consensus view of the market is not formulated – this model negates any drastic deviation in the opinions of experts. Only validated and universally acceptable research findings are quoted in our reports.
We have important check points that we use to validate our research findings – which we call – data triangulation, where we validate the information, we generate from secondary sources with primary interviews and then we re-validate with our internal data bases and Subject matter experts. This comprehensive model enables us to deliver high quality, reliable data in shortest possible time.

Sep 2019
Defense and Aerospace NAND and NOR Flash Memory Market
Size and Forecast (2021 - 2031), Global and Regional Share, Trend, and Growth Opportunity Analysis Report Coverage: By Flash Memory Type (NAND Flash Memory and NOR Flash Memory), NAND Flash Memory (SLC, MLC, TLC, and Others), NOR Flash Memory (Parallel NOR and Serial NOR), NAND Flash Memory Architecture (2D NAND and 3D NAND), NOR Flash Memory Density (Upto 2 MB, 4 MB to 64 MB, 128 MB to 512 MB, and Greater than 1 GB), NAND Flash Memory Density (Upto 2 GB, 4 GB to 64 GB, 128 GB to 512 GB, and Above 1 Tb), and Region (North America, Europe, Asia Pacific, Middle East and Africa, and South and Central America)
Sep 2019
Differential-Pressure Mass Flow Controller Market
Size and Forecast (2021 - 2031), Global and Regional Share, Trend, and Growth Opportunity Analysis Report Coverage: By Flow Rate (Low, Medium, and High), Application (Semiconductors, Food and Beverages Industry, Chemicals, Pharmaceutical and Healthcare Industry, Oil and Gas, and Others), and Geography (North America, Europe, Asia Pacific, Middle East and Africa, and South and Central America)
Sep 2019
Coriolis Mass Flow Controller Market
Size and Forecast (2021 - 2031), Global and Regional Share, Trend, and Growth Opportunity Analysis Report Coverage: By Flow Rate (Low, Medium and High), Application (Semiconductors, Food and Beverages Industry, Chemicals, Pharmaceutical and Healthcare Industry, Oil and Gas, and Others), and Geography (North America, Europe, Asia Pacific, Middle East and Africa, and South and Central America)
Sep 2019
Monoblock Refrigeration Unit for Cold Room Market
Size and Forecast (2021 - 2031), Global and Regional Share, Trend, and Growth Opportunity Analysis Report Coverage: By Mounting Type (Wall Mounted and Ceiling Mounted), Capacity [Between Ten and Thirty Cubic Meters (10-30 cu m), Less than Ten Cubic Meters (less than 10 cu m), and Greater than Thirty Cubic Meters (Greater than 30 cu m)], End-User Industry (Food Retail, HoReCa, Cold Chain Logistics, Pharmaceutical or Healthcare, and Others), and Geography (North America, Europe, Asia Pacific, Middle East & Africa, and South & Central America)
Sep 2019
Parallel SLC NAND Flash Memory Market
Size and Forecast (2021 - 2031), Global and Regional Share, Trend, and Growth Opportunity Analysis Report Coverage: By Density (Above 8 GB, 8 GB, 4 GB, 2 GB, and 1 GB), Application (Industrial, Automotive, Consumer Electronics, Computers and IT, Communication, and Others), and Geography (North America, Europe, Asia Pacific, Middle East & Africa, and South & Central America)
Sep 2019
Serial SLC NAND Flash Memory Market
Size and Forecast (2021 - 2031), Global and Regional Share, Trend, and Growth Opportunity Analysis Report Coverage: By Density (1GB, 2GB, 4GB, 8GB, and Above 8GB); Application (Automotive, Industrial, Communication, Computers and IT, Consumer Electronics, and Others); and Geography (North America, Europe, Asia Pacific, Middle East & Africa, and South & Central America)
Sep 2019
Vertical Carousels ASRS Market
Size and Forecast (2021 - 2031), Global and Regional Share, Trend, and Growth Opportunity Analysis Report Coverage: By Type (Assembly, Distribution, Kitting, Order Picking, Storage, and Others), End use Industry (Automotive, Food and Beverages, Electronic and Semiconductors, E-Commerce, Chemicals, Aerospace, Retail, Pharmaceuticals and Others), and Geography (North America, Europe, Asia Pacific, Middle East and Africa, and South and Central America)
Sep 2019
Unit Load ASRS Market
Size and Forecast (2021 - 2031), Global and Regional Share, Trend, and Growth Opportunity Analysis Report Coverage: By Type (Assembly, Distribution, Kitting, Order Picking, Storage, Others), End Use Industry (Automotive, Food & Beverage, Electronic & Semiconductors, E-commerce, Chemicals, Aerospace, Retail, Pharmaceutical, Others), and Region (North America, Europe, Asia Pacific, Middle East and Africa, and South and Central America)
 Get Free Sample For