Asia Pacific Robotic Refueling System Market Analysis and Opportunities by 2027
Asia Pacific Robotic Refueling System Market to 2027 - Regional Analysis and Forecasts by Component (Hardware, Software); Fuel (Gaseous Fuel, Gasoline, Diesel, Others); Industry Vertical (Aerospace and Defense, Automotive, Construction, Oil and Gas, Mining, Others); and Country
Historic Data: 2016-2017 | Base Year: 2018 | Forecast Period: 2019-2027- Report Date : Sep 2019
- Report Code : TIPRE00006678
- Category : Electronics and Semiconductor
- Status : Published
- Available Report Formats :


- No. of Pages : 130
Robotic refueling system market in the Asia Pacific is expected to grow from US$ 1.68 Mn in 2018 to US$ 24.06 Mn by the year 2027 with a CAGR of 36.1% from the year 2019 to 2027.
The mining industry to ensure robotic refueling systems formidable growth rate, which in turn is anticipated to propel the robotic refueling system market. In addition, the flexibility of dispensing different fuels and low cost of operation is going to act as a catalyst for the robotic refueling system market growth. Moreover, the emergence of AI-based autonomous cars is anticipated to offer significant growth opportunities for the robotic refueling system market in the forecast period. For decades, fuel pumps have been operated by humans, thus, raising the total operational cost of managing the store and the pump. An operator has already been assigned for the task of fueling and managing the monetary operations. A robotic fueling station would eliminate the need for a human to potentially dangerous petrochemical fumes, avoiding driver’s exposure to extreme cold or hot temperatures during fueling, and reducing the labor costs associated with full-service fueling stations. Additionally, fueling a diesel car with petrol or vice versa has always been the most careless mistake while refueling. Robotic refueling systems eliminate the chances of wrong fuelling accidents as each vehicle would have an RFID tag which would inform the refueling station regarding the type of fuel used such as petrol, diesel, or natural gas.
Robotic refueling system market by fuel is classified into gaseous fuel, gasoline, diesel, and others. Gasoline segment of robotic refueling system market led the market in 2018 and is expected to continue its dominance during the forecast period. Emission of harmful greenhouse gasses from gasoline engine after combustion, is considered to be the major factor contributing to the unpopularity of gasoline powered vehicles. It is expected that electric vehicle is going to replace much of the gasoline vehicle during the forecast period from 2019 - 2027 Thus, in the near future during the forecast period, it is expected that other clean energy sources such as gaseous fuels and electric is going to substitute for gasoline powered vehicle. However, the application of diesel powered vehicle cannot be replaced by other fuel type owing to a diesel engine’s low power to weight ration and low end torque. Thus all medium and heavy commercial vehicle along with off-highway trucks and machineries are expected to be powered by diesel.
The China dominated the robotic refueling system market in 2018 and is expected to dominate the market with the highest share in the Asia Pacific region through the forecast period. China has increasingly evolved as the second leading crude oil consumer and has ranked fifth in the world in terms of production. The oil & gas market is dominated by the local oil companies that contribute to over 75% of the production. Growing oil & gas industry is expected to increase the adoption of robotic refueling system as it helps the workers to stay far from the stations and reduces human intervention. On the other hand, China aims to be a moderately prosperous society in every aspect, including space technology. Therefore, the country was projected to launch 100 satellites by 2025. For this step, China invested a massive amount in making its own space station by 2022. Such investment by the country towards making the infrastructure fully automated will also require a robotic refueling system. The country projects to be fully developed, rich, and powerful nation by leading in innovation, outer space, and artificial intelligence. The figure given below highlights the revenue share of the Rest of Asia Pacific in the robotic refueling system market in the forecast period:
Rest of Asia Pacific Robotic Refueling System Market Revenue and Forecasts to 2027 (US$ Mn)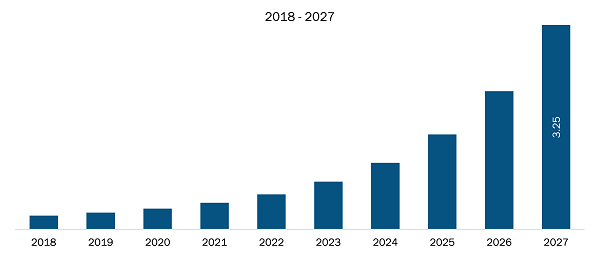
- This FREE sample will include data analysis, ranging from market trends to estimates and forecasts.
ASIA PACIFIC ROBOTIC REFUELING SYSTEM MARKET SEGMENTATION
By Fuel
- Gaseous Fuel
- Gasoline
- Diesel
- Others
By Component
- Hardware
- Software
By Industry Vertical
- Aerospace and Defense
- Automotive
- Construction
- Oil and Gas
- Mining
- Others
By Country
- China
- Japan
- South Korea
- Australia
- India
- Rest of APAC
Robotic Refueling System Market - Companies Mentioned
- ABB Ltd.
- Fanuc Corporation
- Fuelmatics AB
- Gazprom Neft PJSC
- Kuka AG
- Neste
- Rotec Engineering
- Scott Technology Limited
- Shaw Development LLC
- Yaskawa Electric Corporation
Asia Pacific Robotic Refueling System Report Scope
| Report Attribute | Details |
|---|---|
| Market size in 2018 | US$ 1.68 Million |
| Market Size by 2027 | US$ 24.06 Million |
| CAGR (2019 - 2027) | 36.1% |
| Historical Data | 2016-2017 |
| Forecast period | 2019-2027 |
| Segments Covered |
By Component
|
| Regions and Countries Covered |
Asia-Pacific
|
| Market leaders and key company profiles |
|

- Historical Analysis (2 Years), Base Year, Forecast (7 Years) with CAGR
- PEST and SWOT Analysis
- Market Size Value / Volume - Regional, Country
- Industry and Competitive Landscape
- Excel Dataset
Recent Reports
Testimonials
The Insight Partners' SCADA System Market report is comprehensive, with valuable insights on current trends and future forecasts. The team was highly professional, responsive, and supportive throughout. We are very satisfied and highly recommend their services.
RAN KEDEM Partner, Reali Technologies LTDsI requested a report on a very specific software market and the team produced the report in a few days. The information was very relevant and well presented. I then requested some changes and additions to the report. The team was again very responsive and I got the final report in less than a week.
JEAN-HERVE JENN Chairman, Future AnalyticaWe worked with The Insight Partners for an important market study and forecast. They gave us clear insights into opportunities and risks, which helped shape our plans. Their research was easy to use and based on solid data. It helped us make smart, confident decisions. We highly recommend them.
PIYUSH NAGPAL Sr. Vice President, High Beam GlobalThe Insight Partners delivered insightful, well-structured market research with strong domain expertise. Their team was professional and responsive throughout. The user-friendly website made accessing industry reports seamless. We highly recommend them for reliable, high-quality research services
YUKIHIKO ADACHI CEO, Deep Blue, LLC.This is the first time I have purchased a market report from The Insight Partners.While I was unsure at first, I visited their web site and felt more comfortable to take the risk and purchase a market report.I am completely satisfied with the quality of the report and customer service. I had several questions and comments with the initial report, but after a couple of dialogs over email with their analyst I believe I have a report that I can use as input to our strategic planning process.Thank you so much for taking the extra time and making this a positive experience.I will definitely recommend your service to others and you will be my first call when we need further market data.
JOHN SUZUKI President and Chief Executive Officer, Board Director, BK TechnologiesI wish to appreciate your support and the professionalism you displayed in the course of attending to my request for information regarding to infectious disease IVD market in Nigeria. I appreciate your patience, your guidance, and the fact that you were willing to offer a discount, which eventually made it possible for us to close a deal. I look forward to engaging The Insight Partners in the future, all thanks to the impression you have created in me as a result of this first encounter.
DR CHIJIOKE ONYIA MANAGING DIRECTOR, PineCrest Healthcare Ltd.Reason to Buy
- Informed Decision-Making
- Understanding Market Dynamics
- Competitive Analysis
- Identifying Emerging Markets
- Customer Insights
- Market Forecasts
- Risk Mitigation
- Boosting Operational Efficiency
- Strategic Planning
- Investment Justification
- Tracking Industry Innovations
- Aligning with Regulatory Trends


 Get Free Sample For