North America 3D Mapping and Modelling Market Analysis, Size, and Share by 2028
North America 3D Mapping and Modelling Market Forecast to 2028 - COVID-19 Impact and Regional Analysis By Deployment Mode (Cloud and On-Premises), Organization Size (SMEs and Large Enterprises), Component (Software Tools and Services), 3D Mapping Application (Inspection and Measurement, Object Reconstruction, Projection and Navigation, Reporting and Virtualization, and Other 3D Mapping Applications), 3D Modelling Application (Product Marketing, Animation and Movies, Gaming and Designing, Architectural Rendering, and Other 3D Modelling Applications), and Vertical (Retail and Consumer Goods, Engineering and Construction, Healthcare and Life Sciences, Transportation and Logistics, Government and Defence, Energy and Utilities, Media and Entertainment, Manufacturing, and Other Verticals)
- Report Date : May 2021
- Report Code : TIPRE00022187
- Category : Technology, Media and Telecommunications
- Status : Published
- Available Report Formats :


- No. of Pages : 179
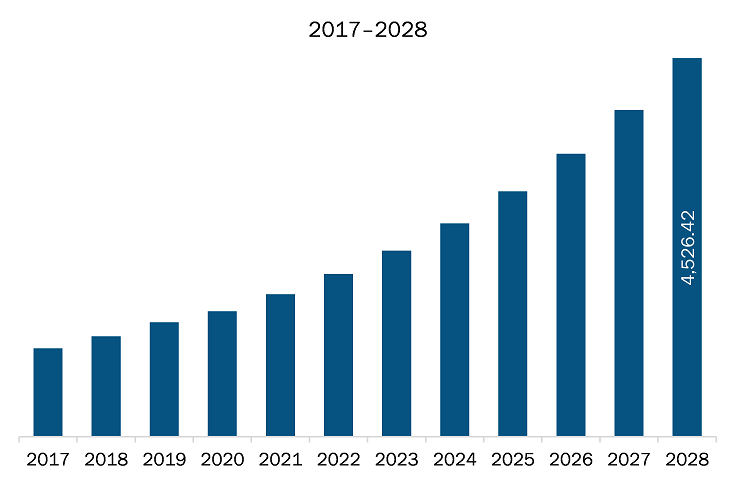
The 3D mapping and modelling market in North America is expected to grow from US$ 1500.17 million in 2020 to US$ 4526.42 million by 2028; it is estimated to grow at a CAGR of 15.0% from 2021 to 2028.
The US, Canada, and Mexico are economies in North America. Rising Demand for 3D Animation. Owing to the incremental advancement in processing power of microprocessors, especially for graphical applications, the previous decade witnessed a significant deployment of 3D content. Initially, 3D contents were limited to videos, however the technological advancements in displays and chips have led to the deployment of 3D content in application, software, and games to deliver enhanced user experience. Game and software developers are leveraging various 3D mapping and modelling tools to deliver enhanced visual and user experience for their customers. Further, the COVID-19 pandemic has fueled the gaming industry as masses were confined to follow social distancing, which subsequently resulted in increasing number of gamers. Therefore, game developers such as Activision Blizzard and Electronic Arts witnessed greater year-over-year revenues and higher market penetration than ever before. Moreover, affordable prices of smartphones and internet coupled with the enhanced graphic processing power of smartphones is among the other factors, which is driving the growth of the 3D mapping and modelling market. The growing adoption of smartphone devices across the world has flourished the mobile gaming industry is also bolstering the growth of the industry. Thus, the growth in the sector is expected to create a significant demand for 3D mapping and modelling market in the coming years, which is further anticipated to drive the market in North America.North America is well-known for the adoption of new technologies owing to favourable government policies to boost innovation, presence of various technological companies, and high adoption of advanced technologies in various industry verticals especially in developed countries such as Canada and the US. Thus, any negative impact on the growth of industries is expected to hamper the economic growth of the region. The US, Canada, and Mexico have witnessed a significant rise in the number of COVID-19 infected patients. This has forced the governments to impose lockdowns to limit human movement, thereby leading the manufacturing, construction, transport, and warehouses facilities to experience lower than usual production volumes, which is negatively impacting the adoption rate of 3D mapping and modelling tools.
- Sample PDF showcases the content structure and the nature of the information with qualitative and quantitative analysis.
- Request discounts available for Start-Ups & Universities
North America 3D Mapping and Modelling Market Segmentation
North America 3D Mapping and Modelling Market – By Deployment Type
- Cloud
- On-premises
North America 3D Mapping and Modelling Market – By Organization Size
- SMEs
- Large Enterprises
North America 3D Mapping and Modelling Market – By Component
Software Tools
North America 3D Mapping and Modelling Market – By3D Mapping Application
- Inspection and Measurement
- Object Reconstruction
- Projection and Navigation
- Reporting and Virtualization
- Others 3D Mapping Applications
North America 3D Mapping and Modelling Market – By 3D Modelling Application
- Product Marketing
- Animation and Movies
- Gaming and Designing
- Architectural Rendering
- Other 3D Modelling Applications
North America 3D Mapping and Modelling Market – By Vertical
- Retail and Consumer Goods
- Engineering and Construction
- Healthcare and Life Sciences
- Transportation and Logistics
- Government and Defence
- Energy and Utilities
- Media and Entertainment
- Manufacturing
- Other Verticals
North America 3D Mapping and Modelling Market – By Country
- US
- Canada
- Mexico
North America 3D Mapping and Modelling Market-Companies Mentioned
- Golden Software, LLC
- CyberCity 3D, Inc.
- Pix4D SA
- Pixologic, Inc.
- Flight Evolved
- Maxon Computer GmbH
- WRLD
- GeoDigital
- GeoSLAM
- Mapbox
- DeepMap
- Civil Maps
- Hivemapper Inc.
- Dynamic Map Platform Co., Ltd
- Bentley Systems Incorporated
- Alphabet Inc.
- Esri
- Autodesk, Inc.
- Intermap Technologies
- The Foundry Visionmongers Limited
- Trimble Inc
- SaaB AB
- Dassault Systèmes SE
- Adobe
- Mitsubishi Electric Corporation
- Topcon Corporation
- Apple Inc

Report Coverage
Revenue forecast, Company Analysis, Industry landscape, Growth factors, and Trends

Segment Covered
Deployment Mode, Organization Size, Component, 3D Mapping Application, 3D Modelling Application, and Vertical

Regional Scope
North America, Europe, Asia Pacific, Middle East & Africa, South & Central America

Country Scope
US, Canada
1. Introduction
1.1 Study Scope
1.2 The Insight Partners Research Report Guidance
1.3 Market Segmentation
1.3.1 3D Mapping and Modelling Market – By Deployment
1.3.2 3D Mapping and Modelling Market – By Organization Size
1.3.3 3D Mapping and Modelling Market – By Component
1.3.4 3D Mapping and Modelling Market – By 3D Mapping Application
1.3.5 3D Mapping and Modelling Market – By 3D Modelling Application
1.3.6 3D Mapping and Modelling Market – By Vertical
1.3.7 3D Mapping and Modelling Market- By Country
2. Key Takeaways
3. Research Methodology
3.1 Coverage
3.2 Secondary Research
3.3 Primary Research
4. North America 3D Mapping and Modelling Market Landscape
4.1 Market Overview
4.2 PEST Analysis
4.2.1 North America
4.2.2 Ecosystem Analysis
4.3 Expert Opinions
5. 3D Mapping and Modelling Market – Key Market Dynamics
5.1 Key Market Drivers
5.1.1 Emerging Demand for 3D Animation
5.1.2 Continuous Technological Advancements in 3D Mapping and Modelling Tools
5.2 Key Market Restraints
5.2.1 Lack of Skilled Workforce and Supporting Infrastructure in Developing Regions
5.3 Key Market Opportunities
5.3.1 High Growth Potential in Small & Medium-Sized Enterprises (SMEs)
5.4 Future Trends
5.4.1 Increasing Adoption of Cloud Solutions for High Scalability and Flexibility
5.5 Impact Analysis of Drivers and Restraints
6. 3D Mapping and Modelling Market – North America Analysis
6.1 3D Mapping and Modelling Market North America Overview
6.2 3D Mapping and Modelling Market – North America Revenue and Forecast to 2028 (US$ Million)
7. North America 3D Mapping and Modelling Market Analysis – By Component
7.1 Overview
7.2 North America 3D Mapping and Modelling Market, By Component (2020 and 2028)
7.3 Software Tools
7.3.1 Overview
7.3.2 Software Tools: North America 3D Mapping and Modelling Market – Revenue and Forecast to 2028 (US$ Million)
7.3.2.1 3D Mapping
7.3.2.1.1 Overview
7.3.2.1.2 3D Mapping: North America 3D Mapping and Modelling Market- Revenue and Forecast to 2028 (US$ Million)
7.3.2.2 3D Modelling
7.3.2.2.1 Overview
7.3.2.2.2 3D Modelling: 3D Mapping and Modelling Market- Revenue and Forecast to 2028 (US$ Million)
7.4 Services
7.4.1 Overview
7.4.2 Services: 3D Mapping and Modelling: 3D Mapping and Modelling Market– Revenue and Forecast to 2028 (US$ Million)
7.4.2.1 Professional Services
7.4.2.1.1 Overview
7.4.2.1.2 Professional Services: 3D Mapping and Modelling Market- Revenue and Forecast to 2028 (US$ Million)
7.4.2.2 Managed Services
7.4.2.2.1 Overview
7.4.2.2.2 Managed Services: 3D Mapping and Modelling Market- Revenue and Forecast to 2028 (US$ Million)
8. North America 3D Mapping and Modelling Market – By 3D Mapping Application
8.1 Overview
8.2 North America 3D Mapping and Modelling Market, by 3D Mapping Application (2020 and 2028)
8.3 Inspection and Measurement
8.3.1 Overview
8.3.2 Inspection and Measurement: North America 3D Mapping and Modelling Market – Revenue and Forecast to 2028 (US$ Million)
8.4 Object Reconstruction
8.4.1 Overview
8.4.2 Object Reconstruction: North America 3D Mapping and Modelling Market – Revenue and Forecast to 2028 (US$ Million)
8.5 Projection and Navigation
8.5.1 Overview
8.5.2 Projection and Navigation: North America 3D Mapping and Modelling Market – Revenue and Forecast to 2028 (US$ Million)
8.6 Reporting and Virtualization
8.6.1 Overview
8.6.2 Reporting and Virtualization: North America 3D Mapping and Modelling Market – Revenue and Forecast to 2028 (US$ Million)
8.7 Other 3D Mapping Applications
8.7.1 Overview
8.7.2 North America Other 3D Mapping Applications Market – Revenue and Forecast to 2028 (US$ Million)
9. North America 3D Mapping and Modelling Market – By 3D Modelling Application
9.1 Overview
9.2 North America 3D Mapping and Modelling Market, by 3D Modelling Application (2020 and 2028)
9.3 Product Marketing
9.3.1 Overview
9.3.2 Product Marketing: North America 3D Mapping and Modelling Market – Revenue and Forecast to 2028 (US$ Million)
9.4 Animation & Movies
9.4.1 Overview
9.4.2 Animation & Movies: North America 3D Mapping and Modelling Market – Revenue and Forecast to 2028 (US$ Million)
9.5 Gaming and Designing
9.5.1 Overview
9.5.2 Gaming and Designing: North America 3D Mapping and Modelling Market – Revenue and Forecast to 2028 (US$ Million)
9.6 Architectural Rendering
9.6.1 Overview
9.6.2 Architectural Rendering: North America 3D Mapping and Modelling Market – Revenue and Forecast to 2028 (US$ Million)
9.7 Other 3D Modelling Application
9.7.1 Overview
9.7.2 North America Other 3D Modelling Application Market – Revenue and Forecast to 2028 (US$ Million)
10. North America 3D Mapping and Modelling Market – By Deployment Type
10.1 Overview
10.2 North America 3D Mapping and Modelling Market, by Deployment Type (2020 and 2028)
10.3 Cloud
10.3.1 Overview
10.3.2 Cloud: North America 3D Mapping and Modelling Market – Revenue and Forecast to 2028 (US$ Million)
10.4 On-premises
10.4.1 Overview
10.4.2 On-premises: North America 3D Mapping and Modelling Market – Revenue and Forecast to 2028 (US$ Million)
11. North America 3D Mapping and Modelling Market – By Organization Size
11.1 Overview
11.2 North America 3D Mapping and Modelling Market, by Organization Size (2020 and 2028)
11.3 SMEs
11.3.1 Overview
11.3.2 SMEs : North America 3D Mapping and Modelling Market- Revenue and Forecast to 2028 (US$ Million)
11.4 Large Enterprises
11.4.1 Overview
11.4.2 Large Enterprises: North America 3D Mapping and Modelling Market- Revenue and Forecast to 2028 (US$ Million)
12. North America 3D Mapping and Modelling Market – By Vertical
12.1 Overview
12.2 North America 3D Mapping and Modelling Market, by Vertical (2020 and 2028)
12.3 Retail and Consumer Goods
12.3.1 Overview
12.3.2 Retail and Consumer Goods : North America 3D Mapping and Modelling Market- Revenue and Forecast to 2028 (US$ Million)
12.4 Engineering and Construction
12.4.1 Overview
12.4.2 Engineering and Construction : North America 3D Mapping and Modelling Market- Revenue and Forecast to 2028 (US$ Million)
12.5 Healthcare and Life Sciences
12.5.1 Overview
12.5.2 Healthcare and Life Sciences : North America 3D Mapping and Modelling Market- Revenue and Forecast to 2028 (US$ Million)
12.6 Transportation and Logistics
12.6.1 Overview
12.6.2 Transportation and Logistics : North America 3D Mapping and Modelling Market- Revenue and Forecast to 2028 (US$ Million)
12.7 Government and Defence
12.7.1 Overview
12.7.2 Government and Defence : North America 3D Mapping and Modelling Market- – Revenue and Forecast to 2028 (US$ Million)
12.8 Energy and Utilities
12.8.1 Overview
12.8.2 Energy and Utilities : North America 3D Mapping and Modelling Market- Revenue and Forecast to 2028 (US$ Million)
12.9 Media and Entertainment
12.9.1 Overview
12.9.2 Media and Entertainment : North America 3D Mapping and Modelling Market- Revenue and Forecast to 2028 (US$ Million)
12.10 Manufacturing
12.10.1 Overview
12.10.2 Manufacturing : North America 3D Mapping and Modelling Market- Revenue and Forecast to 2028 (US$ Million)
12.11 Other Verticals
12.11.1 Overview
12.11.2 Other Verticals : North America 3D Mapping and Modelling Market- Revenue and Forecast to 2028 (US$ Million)
13. North America 3D Mapping and Modelling Market – Country Analysis
13.1 Overview
13.1.1 North America: 3D Mapping and Modelling Market – Revenue and Forecast to 2028 (US$ Million)
13.1.2 North America: 3D Mapping and Modelling Market- by Key Country
13.1.2.1 US: 3D Mapping and Modelling Market – Revenue and Forecast to 2028 (US$ Million)
13.1.2.1.1 US: 3D Mapping and Modelling Market- by Component
13.1.2.1.2 US: 3D Mapping and Modelling Market- By 3D Mapping Application
13.1.2.1.3 US: 3D Mapping and Modelling Market- By 3D Modelling Application
13.1.2.1.4 US: 3D Mapping and Modelling Market- By Deployment Mode
13.1.2.1.5 US: 3D Mapping and Modelling Market- By Organization Size
13.1.2.1.6 US: 3D Mapping and Modelling Market- By Vertical
13.1.2.2 Canada: 3D Mapping and Modelling Market – Revenue and Forecast to 2028 (US$ Million)
13.1.2.2.1 Canada: 3D Mapping and Modelling Market- by Component
13.1.2.2.2 Canada: 3D Mapping and Modelling Market- By 3D Mapping Application
13.1.2.2.3 Canada: 3D Mapping and Modelling Market- By 3D Modelling Application
13.1.2.2.4 Canada: 3D Mapping and Modelling Market- By Deployment Mode
13.1.2.2.5 Canada: 3D Mapping and Modelling Market- By Organization Size
13.1.2.2.6 Canada: 3D Mapping and Modelling Market- By Vertical
13.1.2.3 Mexico: 3D Mapping and Modelling Market – Revenue and Forecast to 2028 (US$ Million)
13.1.2.3.1 Mexico: 3D Mapping and Modelling Market- by Component
13.1.2.3.2 Mexico: 3D Mapping and Modelling Market- By 3D Mapping Application
13.1.2.3.3 Mexico: 3D Mapping and Modelling Market- By 3D Modelling Application
13.1.2.3.4 Mexico: 3D Mapping and Modelling Market- By Deployment Mode
13.1.2.3.5 Mexico: 3D Mapping and Modelling Market- By Organization Size
13.1.2.3.6 Mexico: 3D Mapping and Modelling Market- By Vertical
14. North America 3D Mapping and Modelling Market- COVID-19 Impact Analysis
14.1 North America
15. North America 3D Mapping and Modelling Market-Industry Landscape
15.1 Overview
15.2 Market Initiative
15.3 New Development
15.4 Merger and Acquisition
16. Company Profiles
16.1 Golden Software, LLC
16.1.1 Key Facts
16.1.2 Business Description
16.1.3 Products and Services
16.1.4 Financial Overview
16.1.5 SWOT Analysis
16.1.6 Key Developments
16.2 CyberCity 3D, Inc.
16.2.1 Key Facts
16.2.2 Business Description
16.2.3 Products and Services
16.2.4 Financial Overview
16.2.5 SWOT Analysis
16.2.6 Key Developments
16.3 Pix4D SA
16.3.1 Key Facts
16.3.2 Business Description
16.3.3 Products and Services
16.3.4 Financial Overview
16.3.5 SWOT Analysis
16.3.6 Key Developments
16.4 Pixologic, Inc.
16.4.1 Key Facts
16.4.2 Business Description
16.4.3 Products and Services
16.4.4 Financial Overview
16.4.5 SWOT Analysis
16.4.6 Key Developments
16.5 Flight Evolved
16.5.1 Key Facts
16.5.2 Business Description
16.5.3 Products and Services
16.5.4 Financial Overview
16.5.5 SWOT Analysis
16.5.6 Key Developments
16.6 Maxon Computer GmbH
16.6.1 Key Facts
16.6.2 Business Description
16.6.3 Products and Services
16.6.4 Financial Overview
16.6.5 SWOT Analysis
16.6.6 Key Developments
16.7 WRLD
16.7.1 Key Facts
16.7.2 Business Description
16.7.3 Products and Services
16.7.4 Financial Overview
16.7.5 SWOT Analysis
16.7.6 Key Developments
16.8 GeoDigital
16.8.1 Key Facts
16.8.2 Business Description
16.8.3 Products and Services
16.8.4 Financial Overview
16.8.5 SWOT Analysis
16.8.6 Key Developments
16.9 GeoSLAM
16.9.1 Key Facts
16.9.2 Business Description
16.9.3 Products and Services
16.9.4 Financial Overview
16.9.5 SWOT Analysis
16.9.6 Key Developments
16.10 Mapbox
16.10.1 Key Facts
16.10.2 Business Description
16.10.3 Products and Services
16.10.4 Financial Overview
16.10.5 SWOT Analysis
16.10.6 Key Developments
16.11 DeepMap
16.11.1 Key Facts
16.11.2 Business Description
16.11.3 Products and Services
16.11.4 Financial Overview
16.11.5 SWOT Analysis
16.11.6 Key Developments
16.12 Civil Maps
16.12.1 Key Facts
16.12.2 Business Description
16.12.3 Products and Services
16.12.4 Financial Overview
16.12.5 SWOT Analysis
16.12.6 Key Developments
16.13 Hivemapper Inc.
16.13.1 Key Facts
16.13.2 Business Description
16.13.3 Products and Services
16.13.4 Financial Overview
16.13.5 SWOT Analysis
16.13.6 Key Developments
16.14 Dynamic Map Platform Co., Ltd.
16.14.1 Key Facts
16.14.2 Business Description
16.14.3 Products and Services
16.14.4 Financial Overview
16.14.5 SWOT Analysis
16.14.6 Key Developments
16.15 Bentley Systems Incorporated
16.15.1 Key Facts
16.15.2 Business Description
16.15.3 Products and Services
16.15.4 Financial Overview
16.15.5 SWOT Analysis
16.15.6 Key Developments
16.16 Alphabet Inc.
16.16.1 Key Facts
16.16.2 Business Description
16.16.3 Products and Services
16.16.4 Financial Overview
16.16.5 SWOT Analysis
16.16.6 Key Developments
16.17 Esri
16.17.1 Key Facts
16.17.2 Business Description
16.17.3 Products and Services
16.17.4 Financial Overview
16.17.5 SWOT Analysis
16.17.6 Key Developments
16.18 Autodesk, Inc.
16.18.1 Key Facts
16.18.2 Business Description
16.18.3 Products and Services
16.18.4 Financial Overview
16.18.5 SWOT Analysis
16.18.6 Key Developments
16.19 Intermap Technologies
16.19.1 Key Facts
16.19.2 Business Description
16.19.3 Products and Services
16.19.4 Financial Overview
16.19.5 SWOT Analysis
16.19.6 Key Developments
16.20 The Foundry Visionmongers Limited
16.20.1 Key Facts
16.20.2 Business Description
16.20.3 Products and Services
16.20.4 Financial Overview
16.20.5 SWOT Analysis
16.20.6 Key Developments
16.21 Trimble Inc.
16.21.1 Key Facts
16.21.2 Business Description
16.21.3 Products and Services
16.21.4 Financial Overview
16.21.5 SWOT Analysis
16.21.6 Key Developments
16.22 SaaB AB
16.22.1 Key Facts
16.22.2 Business Description
16.22.3 Products and Services
16.22.4 Financial Overview
16.22.5 SWOT Analysis
16.22.6 Key Developments
16.23 Dassault Systèmes SE
16.23.1 Key Facts
16.23.2 Business Description
16.23.3 Products and Services
16.23.4 Financial Overview
16.23.5 SWOT Analysis
16.23.6 Key Developments
16.24 Adobe
16.24.1 Key Facts
16.24.2 Business Description
16.24.3 Products and Services
16.24.4 Financial Overview
16.24.5 SWOT Analysis
16.24.6 Key Developments
16.25 Mitsubishi Electric Corporation
16.25.1 Key Facts
16.25.2 Business Description
16.25.3 Products and Services
16.25.4 Financial Overview
16.25.5 SWOT Analysis
16.25.6 Key Developments
16.26 Topcon Corporation
16.26.1 Key Facts
16.26.2 Business Description
16.26.3 Products and Services
16.26.4 Financial Overview
16.26.5 SWOT Analysis
16.26.6 Key Developments
16.27 Apple Inc.
16.27.1 Key Facts
16.27.2 Business Description
16.27.3 Products and Services
16.27.4 Financial Overview
16.27.5 SWOT Analysis
16.27.6 Key Developments
17. Appendix
17.1 About The Insight Partners
17.2 Word Index
LIST OF TABLES
Table 1. 3D Mapping and Modelling Market – Revenue, and Forecast to 2028 (US$ Million)
Table 2. US: 3D Mapping and Modelling Market- by Component –Revenue and Forecast to 2028 (US$ Million)
Table 3. US: 3D Mapping and Modelling Market- by Software Tools – Revenue and Forecast to 2028 (US$ Million)
Table 4. US: 3D Mapping and Modelling Market- by Services– Revenue and Forecast to 2028 (US$ Million)
Table 5. US: 3D Mapping and Modelling Market- By 3D Mapping Application –Revenue and Forecast to 2028 (US$ Million)
Table 6. US: 3D Mapping and Modelling Market- By 3D Modelling Application –Revenue and Forecast to 2028 (US$ Million)
Table 7. US: 3D Mapping and Modelling Market- By Deployment Mode –Revenue and Forecast to 2028 (US$ Million)
Table 8. US: 3D Mapping and Modelling Market- By Organization Size –Revenue and Forecast to 2028 (US$ Million)
Table 9. US: 3D Mapping and Modelling Market- By Vertical –Revenue and Forecast to 2028 (US$ Million)
Table 10. Canada: 3D Mapping and Modelling Market- by Component –Revenue and Forecast to 2028 (US$ Million)
Table 11. Canada: 3D Mapping and Modelling Market- by Software Tools – Revenue and Forecast to 2028 (US$ Million)
Table 12. Canada: 3D Mapping and Modelling Market- by Services– Revenue and Forecast to 2028 (US$ Million)
Table 13. Canada: 3D Mapping and Modelling Market- By 3D Mapping Application –Revenue and Forecast to 2028 (US$ Million)
Table 14. Canada: 3D Mapping and Modelling Market- By 3D Modelling Application –Revenue and Forecast to 2028 (US$ Million)
Table 15. Canada: 3D Mapping and Modelling Market- By Deployment Mode –Revenue and Forecast to 2028 (US$ Million)
Table 16. Canada: 3D Mapping and Modelling Market- By Organization Size –Revenue and Forecast to 2028 (US$ Million)
Table 17. Canada: 3D Mapping and Modelling Market- By Vertical –Revenue and Forecast to 2028 (US$ Million)
Table 18. Mexico: 3D Mapping and Modelling Market- by Component –Revenue and Forecast to 2028 (US$ Million)
Table 19. Mexico: 3D Mapping and Modelling Market- by Software Tools – Revenue and Forecast to 2028 (US$ Million)
Table 20. Mexico: 3D Mapping and Modelling Market- by Services– Revenue and Forecast to 2028 (US$ Million)
Table 21. Mexico: 3D Mapping and Modelling Market- By 3D Mapping Application –Revenue and Forecast to 2028 (US$ Million)
Table 22. Mexico: 3D Mapping and Modelling Market- By 3D Modelling Application –Revenue and Forecast to 2028 (US$ Million)
Table 23. Mexico: 3D Mapping and Modelling Market- By Deployment Mode –Revenue and Forecast to 2028 (US$ Million)
Table 24. Mexico: 3D Mapping and Modelling Market- By Organization Size –Revenue and Forecast to 2028 (US$ Million)
Table 25. Mexico: 3D Mapping and Modelling Market- By Vertical –Revenue and Forecast to 2028 (US$ Million)
Table 26. List of Abbreviation
LIST OF FIGURES
Figure 1. North America 3D Mapping and Modelling Market Segmentation
Figure 2. North America 3D Mapping and Modelling Market Segmentation – By Country
Figure 3. North America 3D Mapping and Modelling Market Overview
Figure 4. Software Tools Segment Held the Largest Market Share in 2020
Figure 5. On-Premises Held the Largest Market Share in 2020
Figure 6. Large Enterprises Held the Largest Market Share in 2020
Figure 7. Engineering and Construction Industry Held the Largest Market Share in 2020
Figure 8. US was the Largest Revenue Contributor in 2020
Figure 9. North America – PEST Analysis
Figure 10. North America 3D Mapping and Modelling Market– Ecosystem Analysis
Figure 11. Expert Opinions
Figure 12. North America 3D Mapping and Modelling Market Impact Analysis of Drivers and Restraints
Figure 13. North America 3D Mapping and Modelling Market – Revenue and Forecast to 2028 (US$ Million)
Figure 14. North America 3D Mapping and Modelling Market Revenue Share, by Component (2020 and 2028)
Figure 15. Software Tools: North America 3D Mapping and Modelling Market – Revenue and Forecast to 2028 (US$ Million)
Figure 1. 3D Mapping: North America 3D Mapping and Modelling Market- Revenue and Forecast to 2028 (US$ Million)
Figure 2. 3D Modelling: 3D Mapping and Modelling Market- Revenue and Forecast to 2028 (US$ Million)
Figure 3. Services: 3D Mapping and Modelling: 3D Mapping and Modelling Market– Revenue and Forecast to 2028 (US$ Million)
Figure 4. Professional Services: 3D Mapping and Modelling Market- Revenue and Forecast to 2028 (US$ Million)
Figure 5. Managed Services: 3D Mapping and Modelling Market- Revenue and Forecast to 2028 (US$ Million)
Figure 6. North America 3D Mapping and Modelling Market Revenue Share, by 3D Mapping Application (2020 and 2028)
Figure 7. Inspection and Measurement: North America 3D Mapping and Modelling Market – Revenue and Forecast to 2028 (US$ Million)
Figure 8. Object Reconstruction: North America 3D Mapping and Modelling Market – Revenue and Forecast to 2028 (US$ Million)
Figure 9. Projection and Navigation: North America 3D Mapping and Modelling Market – Revenue and Forecast to 2028 (US$ Million)
Figure 10. Reporting and Virtualization: North America 3D Mapping and Modelling Market – Revenue and Forecast to 2028 (US$ Million)
Figure 11. North America Other 3D Mapping Applications Market – Revenue and Forecast to 2028 (US$ Million)
Figure 12. North America 3D Mapping and Modelling Market Revenue Share, by 3D Modelling Application (2020 and 2028)
Figure 13. Product Marketing: North America 3D Mapping and Modelling Market – Revenue and Forecast to 2028 (US$ Million)
Figure 14. Animation & Movies: North America 3D Mapping and Modelling Market – Revenue and Forecast to 2028 (US$ Million)
Figure 15. Gaming and Designing: North America 3D Mapping and Modelling Market – Revenue and Forecast to 2028 (US$ Million)
Figure 16. Architectural Rendering: North America 3D Mapping and Modelling Market – Revenue and Forecast to 2028 (US$ Million)
Figure 17. North America Other 3D Modelling Application Market – Revenue and Forecast to 2028 (US$ Million)
Figure 18. North America 3D Mapping and Modelling Market Revenue Share, by Deployment Type (2020 and 2028)
Figure 19. Cloud: North America 3D Mapping and Modelling Market – Revenue and Forecast to 2028 (US$ Million)
Figure 20. On-premises: North America 3D Mapping and Modelling Market – Revenue and Forecast to 2028 (US$ Million)
Figure 21. North America 3D Mapping and Modelling Market Revenue Share, by Organization Size (2020 and 2028)
Figure 22. SMEs : North America 3D Mapping and Modelling Market- Revenue and Forecast to 2028 (US$ Million)
Figure 23. Large Enterprises: North America 3D Mapping and Modelling Market- Revenue and Forecast to 2028 (US$ Million)
Figure 24. North America 3D Mapping and Modelling Market Revenue Share, by Vertical (2020 and 2028)
Figure 25. Retail and Consumer Goods : North America 3D Mapping and Modelling Market- Revenue and Forecast to 2028 (US$ Million)
Figure 26. Engineering and Construction : North America 3D Mapping and Modelling Market- Revenue and Forecast to 2028 (US$ Million)
Figure 27. Healthcare and Life Sciences : North America 3D Mapping and Modelling Market- Revenue and Forecast to 2028 (US$ Million)
Figure 28. Transportation and Logistics : North America 3D Mapping and Modelling Market- Revenue and Forecast to 2028 (US$ Million)
Figure 29. Government and Defense : North America 3D Mapping and Modelling Market- Revenue and Forecast to 2028 (US$ Million)
Figure 30. Energy and Utilities: North America 3D Mapping and Modelling Market- Revenue and Forecast to 2028 (US$ Million)
Figure 31. Media and Entertainment : North America 3D Mapping and Modelling Market- Revenue and Forecast to 2028 (US$ Million)
Figure 32. Manufacturing : North America 3D Mapping and Modelling Market– Revenue and Forecast to 2028 (US$ Million)
Figure 33. Other Verticals : North America 3D Mapping and Modelling Market- Revenue and Forecast to 2028 (US$ Million)
Figure 34. North America: 3D Mapping and Modelling Market – Revenue by Countryt to 2028 (US$ Million)
Figure 35. North America: 3D Mapping and Modelling Market Revenue Share, by Key Country (2020 and 2028)
Figure 36. US: 3D Mapping and Modelling Market – Revenue and Forecast to 2028 (US$ Million)
Figure 37. Canada: 3D Mapping and Modelling Market – Revenue and Forecast to 2028 (US$ Million)
Figure 38. Mexico: 3D Mapping and Modelling Market – Revenue and Forecast to 2028 (US$ Million)
Figure 39. Impact Of COVID-19 Pandemic in North American Country Markets
- Golden Software, LLC
- CyberCity 3D, Inc.
- Pix4D SA
- Pixologic, Inc.
- Flight Evolved
- Maxon Computer GmbH
- WRLD
- GeoDigital
- GeoSLAM
- Mapbox
- DeepMap
- Civil Maps
- Hivemapper Inc.
- Dynamic Map Platform Co., Ltd
- Bentley Systems Incorporated
- Alphabet Inc.
- Esri
- Autodesk, Inc.
- Intermap Technologies
- The Foundry Visionmongers Limited
- Trimble Inc
- SaaB AB
- Dassault Systèmes SE
- Adobe
- Mitsubishi Electric Corporation
- Topcon Corporation
- Apple Inc
The Insight Partners performs research in 4 major stages: Data Collection & Secondary Research, Primary Research, Data Analysis and Data Triangulation & Final Review.
- Data Collection and Secondary Research:
As a market research and consulting firm operating from a decade, we have published many reports and advised several clients across the globe. First step for any study will start with an assessment of currently available data and insights from existing reports. Further, historical and current market information is collected from Investor Presentations, Annual Reports, SEC Filings, etc., and other information related to company’s performance and market positioning are gathered from Paid Databases (Factiva, Hoovers, and Reuters) and various other publications available in public domain.
Several associations trade associates, technical forums, institutes, societies and organizations are accessed to gain technical as well as market related insights through their publications such as research papers, blogs and press releases related to the studies are referred to get cues about the market. Further, white papers, journals, magazines, and other news articles published in the last 3 years are scrutinized and analyzed to understand the current market trends.
- Primary Research:
The primarily interview analysis comprise of data obtained from industry participants interview and answers to survey questions gathered by in-house primary team.
For primary research, interviews are conducted with industry experts/CEOs/Marketing Managers/Sales Managers/VPs/Subject Matter Experts from both demand and supply side to get a 360-degree view of the market. The primary team conducts several interviews based on the complexity of the markets to understand the various market trends and dynamics which makes research more credible and precise.
A typical research interview fulfils the following functions:
- Provides first-hand information on the market size, market trends, growth trends, competitive landscape, and outlook
- Validates and strengthens in-house secondary research findings
- Develops the analysis team’s expertise and market understanding
Primary research involves email interactions and telephone interviews for each market, category, segment, and sub-segment across geographies. The participants who typically take part in such a process include, but are not limited to:
- Industry participants: VPs, business development managers, market intelligence managers and national sales managers
- Outside experts: Valuation experts, research analysts and key opinion leaders specializing in the electronics and semiconductor industry.
Below is the breakup of our primary respondents by company, designation, and region:

Once we receive the confirmation from primary research sources or primary respondents, we finalize the base year market estimation and forecast the data as per the macroeconomic and microeconomic factors assessed during data collection.
- Data Analysis:
Once data is validated through both secondary as well as primary respondents, we finalize the market estimations by hypothesis formulation and factor analysis at regional and country level.
- 3.1 Macro-Economic Factor Analysis:
We analyse macroeconomic indicators such the gross domestic product (GDP), increase in the demand for goods and services across industries, technological advancement, regional economic growth, governmental policies, the influence of COVID-19, PEST analysis, and other aspects. This analysis aids in setting benchmarks for various nations/regions and approximating market splits. Additionally, the general trend of the aforementioned components aid in determining the market's development possibilities.
- 3.2 Country Level Data:
Various factors that are especially aligned to the country are taken into account to determine the market size for a certain area and country, including the presence of vendors, such as headquarters and offices, the country's GDP, demand patterns, and industry growth. To comprehend the market dynamics for the nation, a number of growth variables, inhibitors, application areas, and current market trends are researched. The aforementioned elements aid in determining the country's overall market's growth potential.
- 3.3 Company Profile:
The “Table of Contents” is formulated by listing and analyzing more than 25 - 30 companies operating in the market ecosystem across geographies. However, we profile only 10 companies as a standard practice in our syndicate reports. These 10 companies comprise leading, emerging, and regional players. Nonetheless, our analysis is not restricted to the 10 listed companies, we also analyze other companies present in the market to develop a holistic view and understand the prevailing trends. The “Company Profiles” section in the report covers key facts, business description, products & services, financial information, SWOT analysis, and key developments. The financial information presented is extracted from the annual reports and official documents of the publicly listed companies. Upon collecting the information for the sections of respective companies, we verify them via various primary sources and then compile the data in respective company profiles. The company level information helps us in deriving the base number as well as in forecasting the market size.
- 3.4 Developing Base Number:
Aggregation of sales statistics (2020-2022) and macro-economic factor, and other secondary and primary research insights are utilized to arrive at base number and related market shares for 2022. The data gaps are identified in this step and relevant market data is analyzed, collected from paid primary interviews or databases. On finalizing the base year market size, forecasts are developed on the basis of macro-economic, industry and market growth factors and company level analysis.
- Data Triangulation and Final Review:
The market findings and base year market size calculations are validated from supply as well as demand side. Demand side validations are based on macro-economic factor analysis and benchmarks for respective regions and countries. In case of supply side validations, revenues of major companies are estimated (in case not available) based on industry benchmark, approximate number of employees, product portfolio, and primary interviews revenues are gathered. Further revenue from target product/service segment is assessed to avoid overshooting of market statistics. In case of heavy deviations between supply and demand side values, all thes steps are repeated to achieve synchronization.
We follow an iterative model, wherein we share our research findings with Subject Matter Experts (SME’s) and Key Opinion Leaders (KOLs) until consensus view of the market is not formulated – this model negates any drastic deviation in the opinions of experts. Only validated and universally acceptable research findings are quoted in our reports.
We have important check points that we use to validate our research findings – which we call – data triangulation, where we validate the information, we generate from secondary sources with primary interviews and then we re-validate with our internal data bases and Subject matter experts. This comprehensive model enables us to deliver high quality, reliable data in shortest possible time.

May 2021
Flight Planning Software Market
Size and Forecast (2021 - 2031), Global and Regional Share, Trend, and Growth Opportunity Analysis Report Coverage: By Component (Software and Services), Deployment (Cloud and On-Premise), Application (Logistics and Cargo, Airport, Private Airlines, Commercial Airlines, Flight School and Training Center, and Military and Defense), and Geography
May 2021
Deepfake AI Detection Market
Size and Forecast (2021 - 2031), Global and Regional Share, Trend, and Growth Opportunity Analysis Report Coverage: By Component (Software and Services), Deployment (Cloud and On-Premises), Enterprise Size (Large Enterprises and SMEs), Industry Vertical (Media and Entertainment, BFSI, Government and Politics, Healthcare and Life Sciences, IT and Telecom, Retail and E-Commerce, and Others), and Geography
May 2021
Electronic Patient-Reported Outcomes (ePROS) Market
Size and Forecast (2021 - 2031), Global and Regional Share, Trend, and Growth Opportunity Analysis Report Coverage: By Delivery Mode (Cloud Based and On-Premises), Application (Oncology, Respiratory, and Others), End User [Contract Research Organizations (CROs), Pharmaceutical Companies, and Others], and Geography (North America, Europe, Asia Pacific, Middle East & Africa, and South & Central America)
May 2021
Travel and Expense Management Software Market
Size and Forecast (2021 - 2031), Global and Regional Share, Trend, and Growth Opportunity Analysis Report Coverage: By Deployment Mode (On-Premise and Cloud), Organization Size (Large Enterprises and Small and Medium Enterprises), Industry (BFSI, IT and Telecom, Manufacturing, Healthcare, Government and Defense, Retail, Transport and Logistics, and Others), and Geography
May 2021
Online Exam Proctoring Market
Size and Forecast (2021 - 2031), Global and Regional Share, Trend, and Growth Opportunity Analysis Report Coverage: By Type (Advanced Automated Proctoring, Recorded Proctoring, and Live Online Proctoring), Deployment (Cloud and On-Premises), End User (Educational Institutes, Enterprises, Government, and Online Learning Platforms), and Geography
May 2021
Manufacturing Execution System (MES) Market
Size and Forecast (2021 - 2031), Global and Regional Share, Trend, and Growth Opportunity Analysis Report Coverage: By Component (Software and Services), Services Type (Professional Services and Managed Services), Deployment (Cloud and On-Premise), Organization Size (Large Enterprises and SMEs), License Type (Subscription-Based and Licensed), Sales Channel (Direct Sales and Channel Partners), End User (Discrete Industry and Process Industry), and Geography
May 2021
Maritime Analytics Market
Size and Forecast (2021 - 2031), Global and Regional Share, Trend, and Growth Opportunity Analysis Report Coverage: By Component (Software and Services), Deployment (Cloud and On-Premises), Application (Predictive and Prescriptive Analytics, Optimal Route Mapping, Pricing Insights, Vessel Safety and Security, and Others), End User (Commercial and Military), and Geography
 Get Free Sample For