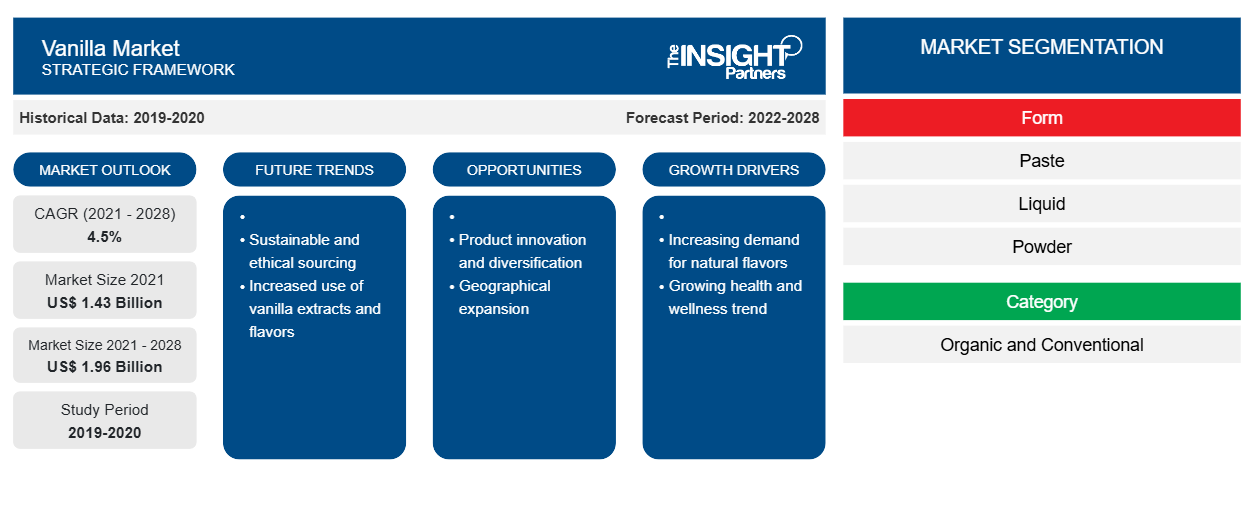
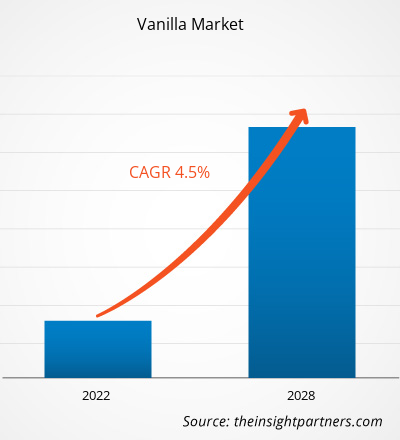
The vanilla market was valued at US$ 1,434.51 million in 2021 and is projected to reach US$ 1,956.09 million by 2028. It is expected to grow at a CAGR of 4.5% from 2021 to 2028.
Vanilla is derived from orchids of the genus Vanilla, primarily from the Mexican flat-leaved vanilla species. The three major species of vanilla currently grown globally include Mexican vanilla, Madagascar vanilla (Bourbon vanilla), and Indonesian vanilla. It is the second-most expensive spice after saffron and is widely used across several industries, such as food and beverage, personal care and cosmetics, pharmaceuticals, home fragrance, and animal feed
North America held the largest share of the global vanilla market in 2020, while APAC is expected to grow at the fastest CAGR over the forecast period. The food & beverage industry is an essential part of the US economy. According to the US Committee for Economic Development report, the food and beverage industry consists of close to 27,000 organizations and employs almost 1.5 million people. The increasing consumption of bakery and confectionery products across various countries, such as the US and Canada, is also projected to fuel the demand for vanilla across North America in the near future. Bakery products include bagels, bread, cakes, croissants, doughnuts, pastries, and many more. The rising demand for flavored bakery products in the region is fueling the need for vanilla, aiding the market.
Furthermore, consumers' changing and busy lifestyles in the region have led to a rise in the demand for multifunctional beauty and personal care products. North America is deemed as the most valuable beauty and personal care market. The region's augmenting demand for beauty and personal care products is an essential driver of the vanilla market as vanilla is used in a wide range of beauty and personal care products, such as moisturizers, scrubs, anti-aging creams, lotions, and fragrance products, owing to its antibacterial, soothing, anti-aging properties.
Customize This Report To Suit Your Requirement
You will get customization on any report - free of charge - including parts of this report, or country-level analysis, Excel Data pack, as well as avail great offers and discounts for start-ups & universities
Vanilla Market: Strategic Insights
- Get Top Key Market Trends of this report.This FREE sample will include data analysis, ranging from market trends to estimates and forecasts.
Impact of COVID-19 Pandemic on Vanilla Market
The COVID-19 pandemic has affected economies and industries in various countries due to lockdowns, travel bans, and business shutdowns. During the initial days of the pandemic, various companies had announced possible delays in product deliveries and slump in future sales of their products. The global travel bans imposed by countries in Europe, Asia, and North America have been affecting business collaborations and partnership opportunities. All these factors are anticipated to negatively affect the food & beverage industry, thereby restraining the growth of various markets related to this industry, including the global vanilla market. Moreover, the prices of vanilla declined significantly as there was a drop in demand from various industries, such as food and beverage, personal care, among others. This factor also affected the profitability of the market players and the farmers engaged in cultivating vanilla. However, the market is reviving on account of significant measures, such as vaccination drives, by the governments in several countries. Several industrial sectors are strategically planning to invest in advanced products to maximize revenue. This factor is expected to provide the impetus for the growth of the global vanilla market over the coming years.
Market Insights
Rising Demand for Natural Food Additives/Flavorings
Consumers increasingly prefer brands that claim the utilization of 100% natural ingredients, and they also tend to be loyal to the brands that use natural food additives in their products. It is becoming almost a prerequisite for manufacturers to market their products as "all-natural." Vanilla has been one of the most popular flavors used in the food and beverage industry for many years. It imparts flavor in many food and beverages, including cakes, pastries, muffins, dairy products, beverages, desserts, ice creams, and frostings. With the rapidly increasing demand for food products containing natural ingredients and food additives, the demand for natural vanilla is significantly rising.The growing consumer awareness surrounding the potential health hazards of synthetic additives—such as artificial sweeteners, colors, and flavoring agents—fuels the shift toward clean-label and organic products. Natural vanilla aligns with the clean-label movement gaining momentum across global markets. As consumers scrutinize ingredient labels more closely, food manufacturers are responding by reformulating their products with natural alternatives, boosting the use of vanilla derived from natural sources such as vanilla beans. Moreover, regulatory pressures and evolving food safety standards are reinforcing the demand for natural ingredients. In North America and Europe, food regulatory bodies have been tightening policies around the use of artificial additives, indirectly encouraging manufacturers to switch to natural flavoring agents. Vanilla, being a universally recognized and accepted natural flavoring, benefits significantly from this regulatory landscape.
The premiumization trend within the food and beverage sector also contributes to the rising demand for high-quality natural ingredients. Artisan bakeries, gourmet dessert producers, and specialty beverage companies are incorporating premium natural vanilla into their offerings to cater to discerning customers who associate natural ingredients with superior taste and higher nutritional value.
The natural vanilla market is witnessing increased investment and innovation across its value chain. From sustainable cultivation practices in key producing countries such as Madagascar and Uganda to technological advancements in extraction methods that preserve flavor integrity, the industry is evolving to meet growing demand without compromising quality or environmental standards. Thus, the rising global demand for natural food additives and flavorings serves as a catalyst for the vanilla market, positioning it as a critical ingredient in the formulation of clean-label and premium food products.
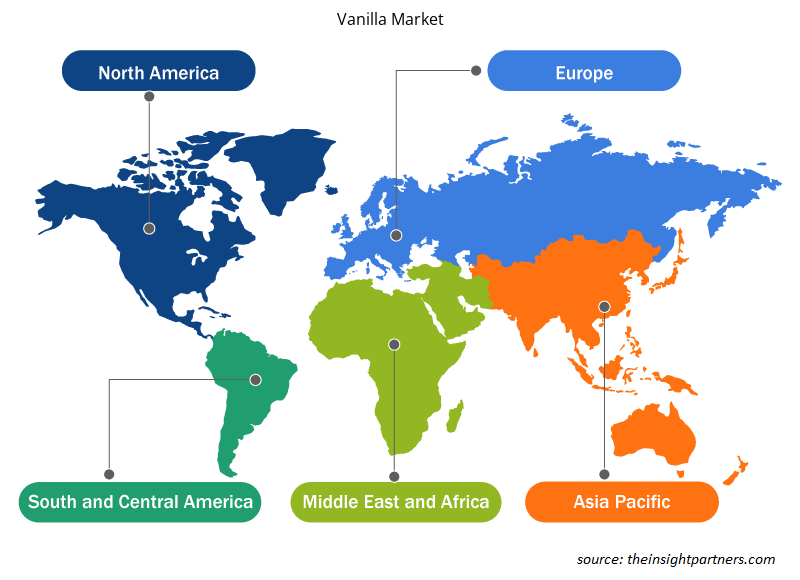
Vanilla Market Regional Insights
The regional trends and factors influencing the Vanilla Market throughout the forecast period have been thoroughly explained by the analysts at Insight Partners. This section also discusses Vanilla Market segments and geography across North America, Europe, Asia Pacific, Middle East and Africa, and South and Central America.
- Get the Regional Specific Data for Vanilla Market
Vanilla Market Report Scope
| Report Attribute | Details |
|---|---|
| Market size in 2021 | US$ 1.43 Billion |
| Market Size by 2028 | US$ 1.96 Billion |
| Global CAGR (2021 - 2028) | 4.5% |
| Historical Data | 2019-2020 |
| Forecast period | 2022-2028 |
| Segments Covered |
By Form
|
| Regions and Countries Covered | North America
|
| Market leaders and key company profiles |
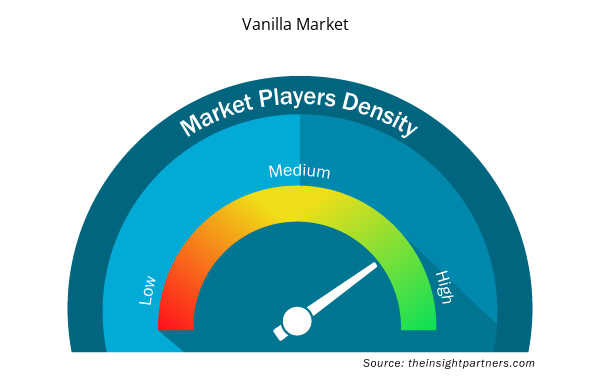
Vanilla Market Players Density: Understanding Its Impact on Business Dynamics
The Vanilla Market market is growing rapidly, driven by increasing end-user demand due to factors such as evolving consumer preferences, technological advancements, and greater awareness of the product's benefits. As demand rises, businesses are expanding their offerings, innovating to meet consumer needs, and capitalizing on emerging trends, which further fuels market growth.
Market players density refers to the distribution of firms or companies operating within a particular market or industry. It indicates how many competitors (market players) are present in a given market space relative to its size or total market value.
Major Companies operating in the Vanilla Market are:
- Camlin Fine Sciences Ltd.
- Givaudan S.A.
- Heilala Vanilla US.
- LAFAZA Foods
- Nielsen-Massey Vanillas, Inc.
Disclaimer: The companies listed above are not ranked in any particular order.
- Get the Vanilla Market top key players overview
Form Insights
Based on form, the vanilla market is bifurcated into paste, liquid, powder, and beans. The beans segment accounted for a larger market share in 2020 and the liquid segment is expected to register a higher CAGR in the market during the forecast period. Liquid vanilla offers a richer, purer vanilla taste than vanilla essence since it is less processed. Liquid vanilla can be used in various bakery products, such as cakes, pastries, and cookies. It is also used as a flavoring agent in various beverages, such as wines, cocktails, hot chocolate, and coffee. Vanilla extract finds usage in ice creams, smoothies, desserts, and other products. Liquid vanilla is utilized in skincare and pharmaceutical products due to its anti-inflammatory properties. Liquid vanilla is also used in perfumes and fragrances. The rising utilization of liquid vanilla for a wide range of applications is projected to drive the product demand over the forecast period.
Category Insights
Based on category, the vanilla market is bifurcated into organic and conventional. The conventional segment accounted for a larger market share in 2020 and the organic segment is expected to register a higher CAGR in the market during the forecast period. People have become more aware of the benefits of organic foods, which has increased their popularity. They are cultivated naturally with manure or compost without chemical fertilizers and pesticides. As children are more vulnerable to illnesses caused by pesticide residues in food than adults, parents choose to feed them organic foods. Another benefit of organic foods is that they are free of growth hormones, genetically modified ingredients (GMI), and antibiotic residues. The rising demand for organic food is creating a massive demand for organic vanilla.Application Insights
Based on application, the vanilla market is bifurcated into food and beverage, personal care, pharmaceutical, and others. The food and beverage segment accounted for a larger market share in 2020, and the personal care segment is expected to register a higher CAGR in the market during the forecast period. The food and beverage segment is projected to remain one of the prominent application segments for vanilla due to the rising consumption of bakery products, ice creams, and desserts and increasing application in the food retail and service sector. Vanilla has been used in various food and beverages for many years as a flavoring agent, especially in bakery products such as cakes, muffins, pastries, and doughnuts. It is also used in frozen desserts, ice-creams, smoothies, frostings, whipped cream, and other products. Over the past few years, vanilla extract has been used in a latte, hot chocolates, thick shakes, cocktails, cold drinks, etc. Vanilla powder is frequently used in spice mixes, dry baking premixes, and other dry ingredients.A few players operating in the vanilla market are Camlin Fine Sciences Ltd; Givaudan S.A.; Heilala Vanilla US; LAFAZA Foods; Nielsen-Massey Vanillas, Inc.; Symrise; The Vanilla Company; Kerry Group; Touton S.A.; and Madagascar Vanilla Company.
Report Spotlights
- Progressive industry trends in the vanilla market to help players develop effective long-term strategies
- Business growth strategies adopted by developed and developing markets
- Quantitative analysis of the vanilla market from 2019 to 2028
- Estimation of global demand for vanilla
- Porter's five forces analysis to illustrate the efficacy of buyers and suppliers operating in the industry
- Recent developments to understand the competitive market scenario
- Market trends and outlook as well as factors driving and restraining the growth of the vanilla market
- Assistance in the decision-making process by highlighting market strategies that underpin commercial interest, leading to the market growth
- The size of the vanilla market size at various nodes
- Detailed overview and segmentation of the market, as well as the vanilla industry dynamics
- Size of the vanilla market in various regions with promising growth opportunities
- Historical Analysis (2 Years), Base Year, Forecast (7 Years) with CAGR
- PEST and SWOT Analysis
- Market Size Value / Volume - Global, Regional, Country
- Industry and Competitive Landscape
- Excel Dataset


- Quantitative Structure-Activity Relationship (QSAR) Market
- Dry Eye Products Market
- Online Exam Proctoring Market
- Redistribution Layer Material Market
- Smart Mining Market
- Antibiotics Market
- Social Employee Recognition System Market
- Surgical Gowns Market
- Smart Parking Market
- Aesthetic Medical Devices Market

Report Coverage
Revenue forecast, Company Analysis, Industry landscape, Growth factors, and Trends

Segment Covered
Form, Category, and Application

Regional Scope
North America, Europe, Asia Pacific, Middle East & Africa, South & Central America

Country Scope
Argentina, Australia, Brazil, Canada, China, France, Germany, India, Italy, Japan, Mexico, Russian Federation, Saudi Arabia, South Africa, South Korea, United Arab Emirates, United Kingdom, United States
Frequently Asked Questions
The global vanilla market is primarily driven by increasing vanilla usage in various end-use industries, rising demand for natural food additives/flavorings, price volatility and supply shortage.
Some of the major key players operating in the global vanilla market include Camlin Fine Sciences Ltd; Givaudan S.A.; Heilala Vanilla US; LAFAZA Foods; Nielsen-Massey Vanillas, Inc.; Symrise; The Vanilla Company; Kerry Group; Touton S.A.; and Madagascar Vanilla Company.
The market scope covers natural vanilla that is used in various application industries such as food and beverages, personal care, pharmaceuticals, nutraceuticals, and others. It does not include synthetic vanilla/vanillin.
In 2020, North America led the global vanilla market. This region's food & beverage market is expanding significantly due to the increasing population, rising disposable incomes, changing lifestyle trends, and product innovations. Other factors driving the demand for food and beverage in North America are the increasing number of restaurants, fast-food chains, and food delivery apps.
Based on form, beans segment held the largest share in the vanilla market. Vanilla beans are mainly used in bakery products, ice creams, and desserts. Vanilla beans from different countries have particular flavor profiles and characteristics because of the differences in temperatures, soils, curing procedures, and vanilla species used. Vanilla beans from Madagascar, for example, have a creamy, sweet flavor. Whereas Mexican vanilla beans are known for their creamy, sweet, and slightly spicy flavors.
Based on the application, the personal care segment is projected to grow at the fastest rate. Due to the unique fragrance of vanilla, it is used to manufacture several products, such as perfumes, deodorants, soaps, and body washes. Vanilla is becoming a vital ingredient in many skincare products, such as face washes, body creams, day and night creams.
Trends and growth analysis reports related to Food and Beverages : READ MORE..
The List of Companies - Vanilla Market
- Camlin Fine Sciences Ltd.
- Givaudan S.A.
- Heilala Vanilla US.
- LAFAZA Foods
- Nielsen-Massey Vanillas, Inc.
- Symrise
- The Vanilla Company
- Kerry Group
- Touton S.A.
- Madagascar Vanilla Company
 Get Free Sample For