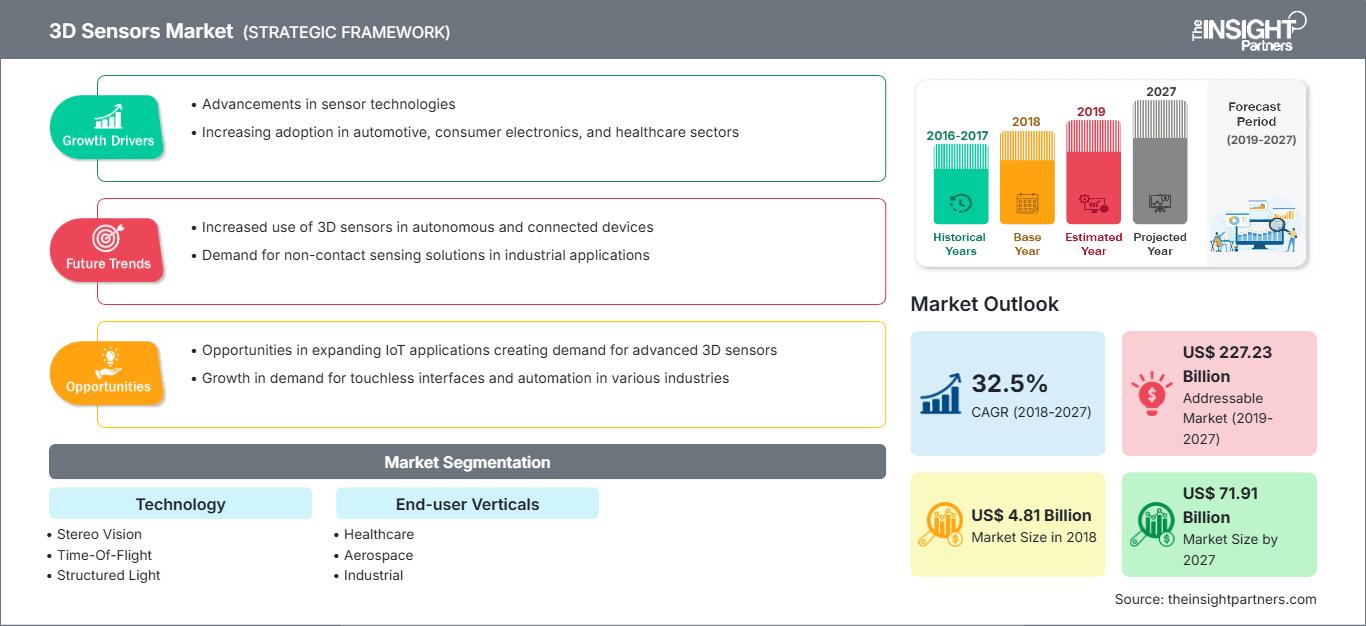
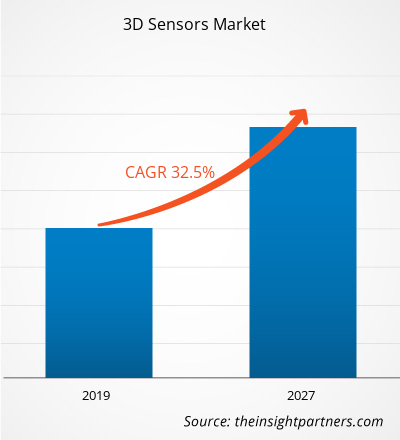
3D 传感器市场基于(关键地区、市场参与者、规模和份额)- 到 2031 年的预测

  • Report Code : TIPTE100000302
  • Category : Electronics and Semiconductor
  • Status : Published
  • No. of Pages : 150
Buy Now

[研究报告]2018年3D传感器市场价值为48.057亿美元,预计到2027年将达到719.142亿美元;预计 2019 年至 2027 年复合年增长率为 32.5%。

3D 传感器使用主动范围传感器,以高帧速率提供深度图像。这些相机配备了照亮视野的红外光源和捕捉反射红外光的 CMOS/CCD 传感器。深度测量基于ToF原理;因此,深度与红外信号到达物体或观察区域并返回所花费的时间成正比。为传感器的每个像素获得的深度测量值一起生成深度图像。深度图像的快速采集在广泛的终端用户垂直领域非常有用,例如机器人、人机交互和场景建模。不幸的是,目前许多 ToF 相机分辨率较低,并且受到不同测量误差的影响,包括传感器引起的噪声、由于难以生成正弦信号而导致的系统摆动误差、取决于反射率和积分的非线性深度偏移。时间,以及由深度不均匀(边缘)处的信号叠加生成的飞行像素。因此,ToF 传感器可提供精确的深度测量。目前可用的多 ToF 传感器系统侧重于通过依赖占用概率网格或注册从不同视图生成的点云等来组合深度图像来构建 3D 重建。

ToF技术用于测距目的已经使用了十多年。声纳和雷达是利用 ToF 原理的声音和无线电信号的两种技术,特别是在航空航天和航空最终用户垂直领域。最近,随着电子设备的改进和成熟,将光信号应用于ToF系统已经成为可能。使用这种系统的最终用户垂直领域有很多,特别是在工业和消费领域。一般来说,现代 ToF 传感器有两种测量距离的技术:脉冲调制或连续波 (CW) 调制。先进的 ToF 系统部署多频技术,结合更多调制频率。

3D 传感器市场利润丰厚的区域

< /p>

市场洞察–3D传感器市场

智能消费电子产品的需求增加

消费电子行业在发达国家和发展中国家都见证了巨大的增长和进步制造公司提供的智能功能是这一增长的主要贡献者。

目前,个人使用各种消费电子设备来执行大量任务。智能手机、平板电脑、个人电脑、电视、洗衣机、冰箱和音乐播放器等消费电子产品已成为日常生活中不可或缺的一部分。随着技术的不断进步以及物联网 (IoT) 和人工智能 (AI) 的集成,所有这些设备都变得更加智能。传感器技术的进步为包括汽车行业在内的大多数技术领域的物联网和人工智能的显着增长铺平了道路。随着制造商定期在其设备中推出先进技术和功能以及发达经济体和发展中经济体用户可支配收入的增加,消费电子设备市场不断增长。

最终用户垂直行业细分洞察

根据最终用户垂直行业,3D 传感器市场分为医疗保健、航空航天、工业、汽车、消费电子产品等。曾经笨重的小工具现在变得更加轻便和小型化,传感器可以实时测量形状。由于技术的快速进步,市场上出现了大量新应用。这些技术现在为不同的垂直行业提供了巨大的机会,例如汽车、国防、医疗保健、航空航天、机器人、电子消费品、半导体和零售,这些行业都可以使用 3D 传感器。各公司现在正在建立合作伙伴关系并加大协作力度,以带来更多 3D 应用。

技术细分市场洞察

基于技术的 3D 传感器市场分为立体视觉、飞行时间和结构光。 3D 传感器在连接现实世界中的设备的深度传感中发挥着关键作用。通过综合研发,3D 传感器不断进步,激发了 3D 传感器市场的创造力。除了应用于汽车、医疗保健、机器人和国防领域外,3D 传感器还广泛应用于电视、智能手机和笔记本电脑等消费电子产品中。除了纳米技术之外,3D 传感器也被纳入可穿戴设备中。此外,智能手机制造商正尝试将 3D 传感技术融入游戏和人脸识别等领域。在医疗保健行业,3D 传感器有助于查看皮肤、肿瘤和静脉的内层。在汽车行业,3D传感器被广泛用于在发生碰撞或迫在眉睫的危险时发出警报,以避免发生事故。 K 系列、iGPS、激光线扫描仪、激光雷达等产品用于航空航天和国防工业。随着电子、汽车和其他行业的新颖发明的出现,3D传感器的应用将不断增长。

战略洞察

市场参与者专注于新产品创新和开发,通过在产品中集成先进技术和功能来与竞争对手竞争。

  • 2019:AMS AG 推出新的 ASV 技术产品组合使消费、计算和工业产品制造商能够更轻松、更低成本地实施人脸识别和其他 3D 传感应用。基于丰富的 3D 经验,艾迈斯半导体在产品组合中添加了主动立体视觉技术产品,以满足更多和不同的 3D 传感应用的需求,并在移动领域实现更低的价格点。此外,AMS AG 还宣布与 SmartSens Technology 建立合作伙伴关系,通过此次合作,AMS 进一步扩展了其三种 3D 技术的产品组合,例如飞行时间 (ToF)、主动立体视觉 (ASV) 和结构光 (SL),以及加快新产品的上市时间。

全球 3D 传感器市场细分如下:


全球 3D 传感器市场 –按技术划分

  • 立体视觉
  • 飞行时间
  • 结构光

全球 3D 传感器市场–按最终用户行业划分

  • 医疗保健
  • 航空航天
  • 工业
  • 汽车
  • 消费电子产品< /li>
  • 其他

全球 3D 传感器市场 –按地理位置

  • 北美洲
    • 美国
    • 加拿大
    • 墨西哥
  • 欧洲
    • 德国
    • 法国
    • 意大利
    • < li>英国
    • 俄罗斯
    • 欧洲其他地区
  • 亚太地区 (APAC)
    • 中国
    • 澳大利亚
    • 印度
    • 日本
    • 韩国
    • 亚太地区其他地区
    • li>
  • 中东和非洲 (MEA)
    • 沙特阿拉伯
    • 南非
    • 阿联酋
    • 中东和非洲其他地区
  • 南美洲
    • 阿根廷
    • 巴西
    • 南美洲其他地区 (SAM)


公司简介

  • AMS AG
  • 英飞凌科技股份公司
  • Ifm Electronic Gmbh
  • Melexis
  • 索尼公司
  • 意法半导体
  • >
  • Basler AG
  • 康耐视公司
  • OmniVision Technologies, Inc.
  • LMI Technologies Inc.
Report Coverage
Report Coverage

Revenue forecast, Company Analysis, Industry landscape, Growth factors, and Trends

Segment Covered
Segment Covered

This text is related
to segments covered.

Regional Scope
Regional Scope

North America, Europe, Asia Pacific, Middle East & Africa, South & Central America

Country Scope
Country Scope

This text is related
to country scope.

Frequently Asked Questions


By Technology, which was the leading type to hold the largest share in the market and by what CAGR?

The leading type of 3D sensor is the Time-of-Flight (ToF) that has noted to account a CAGR of 41.9%. ToF is regarded as the sensor that has materialized as a promising three-dimensional (3D) sensing technology that can be manufactured economically in a compact size. In ToF, an infrared strobe emits a bright, short pulse, and a custom detector with a very fast shutter speed measures the time that the light travels before hitting an object. However, current state-of-the-art ToF sensors suffer from low spatial resolution due to physical limitations in the fabrication process

Which was the region to account the largest share for the 3D sensor market?

The Asia Pacific region led the 3D sensor market with a market share of 48.3%in 2018. The continuous economic growth in developed and developing countries like India and China, coupled with the presence of huge disposable incomes with individuals in countries like Japan and Australia, has facilitated the rapid growth of the automotive industry in this region. The Asia Pacific is one of the world’s rapidly growing consumer electronic with China accounting for maximum 3D sensor device production. The rapid growth in industrialization and urbanization in the economy is positively impacting the growth of the 3D sensor market in the APAC region. Moreover, the market for the 3D sensor is expected to rise with the growth of end-user verticals industries.

What is the major driving factor to favor the 3D sensor market all over the globe?

Growing demand for the 3D sensor is a major breakthrough in technology. It is a deep sensing technology that enhances the capacity of a camera to recognize faces and objects. Major companies are using this technology for the development of face recognition in mobile phones and also to accelerate the development and commercialization of high resolution, low power active 3D depth-sensing camera system.

The List of Companies

  1. AMS AG
  2. Infineon Technologies AG
  3. ifm electronic gmbh
  4. Melexis
  5. Sony Corporation
  6. STMicroelectronics N.V.
  7. Basler AG
  8. Cognex Corporation
  9. OmniVision Technologies, Inc.
  10. LMI Technologies Inc

The Insight Partners performs research in 4 major stages: Data Collection & Secondary Research, Primary Research, Data Analysis and Data Triangulation & Final Review.

  1. Data Collection and Secondary Research:

As a market research and consulting firm operating from a decade, we have published and advised several client across the globe. First step for any study will start with an assessment of currently available data and insights from existing reports. Further, historical and current market information is collected from Investor Presentations, Annual Reports, SEC Filings, etc., and other information related to company’s performance and market positioning are gathered from Paid Databases (Factiva, Hoovers, and Reuters) and various other publications available in public domain.

Several associations trade associates, technical forums, institutes, societies and organization are accessed to gain technical as well as market related insights through their publications such as research papers, blogs and press releases related to the studies are referred to get cues about the market. Further, white papers, journals, magazines, and other news articles published in last 3 years are scrutinized and analyzed to understand the current market trends.

  1. Primary Research:

The primarily interview analysis comprise of data obtained from industry participants interview and answers to survey questions gathered by in-house primary team.

For primary research, interviews are conducted with industry experts/CEOs/Marketing Managers/VPs/Subject Matter Experts from both demand and supply side to get a 360-degree view of the market. The primary team conducts several interviews based on the complexity of the markets to understand the various market trends and dynamics which makes research more credible and precise.

A typical research interview fulfils the following functions:

  • Provides first-hand information on the market size, market trends, growth trends, competitive landscape, and outlook
  • Validates and strengthens in-house secondary research findings
  • Develops the analysis team’s expertise and market understanding

Primary research involves email interactions and telephone interviews for each market, category, segment, and sub-segment across geographies. The participants who typically take part in such a process include, but are not limited to:

  • Industry participants: VPs, business development managers, market intelligence managers and national sales managers
  • Outside experts: Valuation experts, research analysts and key opinion leaders specializing in the electronics and semiconductor industry.

Below is the breakup of our primary respondents by company, designation, and region:

Research Methodology

Once we receive the confirmation from primary research sources or primary respondents, we finalize the base year market estimation and forecast the data as per the macroeconomic and microeconomic factors assessed during data collection.

  1. Data Analysis:

Once data is validated through both secondary as well as primary respondents, we finalize the market estimations by hypothesis formulation and factor analysis at regional and country level.

  • Macro-Economic Factor Analysis:

We analyse macroeconomic indicators such the gross domestic product (GDP), increase in the demand for goods and services across industries, technological advancement, regional economic growth, governmental policies, the influence of COVID-19, PEST analysis, and other aspects. This analysis aids in setting benchmarks for various nations/regions and approximating market splits. Additionally, the general trend of the aforementioned components aid in determining the market's development possibilities.

  • Country Level Data:

Various factors that are especially aligned to the country are taken into account to determine the market size for a certain area and country, including the presence of vendors, such as headquarters and offices, the country's GDP, demand patterns, and industry growth. To comprehend the market dynamics for the nation, a number of growth variables, inhibitors, application areas, and current market trends are researched. The aforementioned elements aid in determining the country's overall market's growth potential.

  • Company Profile:

The “Table of Contents” is formulated by listing and analyzing more than 25 - 30 companies operating in the market ecosystem across geographies. However, we profile only 10 companies as a standard practice in our syndicate reports. These 10 companies comprise leading, emerging, and regional players. Nonetheless, our analysis is not restricted to the 10 listed companies, we also analyze other companies present in the market to develop a holistic view and understand the prevailing trends. The “Company Profiles” section in the report covers key facts, business description, products & services, financial information, SWOT analysis, and key developments. The financial information presented is extracted from the annual reports and official documents of the publicly listed companies. Upon collecting the information for the sections of respective companies, we verify them via various primary sources and then compile the data in respective company profiles. The company level information helps us in deriving the base number as well as in forecasting the market size.

  • Developing Base Number:

Aggregation of sales statistics (2020-2022) and macro-economic factor, and other secondary and primary research insights are utilized to arrive at base number and related market shares for 2022. The data gaps are identified in this step and relevant market data is analyzed, collected from paid primary interviews or databases. On finalizing the base year market size, forecasts are developed on the basis of macro-economic, industry and market growth factors and company level analysis.

  1. Data Triangulation and Final Review:

The market findings and base year market size calculations are validated from supply as well as demand side. Demand side validations are based on macro-economic factor analysis and benchmarks for respective regions and countries. In case of supply side validations, revenues of major companies are estimated (in case not available) based on industry benchmark, approximate number of employees, product portfolio, and primary interviews revenues are gathered. Further revenue from target product/service segment is assessed to avoid overshooting of market statistics. In case of heavy deviations between supply and demand side values, all thes steps are repeated to achieve synchronization.

We follow an iterative model, wherein we share our research findings with Subject Matter Experts (SME’s) and Key Opinion Leaders (KOLs) until consensus view of the market is not formulated – this model negates any drastic deviation in the opinions of experts. Only validated and universally acceptable research findings are quoted in our reports.

We have important check points that we use to validate our research findings – which we call – data triangulation, where we validate the information, we generate from secondary sources with primary interviews and then we re-validate with our internal data bases and Subject matter experts. This comprehensive model enables us to deliver high quality, reliable data in shortest possible time.

Your data will never be shared with third parties, however, we may send you information from time to time about our products that may be of interest to you. By submitting your details, you agree to be contacted by us. You may contact us at any time to opt-out.

Related Reports