Strategie di mercato dei sensori 3D, principali attori, opportunità di crescita, analisi e previsioni entro il 2027
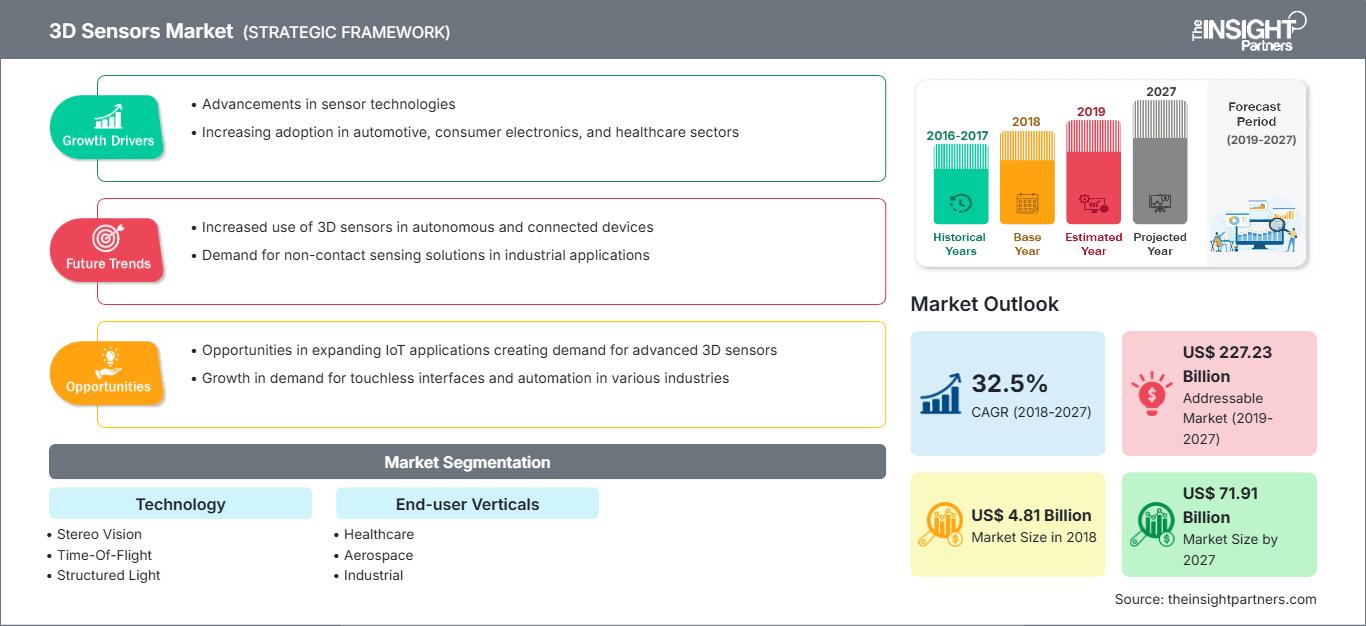
Dati storici : 2016-2017 | Anno base : 2018 | Periodo di previsione : 2019-2027Mercato dei sensori 3D fino al 2027 - Analisi e previsioni globali per tecnologia (visione stereo, tempo di volo e luce strutturata); settori verticali dell'utente finale (sanità, aerospaziale, industriale, automobilistico, elettronica di consumo e altri)
- Stato : Edito
- Codice del report : TIPTE100000302
- Categoria : Elettronica e semiconduttori
- Numero di pagine : 150
- Formati di report disponibili :


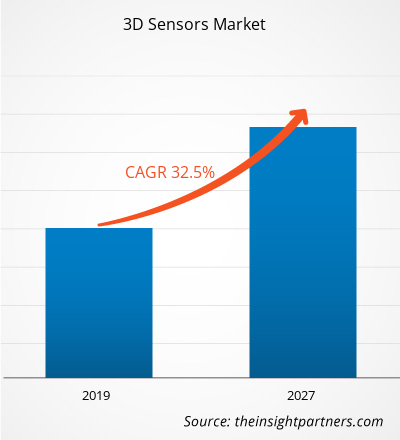
[Rapporto di ricerca]Il mercato dei sensori 3D è stato valutato a 4.805,7 milioni di dollari nel 2018 e si prevede che raggiungerà i 71.914,2 milioni di dollari entro il 2027; si prevede una crescita a un CAGR del 32,5% nel periodo 2019-2027.
I sensori 3D utilizzano sensori a campo attivo che forniscono immagini di profondità ad alta frequenza di fotogrammi. Queste telecamere sono dotate di una sorgente di luce IR che illumina il campo e di un sensore CMOS/CCD che cattura la luce IR riflessa. La misurazione della profondità si basa sul principio ToF; pertanto, la profondità è proporzionale al tempo impiegato dal segnale IR per raggiungere l'oggetto o il campo di osservazione e tornare indietro. Le misurazioni di profondità ottenute per ciascun pixel del sensore producono complessivamente un'immagine di profondità. L'acquisizione rapida di immagini di profondità è di grande utilità in un'ampia gamma di settori verticali per utenti finali, come la robotica, l'interazione uomo-macchina e la modellazione di scene. Sfortunatamente, molte delle telecamere ToF attualmente disponibili hanno risoluzioni basse e sono affette da diversi errori di misurazione, tra cui il rumore causato dai sensori, l'errore di oscillazione sistematico dovuto alla difficoltà di generare segnali sinusoidali, offset di profondità non lineari dipendenti dalla riflettività e dal tempo di integrazione e pixel volanti generati dalla sovrapposizione di segnali in corrispondenza di disomogeneità di profondità (bordi). Di conseguenza, i sensori ToF forniscono misurazioni di profondità accurate e precise. I sistemi di sensori multi-ToF attualmente disponibili si concentrano sulla combinazione di immagini di profondità per costruire ricostruzioni 3D basandosi su griglie di probabilità di occupazione o registrando le nuvole di punti generate da diverse viste, ecc.
Le tecniche ToF sono utilizzate da oltre un decennio per scopi di telemetria. SONAR e RADAR sono le due tecniche che sfruttano i segnali audio e radio dei principi ToF, in particolare nei settori aerospaziale e aeronautico. Più recentemente, con il miglioramento e la maturità dei dispositivi elettronici, è stato possibile utilizzare segnali luminosi per i sistemi ToF. I settori in cui tale sistema viene utilizzato sono numerosi, soprattutto nei settori industriale e consumer. In generale, esistono due tecniche di misurazione della distanza con i moderni sensori ToF: la modulazione pulsata o la modulazione a onda continua (CW). I sistemi ToF avanzati utilizzano tecnologie multifrequenza, combinando più frequenze di modulazione.
Personalizza questo rapporto in base alle tue esigenze
Potrai personalizzare gratuitamente qualsiasi rapporto, comprese parti di questo rapporto, o analisi a livello di paese, pacchetto dati Excel, oltre a usufruire di grandi offerte e sconti per start-up e università
Mercato dei sensori 3D: Approfondimenti strategici
-
Ottieni le principali tendenze chiave del mercato di questo rapporto.Questo campione GRATUITO includerà l'analisi dei dati, che vanno dalle tendenze di mercato alle stime e alle previsioni.
Il settore dell'elettronica di consumo sta assistendo a una crescita enorme sia nei paesi sviluppati che in quelli in via di sviluppo, e i progressi e le funzionalità intelligenti offerti dalle aziende manifatturiere hanno contribuito in modo significativo a questa crescita.
Attualmente, diversi dispositivi elettronici di consumo vengono utilizzati dalle persone per una miriade di attività. Dispositivi elettronici di consumo come smartphone, tablet, PC, TV, lavatrici, frigoriferi e lettori musicali sono diventati parte integrante della vita quotidiana. Tutti questi dispositivi stanno diventando più intelligenti grazie ai continui progressi tecnologici e all'integrazione dell'Internet of Things (IoT) e dell'Intelligenza Artificiale (IA). I progressi nella tecnologia dei sensori hanno aperto la strada a una notevole crescita dell'IoT e dell'IA nella maggior parte dei settori tecnologici, incluso il settore automobilistico. Il mercato dei dispositivi elettronici di consumo è in costante crescita, con i produttori che propongono regolarmente tecnologie e funzionalità avanzate nei loro dispositivi e un aumento del reddito disponibile degli utenti nelle economie sviluppate e in via di sviluppo.
Alcuni dei principali produttori di smartphone hanno introdotto per primi l'integrazione di sensori ToF 3D nei loro modelli. I principali produttori di smartphone a livello mondiale come Huawei, Samsung, Oppo, LG e Apple sono pionieri nell'integrazione di sensori ToF 3D in vari modelli. Huawei P30 Pro, Samsung Galaxy S10 5G, Oppo RX17 Pro, Honor View 20, LG G8 ThinQ e iPhone 2020 hanno integrato o hanno pianificato di integrare i sensori ToF 3D nei loro modelli.
Approfondimenti sui segmenti verticali degli utenti finali
In base ai settori verticali degli utenti finali, il mercato dei sensori 3D è segmentato in sanità, aerospaziale, industriale, automobilistico, elettronica di consumo e altri. I gadget che un tempo erano ingombranti stanno diventando più leggeri e miniaturizzati, con sensori in grado di misurare le forme in tempo reale. Un gran numero di nuove applicazioni sta emergendo sul mercato grazie ai rapidi progressi tecnologici. Queste tecnologie offrono ora enormi opportunità in diversi settori verticali, come l'automotive, la difesa, la sanità, l'aerospaziale, la robotica, i materiali di consumo elettronici, i semiconduttori e la vendita al dettaglio, dove è possibile utilizzare i sensori 3D. Le aziende stanno ora creando partnership e aumentando i loro sforzi di collaborazione per introdurre più applicazioni 3D.
Approfondimenti sul segmento tecnologico
In base alla tecnologia, il mercato dei sensori 3D si divide in visione stereoscopica, tempo di volo e luce strutturata. I sensori 3D svolgono un ruolo fondamentale nel rilevamento della profondità per collegare i dispositivi al mondo reale. I continui progressi nei sensori 3D attraverso una ricerca e sviluppo completa hanno alimentato la creatività nel mercato dei sensori 3D. Oltre ad essere adottati nei settori automobilistico, sanitario, robotico e della difesa, i sensori 3D sono ampiamente utilizzati nell'elettronica di consumo come televisori, smartphone e laptop. I sensori 3D sono integrati anche nei dispositivi indossabili, oltre che nella nanotecnologia. Inoltre, i produttori di smartphone stanno cercando di integrare la tecnologia di rilevamento 3D nei videogiochi e nel riconoscimento facciale, tra gli altri. Nel settore sanitario, i sensori 3D aiutano a visualizzare gli strati interni della pelle, i tumori e le vene. Nel settore automobilistico, i sensori 3D sono ampiamente utilizzati per ricevere avvisi in caso di collisione o pericolo imminente, al fine di evitare incidenti. La serie K, l'iGPS, gli scanner laser lineari e i radar laser sono tra i prodotti utilizzati nel settore aerospaziale e della difesa. Le applicazioni dei sensori 3D continueranno a crescere grazie alle nuove invenzioni nei settori dell'elettronica, dell'automotive e di altri settori.
Gli operatori del mercato si concentrano su innovazioni e sviluppi di prodotto integrando tecnologie e funzionalità avanzate nei loro prodotti per competere con la concorrenza.
- 2019: AMS AG introduce un nuovo portafoglio di prodotti con tecnologia ASV che consente ai produttori di prodotti di consumo, informatici e industriali di implementare il riconoscimento facciale e altre applicazioni di rilevamento 3D più facilmente e a costi inferiori. Grazie alla sua vasta esperienza nel 3D, AMS ha aggiunto al portafoglio prodotti con tecnologia Active Stereo Vision per affrontare applicazioni di rilevamento 3D aggiuntive e diverse, nonché per raggiungere prezzi più bassi nel segmento mobile. Inoltre, AMS AG ha annunciato la sua partnership con SmartSens Technology, con cui AMS amplia ulteriormente il suo portafoglio di tre tecnologie 3D come Time-of-Flight (ToF), Active Stereo Vision (ASV) e Structured Light (SL), accelerando al contempo il time-to-market dei suoi nuovi prodotti.
Approfondimenti regionali sul mercato dei sensori 3D
Le tendenze regionali e i fattori che influenzano il mercato dei sensori 3D durante il periodo di previsione sono stati ampiamente spiegati dagli analisti di The Insight Partners. Questa sezione analizza anche i segmenti e la distribuzione geografica del mercato dei sensori 3D in Nord America, Europa, Asia-Pacifico, Medio Oriente e Africa, America Meridionale e Centrale.
Ambito del rapporto di mercato sui sensori 3D
| Attributo del rapporto | Dettagli |
|---|---|
| Dimensioni del mercato in 2018 | US$ 4.81 Billion |
| Dimensioni del mercato per 2027 | US$ 71.91 Billion |
| CAGR globale (2018 - 2027) | 32.5% |
| Dati storici | 2016-2017 |
| Periodo di previsione | 2019-2027 |
| Segmenti coperti |
By Tecnologia
|
| Regioni e paesi coperti |
Nord America
|
| Leader di mercato e profili aziendali chiave |
|
Densità degli operatori del mercato dei sensori 3D: comprendere il suo impatto sulle dinamiche aziendali
Il mercato dei sensori 3D è in rapida crescita, trainato dalla crescente domanda degli utenti finali, dovuta a fattori quali l'evoluzione delle preferenze dei consumatori, i progressi tecnologici e una maggiore consapevolezza dei vantaggi del prodotto. Con l'aumento della domanda, le aziende stanno ampliando la propria offerta, innovando per soddisfare le esigenze dei consumatori e sfruttando le tendenze emergenti, alimentando ulteriormente la crescita del mercato.
- Ottieni il Mercato dei sensori 3D Panoramica dei principali attori chiave
- Visione stereo
- Time-Of-Flight
- Luce strutturata
Mercato globale dei sensori 3D - Per verticali degli utenti finali
- Sanità
- Aerospaziale
- Industriale
- Automotive
- Elettronica di consumo
- Altro
Mercato globale dei sensori 3D - Per tecnologia ... Per geografia
-
Nord America
- Stati Uniti
- Canada
- Messico
-
Europa
- Germania
- Francia
- Italia
- Regno Unito
- Russia
- Resto d'Europa
-
Asia Pacifico (APAC)
- Cina
- Australia
- India
- Giappone
- Corea del Sud
- Resto dell'Asia Pacifico
-
Medio Oriente e Africa (MEA)
- Arabia Saudita
- Sudafrica
- Emirati Arabi Uniti
- Resto del Medio Oriente e Africa
-
Sud America
- Argentina
- Brasile
- Resto del Sud America (SAM)
Profili aziendali
- AMS AG
- Infineon Technologies AG
- Ifm Electronic Gmbh
- Melexis
- Sony Corporation
- STMicroelectronics NV
- Basler AG
- Cognex Corporation
- OmniVision Technologies, Inc.
- LMI Technologies Inc.

Naveen è un professionista esperto in ricerche di mercato e consulenza con oltre 9 anni di esperienza in progetti personalizzati, sindacati e di consulenza. Attualmente Vicepresidente Associato, ha gestito con successo gli stakeholder lungo l'intera catena del valore del progetto e ha redatto oltre 100 report di ricerca e oltre 30 incarichi di consulenza. Il suo lavoro spazia tra progetti industriali e governativi, contribuendo in modo significativo al successo dei clienti e al processo decisionale basato sui dati.
Naveen ha conseguito una laurea in Ingegneria Elettronica e delle Comunicazioni presso la VTU, Karnataka, e un MBA in Marketing e Operations presso la Manipal University. È membro attivo dell'IEEE da 9 anni, partecipando a conferenze, simposi tecnici e svolgendo attività di volontariato sia a livello di sezione che regionale. Prima del suo attuale ruolo, ha lavorato come Consulente Strategico Associato presso IndustryARC e come Consulente Server Industriali presso Hewlett Packard (HP Global).
- Analisi storica (2 anni), anno base, previsione (7 anni) con CAGR
- Analisi PEST e SWOT
- Valore/volume delle dimensioni del mercato - Globale, Regionale, Nazionale
- Industria e panorama competitivo
- Set di dati Excel
Testimonianze
Il report di mercato sui sistemi SCADA di Insight Partners è completo, con preziosi spunti sulle tendenze attuali e sulle previsioni future. Il team si è dimostrato altamente professionale, reattivo e disponibile in ogni fase del progetto. Siamo molto soddisfatti e consigliamo vivamente i loro servizi.
RAN KEDEM Partner, Reali Technologies LTDsHo richiesto un report su un mercato software molto specifico e il team lo ha prodotto in pochi giorni. Le informazioni erano molto pertinenti e ben presentate. Ho quindi richiesto alcune modifiche e aggiunte al report. Il team è stato ancora una volta molto reattivo e ho ricevuto il report finale in meno di una settimana.
JEAN-HERVE JENN Presidente, Future AnalyticaAbbiamo collaborato con The Insight Partners per un importante studio di mercato e una previsione. Ci hanno fornito informazioni chiare su opportunità e rischi, che ci hanno aiutato a definire i nostri piani. La loro ricerca è stata facile da usare e basata su dati solidi. Ci ha aiutato a prendere decisioni intelligenti e consapevoli. Li consigliamo vivamente.
PIYUSH NAGPAL Vicepresidente senior, Abbaglianti globaliInsight Partners ha fornito ricerche di mercato approfondite e ben strutturate, con una solida competenza nel settore. Il loro team si è dimostrato professionale e reattivo in ogni fase. Il sito web intuitivo ha reso l'accesso ai report di settore semplice e immediato. Li consigliamo vivamente per servizi di ricerca affidabili e di alta qualità.
YUKIHIKO ADACHI Amministratore delegato, Deep Blue, LLC.Questa è la prima volta che acquisto un report di mercato da The Insight Partners. Sebbene inizialmente fossi indeciso, ho visitato il loro sito web e mi sono sentito più a mio agio nell'acquistare un report di mercato. Sono completamente soddisfatto della qualità del report e del servizio clienti. Avevo diverse domande e commenti sul report iniziale, ma dopo un paio di conversazioni via email con il loro analista credo di avere un report che posso utilizzare come input per il nostro processo di pianificazione strategica. Grazie mille per aver dedicato del tempo extra e aver reso questa esperienza positiva. Consiglierò sicuramente il vostro servizio ad altri e sarete la mia prima persona a cui rivolgermi quando avremo bisogno di ulteriori dati di mercato.
GIOVANNI SUZUKI Presidente e Amministratore Delegato, Consigliere di Amministrazione, Tecnologie BKDesidero esprimere la mia gratitudine per il supporto e la professionalità dimostrati nel rispondere alla mia richiesta di informazioni sul mercato dei dispositivi medici in vitro per malattie infettive in Nigeria. Apprezzo la vostra pazienza, la vostra guida e la vostra disponibilità a offrirmi uno sconto, che alla fine ci ha permesso di concludere l'affare. Non vedo l'ora di collaborare con The Insight Partners in futuro, grazie anche all'impressione che mi avete lasciato dopo questo primo incontro.
Dott. Chijioke AMMINISTRATORE DELEGATO DI ONYIA, PineCrest Healthcare Ltd.Motivo dell'acquisto
- Processo decisionale informato
- Comprensione delle dinamiche di mercato
- Analisi competitiva
- Analisi dei clienti
- Previsioni di mercato
- Mitigazione del rischio
- Pianificazione strategica
- Giustificazione degli investimenti
- Identificazione dei mercati emergenti
- Miglioramento delle strategie di marketing
- Aumento dell'efficienza operativa
- Allineamento alle tendenze normative


Sblocca sconti esclusivi sui report
Richiedi ora


 Ottieni un campione gratuito per - Mercato dei sensori 3D