临床试验成像市场分析及预测(按规模、份额、增长、趋势划分)2028 年
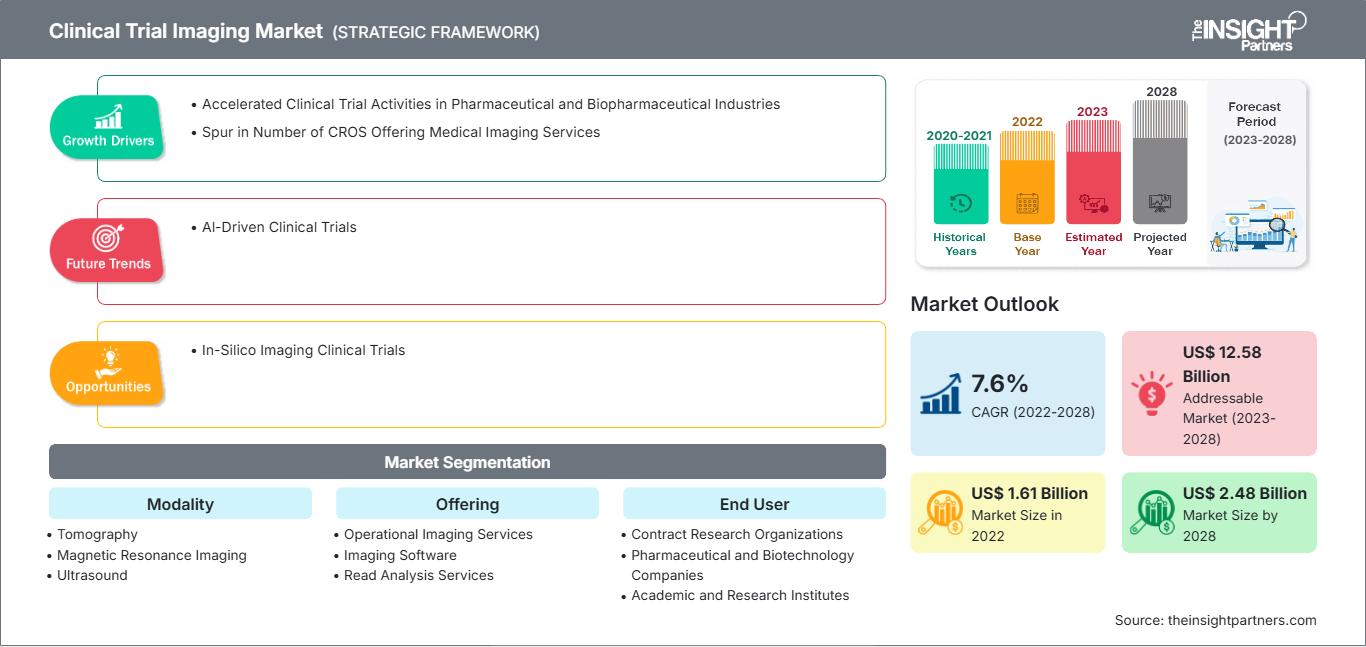
历史数据 : 2020-2021 | 基准年 : 2022 | 预测期 : 2023-2028临床试验成像市场预测至 2028 年——全球分析,按模式[断层扫描、磁共振成像 (MRI)、超声波、正电子发射断层扫描 (PET)、X 射线、超声心动图等]、产品(操作成像服务、成像软件、读取分析服务、试验设计和咨询服务等)和最终用户[合同研究组织 (CRO)、制药和生物技术公司、学术和研究机构等]
- 状态 : 已发布
- 报告代码 : TIPHE100001201
- 类别 : 生命科学
- 页数 : 186
- 可用报告格式 :


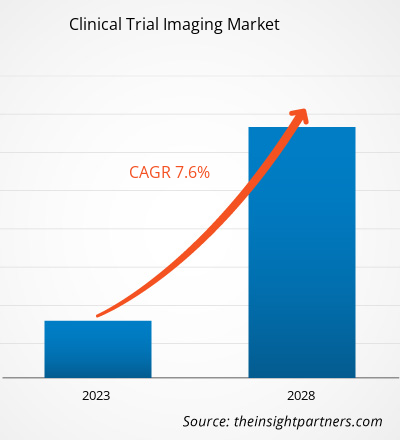
[研究报告]临床试验成像市场规模预计将从2022年的16.107亿美元增至2028年的24.8032亿美元;预计2023年至2028年的复合年增长率为7.6%。
市场洞察与分析师观点:
临床试验成像是一项面向志愿者开展的研究。该研究的主要目的是确定成像程序在检测、诊断、指导或监测疾病治疗方面的价值。一些图像解释过程可能包括使用混入临床试验图像中的测试图像,以便间歇性地测试阅片员的读取熟练程度和/或一致性。如果阅片员无法保持熟练程度,则可能需要更换阅片员。随着多中心临床试验中成像终点的使用率迅速增加,数据量和工作流程的复杂性也随之增加。临床试验影像管理系统 (CTIMS) 需要全面支持临床试验中的影像流程,从而实现无缝衔接的工作流程并改善患者预后。CTIMS 的关键监管要求是通过全面审查众多相关法规和指南(包括国际协调会议-GCP E6、FDA 21 联邦法规第 11 和 820 部分、良好自动化生产规范以及临床数据交换标准联盟)而提炼出来的。
增长动力与挑战:
临床研究组织 (CRO) 通过利用高质量设施和深厚的专业知识提供服务,协助临床试验的成功实施。CRO 凭借其高效且经济高效的运营,已开始成为临床试验行业的中坚力量,为试验申办方带来益处。例如,与内部活动相比,CRO 平均节省 30% 的时间来开展和完成临床试验。
随着 CRO 数量的增加导致竞争加剧,其中一些企业提供专门的影像服务,从而成为影像 CRO(iCRO)。Keosys Medical Imaging 和 Medica Group PLC 就是 iCRO 的代表。自 2010 年以来,临床试验总数翻了一番,影像技术在这些试验中的使用量增长了近 500%。根据 KEOSYS MEDICAL IMAGING 公司的一份报告,iCRO 将其预算的 7.5% 到 10% 用于影像,这有助于他们优化工作流程,管理从图像采集到解读的每个步骤。这些 CRO 在影像场地资格认定、标准化图像采集以及读取设计和标准的确定等领域提供关键的知识见解,从而促进全球临床试验影像市场的增长。
自定义此报告以满足您的要求
您将免费获得任何报告的定制,包括本报告的部分内容,或国家级分析、Excel 数据包,以及为初创企业和大学提供超值优惠和折扣
临床试验成像市场: 战略洞察
-
获取本报告的主要市场趋势。这个免费样本将包括数据分析,从市场趋势到估计和预测。
临床试验有助于确定新的治疗或预防方式(例如新药、新饮食或新医疗器械)是否安全有效。这些试验主要在药物研发过程中进行。根据美国国家医学图书馆 (NLM) 提供的数据,2020 年在 NLM (ClinicalTrials.gov) 注册的新研究约有 52,000 项,到 2023 年这一数字将增至约 58,000 项。2023 年 1 月,NLM 报告称美国有 38,837 项活跃临床试验,全球有 105,172 项活跃临床试验。根据欧洲药品管理局的数据,欧盟 (EU) 每年授权约 4,000 项临床试验,其中约 60% 的临床试验与制药行业相关。随着全球慢性病患病率的上升,为开发各种有效治疗方法而开展的临床试验数量不断增加,这推动了临床试验成像市场的增长。
此外,临床试验正变得越来越复杂,因此,在研究型组织中,正确执行和监督该过程变得至关重要。为了避免因执行不当而导致的错误,研究型组织正在将临床试验外包以开发其产品。临床研究组织 (CRO) 通过利用高质量设施和深厚的专业知识提供服务,协助成功实施临床试验。CRO 凭借其高效且经济的运营,使试验申办方受益,已成为临床试验行业的中坚力量。根据赛默飞世尔科技发布的博客,2022 年,约四分之三的临床试验是由 CRO 进行的,目的是确保药物开发商的临床项目安全、提供丰富的专业知识、提高时间和成本效率,并提供定制的高质量数据。因此,开发具有成本效益的解决方案和减少药物开发过程中 CRO 的错误正在推动临床试验市场的增长,进而又扩大了临床试验成像市场。
制药行业是全球研发最密集的行业之一。由于制药公司热衷于确保研发能够实现其预期目标,药品的价值变得越来越重要。在过去十年中,每年批准的新药数量也有所增加。根据美国食品药品监督管理局 (FDA) 的数据,2022 年每年批准 37 种新药。人们正在努力提高满足患者需求的有效性和效率。以研究为基础的行业将约 15% 至 20% 的收入分配给研发活动,每年在研发方面的投资超过 500 亿美元。在全球范围内,美国是研发投资的领先国家,在过去十年中生产了全球一半以上的新分子。根据欧洲制药工业协会联合会 (EFPIA) 的数据,2019 年北美占全球药品销售额的 48.7%。美国占 2014 年至 2019 年期间上市新药销售额的 62.3%。研发是制药公司业务的重要组成部分,因为它使他们能够开发出用于各种治疗应用且具有巨大医疗和商业潜力的新分子。
主要制药公司的研发投资
公司 |
2021 年研发投资(十亿美元) |
2022 年研发投资(十亿美元) |
|
武田药品工业株式会社 |
4.2 |
4.6 |
|
辉瑞公司 |
10.3 |
11.4 |
|
Grifols SA |
404.57 |
427.05 |
注:呈现货币时考虑了当前的汇率。
资料来源:年度报告和 Insight Partners 分析
研发支出用于发现、检查和生产新产品;预付款;改善现有成果;并在上市前证明产品功效和法规遵从性。研发投资根据临床试验的需求而有所不同。成本包括材料、耗材和工资,以及开发质量控制的成本。
上述公司和医院正在投资开发治疗各种疾病和病症(例如免疫系统疾病)的产品。 2021年6月,武田宣布启动一项随机、安慰剂对照、双盲3期临床试验ADVANCE-1,该试验评估了HYQVIA[10%免疫球蛋白输注液(人用)与重组人透明质酸酶]对慢性炎症性脱髓鞘性多发性神经根神经病(CIDP)的维持治疗效果,并有望达到其主要终点。因此,企业不断增加的研发投入以及先进的制药行业正在推动临床试验影像市场的增长。
对于制药和生物制药公司来说,积极参与临床研究回报丰厚但要求也很高,而医学影像正成为研究不可或缺的一部分。然而,临床试验和影像模式的独特技术规范和管理方面与标准护理影像有很大差异,从而给研究机构现有的临床基础设施带来了负担。未能满足此类临床要求会导致数据不可靠、需要重复影像检查,甚至导致患者被取消试验资格。此外,临床试验场所缺乏适当的基础设施可能会阻碍合同研究组织 (CRO) 应对此类挑战的努力。临床试验成像设备需要利益相关者投入大量资源。例如,药物或器械试验场所必须满足临床试验要求和基础设施,保持卓越的患者护理,并保证试验的完整性。此外,临床试验申办方必须承认临床试验成像的负担,并提供支持,以建设必要的本地基础设施来满足上述要求。北美放射学会 (RAI) 的定量成像生物标志物联盟 (QIMB) 致力于定义标准的成像方案和工作流程,确保图像检查的一致性,从而获得可量化的临床试验结果。因此,高额投资和标准化的基础设施要求阻碍了全球临床试验成像市场的增长。
报告细分和范围:
“全球临床试验成像市场”根据设备类型、产品、最终用户和地域进行细分。根据模式,临床试验成像市场细分为断层扫描、超声、正电子发射断层扫描、X 射线、超声心动图、磁共振成像等。根据产品/服务,临床试验成像市场细分为试验设计咨询服务、读取分析服务、操作成像服务、成像软件等。根据最终用户,临床试验成像市场细分为制药和生物制药公司、合同研究组织、学术和政府研究机构等。根据地域,临床试验成像市场细分为北美(美国、加拿大和墨西哥)、欧洲(德国、法国、意大利、英国、俄罗斯和欧洲其他地区)、亚太地区(澳大利亚、中国、日本、印度、韩国和亚太其他地区)、中东和非洲(南非、沙特阿拉伯、阿联酋和中东和非洲其他地区)以及南非和中美洲(巴西、阿根廷以及南美洲和中美洲其他地区)。
分部分析:
全球临床试验成像市场细分为试验设计咨询服务、读取分析服务、操作成像服务、成像软件等。操作成像服务细分市场在 2021 年占据最大份额,预计在预测期内将继续保持类似趋势。操作成像服务包括用于神经病学、肿瘤学、心血管疾病、胃肠病学、肌肉骨骼疾病等治疗应用的成像方式,例如 MRI、CT、超声、PET 和 SPECT,以及用于进行临床试验的医疗设备。临床成像是一种非侵入性研究方法,对医学科学的总体进步,尤其是临床研究,具有许多优势。因此,将新型成像技术深入融入临床试验的趋势日益强烈,使其成为生物技术、制药和医疗器械的基本要素。
此外,在试验中进行成像时,选择正确的读取设计至关重要。读取设计是指用于捕获和解释图像的读取器的数量和类型。降低变异性会给图像捕获和分析带来严峻挑战,因为试验可能涉及从各种成像方式获得的图像,需要放射科医生、病理学家和心脏病专家等专家进行审查。在临床试验中解释医学图像时,所使用的读取设计类型对于减少偏见至关重要。单读取、双读取和带判定员的双读取是三种主要的读取设计类型。在单读取中,图像仅由一名读取器解释。在双读取中,由两名或多名读取器进行解释。由于工作量大,大型试验可能需要多名读取器。理想情况下,一位(如果采用双读设计,则为两位)读片员将在整个研究过程中审阅同一患者的所有图像。多位读片员审阅同一患者的不同成像时间点可能会导致更多差异。例如,肿瘤学试验通常涉及以下阶段:治疗前对病变的选择和测量进行初步筛选;每次随访影像学检查时对病变的顺序选择和测量;以及每个时间点对增量放射学反应的评估。
Keosys Medical Imaging 提供基于网络的成像和读片软件,用于临床试验应用,以减少读片员的主观性;提高测量和量化的准确性;并提高整体运营效率、数据质量和可追溯性。Keosys 提供的读片软件包含先进的病变管理系统和针对不同治疗领域的专用应用程序。该读取软件已通过 FDA 510(k) 审核,并符合 ISO 13485(医疗器械)标准。
按成像方式划分,临床试验成像市场涵盖断层扫描、超声、正电子发射断层扫描、X 射线、超声心动图、磁共振成像等。断层扫描细分市场在 2021 年占据最大份额,预计在预测期内将继续保持类似的趋势。在断层扫描中,叠加结构的阴影会被用于 X 射线成像的移动 X 射线管模糊。用于研究和临床试验的计算机断层扫描 (CT) 扫描成像结合了从不同角度拍摄的 X 射线图像,然后经过计算机处理,提供骨骼、血管和软组织的横截面图像。线性和非线性断层扫描系统的工作原理相似——两种技术中,球管朝一个方向移动,而胶片暗盒朝相反方向移动,两者均围绕一个支点。
引入新的成像方法或改进现有方法需要根据特定疾病的治疗情况精准安排时间。在合适的时间安排成像对于正确解读患者的解剖结构至关重要。在医院,它有助于有效地实施手术、放射治疗或化疗等治疗,同时监测患者的毒性和发病率。肿瘤学领域的临床研究高度依赖于成像,以特定持续时间、强度和频率进行的扫描程序是试验方案的基础。
CT扫描的高级成像指标广泛应用于新药开发和癌症研究。它是与晚期癌症类型研究最常用的成像方式,影响颈部、胸部、腹部或骨盆。
区域分析:
根据地域,临床试验成像市场细分为五个主要区域:北美、欧洲、亚太地区、南美和中美以及中东和非洲。2021 年,北美占据临床试验成像市场的最大份额,其次是欧洲。美国已成为领先的临床研究目的地。全球近一半的临床试验是在美国进行的。此外,大多数制药研究公司倾向于在美国进行临床试验,因为美国拥有完善的医疗基础设施、快速的审批流程、有利的监管框架以及全球认可的临床试验数据。世界卫生组织 (WHO) 的一份报告指出,2021 年美国注册的临床试验数量最多(157,618 项)。
下表列出了在美国注册的临床试验数量、招募的患者总数,以及美国在上述参数中所占全球的百分比。
2023 |
注册的临床试验研究 |
研究中招募的患者 |
|
美国 |
139,632 项研究(占全球研究的 31%) |
20,680 项研究(占全球人数的 32%) |
来源:ClinicalTrial.gov报告
各公司推出的用于临床试验的创新产品进一步推动了美国临床试验成像市场的增长。Medical Metrics 是一家为临床试验提供成像服务的合同研究组织 (CRO),其产品名为“Assessa”。该产品有助于改善药物研发和相关临床研究中的决策,尤其是在研发治疗神经系统疾病(例如痴呆症、认知障碍、阿尔茨海默病、精神分裂症、帕金森病和其他与记忆相关的疾病)的药物方面。美国临床试验数量的不断增长有利于该国临床试验成像市场的增长。
临床试验成像市场区域洞察
The Insight Partners 的分析师已详尽阐述了预测期内临床试验成像市场的区域趋势和影响因素。本节还讨论了北美、欧洲、亚太地区、中东和非洲以及南美和中美洲的临床试验成像市场细分和地域分布。
临床试验成像市场报告范围
| 报告属性 | 细节 |
|---|---|
| 市场规模 2022 | US$ 1.61 Billion |
| 市场规模 2028 | US$ 2.48 Billion |
| 全球复合年增长率 (2022 - 2028) | 7.6% |
| 历史数据 | 2020-2021 |
| 预测期 | 2023-2028 |
| 涵盖的领域 |
By 模态
|
| 覆盖地区和国家 |
北美
|
| 市场领导者和主要公司简介 |
|
临床试验成像市场参与者密度:了解其对业务动态的影响
临床试验成像市场正在快速增长,这得益于终端用户需求的不断增长,而这些需求的驱动因素包括消费者偏好的不断变化、技术进步以及对产品优势的认知度不断提高。随着需求的增长,企业正在扩展其产品线,不断创新以满足消费者需求,并利用新兴趋势,从而进一步推动市场增长。
- 获取 临床试验成像市场 主要参与者概述
全球临床试验影像市场主要参与者采取的各种举措如下:
- 2022 年 12 月,塔塔咨询服务公司 (TCS)(孟买证券交易所股票代码:532540,印度国家证券交易所股票代码:TCS)宣布,用于分散式试验的 TCS ADD 互联临床试验平台荣获 2022 年印度制药奖“辅助制药服务卓越奖”。
- 2021 年 10 月,达索系统旗下公司 Medidata 宣布,该公司基于云端的安全临床试验影像管理平台 Rave Imaging 已达到重要里程碑,支持了超过 1,000 项影像研究。基于 Medidata 统一平台构建的 Rave Imaging 每年处理超过 1 亿张影像。该技术可实时查看所有 Rave Imaging 试验中与成像相关的所有试验活动,从而提高研究效率。
竞争格局和主要公司:
临床试验成像市场主要由 eResearch Technology Inc、Calyx Inc、ICON PLC、VIDA Diagnostics Inc、WCG Clinical Inc、BioTelemetry Inc、Medical Metrics Inc、Medpace Holdings Inc、Radiant Sage LLC 和 IXICO plc 等公司组成。这些公司一直在实施各种有助于其增长的战略,并进而带来了市场的各种变化。这些公司采用了有机战略(例如产品发布、业务扩张和产品审批)和无机战略(例如产品发布、合作伙伴关系和协作)。

Mrinal 是一位经验丰富的研究分析师,在生命科学市场情报和咨询领域拥有超过 8 年的经验。凭借战略思维和对卓越的不懈追求,她在医药预测、市场机遇评估和行业基准制定方面积累了深厚的专业知识。她的工作致力于提供切实可行的洞察,帮助客户做出明智的战略决策。
Mrinal 的核心优势在于将复杂的定量数据集转化为有意义的商业智能。她敏锐的分析能力有助于制定市场进入 (GTM) 战略,并发掘制药和医疗器械行业的增长机会。作为一名值得信赖的顾问,她始终致力于简化工作流程并建立最佳实践,从而为客户推动创新并提高运营效率。
- 历史分析(2 年)、基准年、预测(7 年)及复合年增长率
- PEST和SWOT分析
- 市场规模、价值/数量 - 全球、区域、国家
- 行业和竞争格局
- Excel 数据集
客户评价
Insight Partners 的 SCADA 系统市场报告内容全面,对当前趋势和未来预测提供了宝贵的见解。该团队始终高度专业、响应迅速且乐于助人。我们非常满意,强烈推荐他们的服务。
兰·凯德姆 伙伴, Reali Technologies LTD我请求一份关于特定软件市场的报告,团队在几天内就完成了。报告信息非常相关,而且呈现得非常出色。之后,我请求对报告进行一些修改和补充。团队再次迅速响应,不到一周我就收到了最终报告。
让-埃尔韦·詹恩 主席, 未来分析公司我们与 Insight Partners 合作进行了一项重要的市场研究和预测。他们清晰地洞察了机遇和风险,帮助我们制定了计划。他们的研究简单易用,数据可靠,帮助我们做出了明智而自信的决策。我们强烈推荐他们。
皮尤什·纳格帕尔 高级副总裁, 远光全球Insight Partners 凭借其深厚的行业专业知识,提供了富有洞察力、结构合理的市场研究。他们的团队始终专业且响应迅速。用户友好的网站让访问行业报告变得顺畅无阻。我们强烈推荐他们可靠、高质量的研究服务。
安达幸彦 首席执行官, 深蓝有限责任公司这是我第一次从The Insight Partners购买市场报告。起初我有些犹豫,但访问了他们的网站后,我更放心地冒险购买市场报告。我对报告的质量和客户服务非常满意。我对最初的报告有一些疑问和意见,但在与他们的分析师通过电子邮件沟通了几次后,我相信这份报告可以作为我们战略规划流程的参考。非常感谢您抽出宝贵的时间,让这次体验如此愉快。我一定会向其他人推荐你们的服务,当我们需要更多市场数据时,你们将是我的首选。
约翰·铃木 总裁兼首席执行官、董事会董事, BK科技感谢您在处理我关于尼日利亚传染病体外诊断市场信息请求的过程中所展现的支持和专业精神。感谢您的耐心、指导,以及您愿意提供的折扣,最终促成了这笔交易。我期待未来与 Insight Partners 继续合作,这一切都要归功于您与我初次接触后留下的良好印象。
奇吉奥克博士 ONYIA 董事总经理, PineCrest 医疗保健有限公司购买理由
- 明智的决策
- 了解市场动态
- 竞争分析
- 客户洞察
- 市场预测
- 风险规避
- 战略规划
- 投资论证
- 识别新兴市场
- 优化营销策略
- 提升运营效率
- 顺应监管趋势


 获取免费样品 - 临床试验成像市场