光纤传感器市场概况、增长、趋势、分析、研究报告(2025-2031)
光纤传感器市场规模和预测(2021-2031 年)、全球和区域份额、趋势和增长机会分析报告范围:按传感类型(温度传感、压力传感、声学传感、应变传感等)、最终用户(石油和天然气、制造、基础设施、航空航天和国防、电力和公用事业等)、应用(管道监控、上游应用、关键资产火灾探测、高压/电力电缆监控、CCS/CCUS 应用等)和地理位置
- 状态 : 已发布
- 报告代码 : TIPTE100000943
- 类别 : 电子和半导体
- 页数 : 270
- 可用报告格式 :


- 最后更新日期 : June 23, 2025


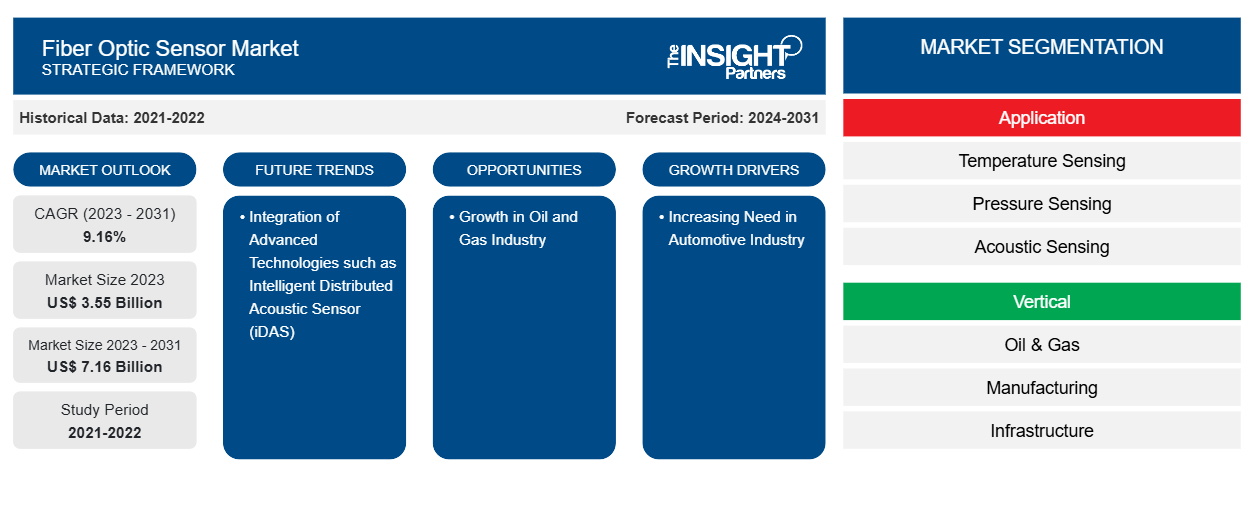
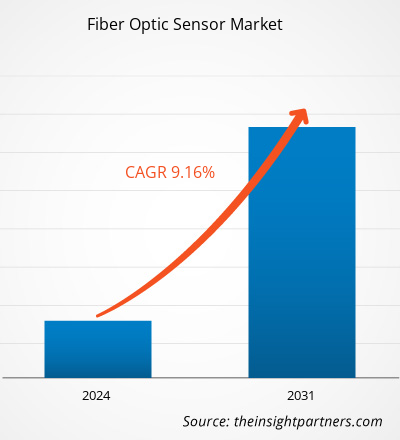
光纤传感器市场规模预计将从2024年的36.1亿美元增至2031年的67.6亿美元。预计2025年至2031年期间,该市场的复合年增长率将达到9.7%。小型化和便携性可能会在未来几年为市场带来新的趋势。
光纤传感器市场分析
光纤传感是一种用于测量化学变化、应变、温度、电场和磁场、压力、位移、旋转、辐射、液位、流量、光强度和振动的技术。光纤传感器是一种利用光纤来检测环境变化(称为内部传感器)或将信号从远程传感器传输到处理设备(称为外部传感器)的设备。这些微型传感器因其诸多优势而被广泛用于遥感。它们不需要在传感点供电,并且一根光纤可以支持多个传感器。这些优势使其在远距离监控操作方面经济高效。光纤传感器经久耐用,可以在极端温度下工作。由于它们不带电,因此在高电干扰、高压或易燃材料的区域也能很好地工作;这使得它们非常适合石油和天然气、建筑、航空航天和医疗保健等行业。
光纤传感器市场概况
石油和天然气领域应用的激增以及各行业对结构健康监测 (SHM) 日益增长的需求是推动光纤传感器市场发展的关键因素。这些传感器在提高建筑、管道和运输系统的安全性和效率方面发挥着至关重要的作用。石油和天然气、电力和电信等行业也在采用这些传感技术来提高性能和可靠性。随着越来越多的行业走向自动化和智能化系统,预计未来几年全球光纤传感器市场将稳步增长。智慧城市的发展和可再生能源领域的增长将在不久的将来为市场创造丰厚的利润。
您可以免费定制任何报告,包括本报告的部分内容、国家级分析、Excel 数据包,以及为初创企业和大学提供优惠和折扣
光纤传感器市场:战略洞察
-
获取此报告的顶级关键市场趋势。此免费样品将包括数据分析,从市场趋势到估计和预测。
光纤传感器市场驱动因素和机遇
结构健康监测需求不断增长
全球范围内对基础设施安全和实时监测的关注日益加深,这推动了对先进结构健康监测(SHM) 系统的需求。随着现代城市的扩张和基础设施的老化,人们不断需要检测桥梁、隧道、水坝和建筑物等结构损坏或失效的早期迹象。电阻应变计等传统系统往往在耐用性、长期准确性和适应性方面存在不足。光纤传感器已成为传统监测系统的卓越替代方案,具有紧凑设计、耐腐蚀和抗电磁干扰等优势。此外,它们能够直接嵌入结构中,这也使其广受欢迎。这些特性使其成为长期结构健康监测 (SHM) 的理想选择,即使在充满挑战的环境中也是如此。这些传感器可以精确测量应变、温度、振动和倾斜度等关键物理参数,这些参数对于维护基础设施的完整性和安全性至关重要。
为了满足日益增长的需求,光纤传感器市场的公司正在争取投资以扩大其技术规模。例如,Sentea——一家从IMEC分拆出来的公司,也是光纤传感器读出系统的供应商——于2021年成功融资约260万美元(230万欧元)以扩展业务。这项投资于2021年10月宣布。在Finindus、PMV、QBIC II和Fidimec等投资者的支持下,Sentea的扩张计划专注于推进光子集成技术,以实现土木工程、石油天然气、可再生能源和医疗应用领域的大规模光纤传感。此类投资反映了光纤传感技术在SHM应用中日益增长的部署潜力,从而推动了光纤传感器市场的增长。
智慧城市发展
印度政府于2015年6月25日启动了“100座智慧城市”计划,旨在通过智能解决方案,在全国范围内建设100座拥有现代化基础设施、清洁可持续环境和更高生活质量的城市。该计划旨在通过中央资助计划,促进城市在社会、经济、物质和制度方面的全面发展,其中中央政府拨款约64亿美元(4800亿印度卢比),各邦政府和其他渠道,包括公私合作伙伴关系(PPP)也提供配套资金。该计划旨在为其他城市创建可复制的可持续包容性城市发展模式。在欧盟,“净零城市”项目支持“2030年建成100座气候中和智慧城市”计划,该计划是“地平线欧洲”计划的一部分。
随着智慧城市的扩张,对光纤传感器等先进监测工具的需求将持续增长。这些传感器可以提供实时数据,即使在恶劣环境下也能出色地工作,并且能够持久耐用。它们可用于监测桥梁、道路、隧道、建筑物、水管和能源系统。例如,它们可以检测桥梁裂缝、管道泄漏或电网温度变化,从而帮助市政当局在问题变得严重之前采取行动。这些传感器还可用于智能交通系统、智能电网和智能建筑,有助于提高性能和安全性。因此,智慧城市的兴起为光纤传感器市场提供了一个利润丰厚的机遇,因为这些传感器有助于创建互联高效的系统。
光纤传感器市场报告细分分析
有助于得出光纤传感器市场分析的关键部分是传感类型、最终用户和应用。
- 根据传感类型,光纤传感器市场细分为温度传感、压力传感、声学传感、应变传感等。温度传感领域在2024年占据了最大的市场份额。
- 根据最终用户,光纤传感器市场细分为石油和天然气、制造业、基础设施、航空航天和国防、电力和公用事业以及其他领域。石油和天然气领域在2024年占据了最大的市场份额。
- 根据应用,光纤传感器市场细分为高压或大功率电缆监控、管道监控、上游应用、关键资产火灾探测、CCS/CCUS应用以及其他应用。其他应用在2024年占据了最大的市场份额。
光纤传感器市场份额(按地区)分析
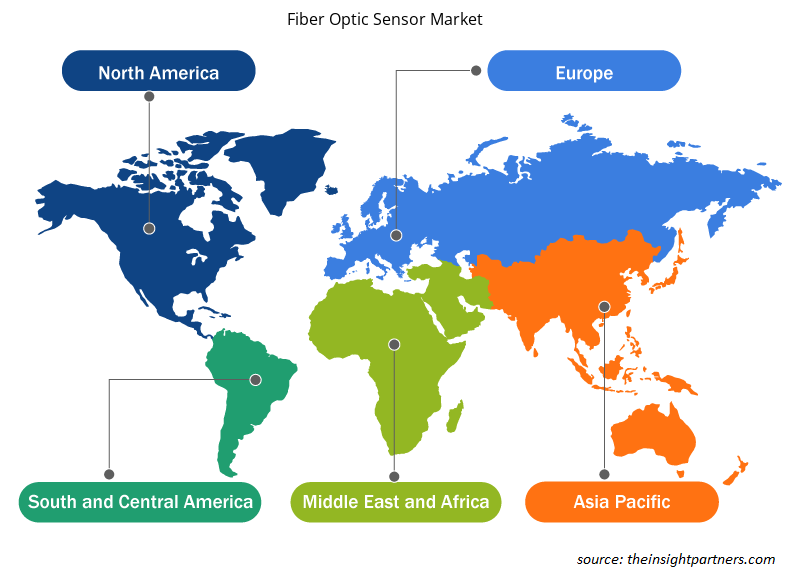
光纤传感器市场报告的地理范围主要分为五个区域:北美、亚太、欧洲、中东和非洲以及南美和中美。2024年,亚太地区将占据相当大的市场份额。
光纤传感器市场区域洞察
Insight Partners 的分析师已详尽阐述了预测期内影响光纤传感器市场的区域趋势和因素。本节还讨论了北美、欧洲、亚太地区、中东和非洲以及南美和中美的光纤传感器市场细分和地域分布。
- 获取光纤传感器市场的区域特定数据
光纤传感器市场报告范围
| 报告属性 | 细节 |
|---|---|
| 2024年的市场规模 | 36.1亿美元 |
| 2031年的市场规模 | 67.6亿美元 |
| 全球复合年增长率(2025-2031) | 9.7% |
| 史料 | 2021-2023 |
| 预测期 | 2025-2031 |
| 涵盖的领域 |
按传感类型
|
| 覆盖地区和国家 |
北美
|
| 市场领导者和主要公司简介 |
|
光纤传感器市场参与者密度:了解其对业务动态的影响
光纤传感器市场正在快速增长,这得益于终端用户需求的不断增长,而这些需求的驱动因素包括消费者偏好的不断变化、技术进步以及对产品优势的认知度不断提高。随着需求的增长,企业正在扩展产品线,不断创新以满足消费者需求,并抓住新兴趋势,从而进一步推动市场增长。
市场参与者密度是指特定市场或行业内企业或公司的分布情况。它表明特定市场空间内竞争对手(市场参与者)的数量相对于其规模或总市值而言。
光纤传感器市场的主要公司有:
- 堡盟控股公司
- 倍加福
- 威格勒传感器有限公司
- 日本电气公司
- 普罗西米恩公司
- 欧姆龙公司
免责声明:以上列出的公司没有按照任何特定顺序排列。
- 获取光纤传感器市场主要参与者的概述
光纤传感器市场新闻和最新发展
光纤传感器市场评估是通过收集一手和二手资料后进行的定性和定量数据进行的,这些数据包括重要的公司出版物、协会数据和数据库。以下列出了市场的一些发展情况:
Wenglor 推出了专为紧凑型空间应用而设计的 P1XD 光纤放大器。P1XD2 系列型号提供灵活的集成选项,使放大器可以独立运行,也可以作为联网系统的一部分,以主从角色运行。(来源:Wenglor,新闻稿,2024 年 12 月)
霍尼韦尔(纳斯达克股票代码:HON)携手 Civitanavi Systems(米兰泛欧交易所股票代码:CNS)面向全球商用和国防客户推出全新惯性测量单元 HG2800 系列,该系列产品包含低噪声、高带宽、高性能战术级惯性测量单元,专为商用和军用飞机的指向、稳定和短时导航等应用而设计。(来源:霍尼韦尔,新闻稿,2023 年 9 月)
光纤传感器市场报告覆盖范围和交付成果
《光纤传感器市场规模和预测(2021-2031)》报告对以下领域进行了详细的市场分析:
- 光纤传感器市场规模及全球、区域和国家层面所有主要细分市场的预测
- 光纤传感器市场趋势以及市场动态,例如驱动因素、限制因素和关键机遇
- 详细的 PEST 和 SWOT 分析
- 光纤传感器市场分析涵盖主要市场趋势、全球和区域框架、主要参与者、法规和最新市场发展
- 行业格局和竞争分析,涵盖市场集中度、热图分析、知名参与者以及光纤传感器市场的最新发展
- 详细的公司简介

Naveen 是一位经验丰富的市场研究和咨询专业人士,在定制项目、联合项目和咨询项目方面拥有超过 9 年的专业经验。他目前担任副总裁,成功管理了项目价值链中的利益相关者,撰写了 100 多份研究报告和 30 多项咨询项目。他的工作涵盖工业和政府项目,为客户的成功和数据驱动的决策做出了重要贡献。
Naveen 拥有卡纳塔克邦 VTU 的电子与通信工程学位,以及马尼帕尔大学的市场营销与运营 MBA 学位。他已担任 IEEE 会员 9 年,积极参与各种会议、技术研讨会,并在分部和地区层面担任志愿者。在此之前,他曾担任 IndustryARC 的助理战略顾问和惠普(惠普全球)的工业服务器顾问。
- 全面的市场规模与预测分析
- 详细的细分市场分析
- 深入的市场动态评估
- 区域及国家级洞察
- 竞争格局与企业对标分析
- 战略性商业情报
客户评价
Insight Partners 的 SCADA 系统市场报告内容全面,对当前趋势和未来预测提供了宝贵的见解。该团队始终高度专业、响应迅速且乐于助人。我们非常满意,强烈推荐他们的服务。
兰·凯德姆 伙伴, Reali Technologies LTD我请求一份关于特定软件市场的报告,团队在几天内就完成了。报告信息非常相关,而且呈现得非常出色。之后,我请求对报告进行一些修改和补充。团队再次迅速响应,不到一周我就收到了最终报告。
让-埃尔韦·詹恩 主席, 未来分析公司我们与 Insight Partners 合作进行了一项重要的市场研究和预测。他们清晰地洞察了机遇和风险,帮助我们制定了计划。他们的研究简单易用,数据可靠,帮助我们做出了明智而自信的决策。我们强烈推荐他们。
皮尤什·纳格帕尔 高级副总裁, 远光全球Insight Partners 凭借其深厚的行业专业知识,提供了富有洞察力、结构合理的市场研究。他们的团队始终专业且响应迅速。用户友好的网站让访问行业报告变得顺畅无阻。我们强烈推荐他们可靠、高质量的研究服务。
安达幸彦 首席执行官, 深蓝有限责任公司这是我第一次从The Insight Partners购买市场报告。起初我有些犹豫,但访问了他们的网站后,我更放心地冒险购买市场报告。我对报告的质量和客户服务非常满意。我对最初的报告有一些疑问和意见,但在与他们的分析师通过电子邮件沟通了几次后,我相信这份报告可以作为我们战略规划流程的参考。非常感谢您抽出宝贵的时间,让这次体验如此愉快。我一定会向其他人推荐你们的服务,当我们需要更多市场数据时,你们将是我的首选。
约翰·铃木 总裁兼首席执行官、董事会董事, BK科技感谢您在处理我关于尼日利亚传染病体外诊断市场信息请求的过程中所展现的支持和专业精神。感谢您的耐心、指导,以及您愿意提供的折扣,最终促成了这笔交易。我期待未来与 Insight Partners 继续合作,这一切都要归功于您与我初次接触后留下的良好印象。
奇吉奥克博士 ONYIA 董事总经理, PineCrest 医疗保健有限公司购买理由
- 明智的决策
- 了解市场动态
- 竞争分析
- 客户洞察
- 市场预测
- 风险规避
- 战略规划
- 投资论证
- 识别新兴市场
- 优化营销策略
- 提升运营效率
- 顺应监管趋势


