光ファイバーセンサー市場の概要、成長、トレンド、分析、調査レポート(2025-2031)
過去データ : 2021-2023 | 基準年 : 2024 | 予測期間 : 2025-2031光ファイバーセンサー市場の規模と予測(2021年 - 2031年)、世界および地域別のシェア、トレンド、成長機会分析レポートの対象範囲:センシングタイプ(温度センシング、圧力センシング、音響センシング、ひずみセンシングなど)、エンドユーザー(石油・ガス、製造、インフラ、航空宇宙・防衛、電力・公益事業など)、アプリケーション(パイプライン監視、上流アプリケーション、重要資産の火災検知、高電圧/電力ケーブル監視、CCS/CCUSアプリケーションなど)、および地域
- ステータス : 出版
- レポートコード : TIPTE100000943
- カテゴリー : エレクトロニクスおよび半導体
- ページ数 : 270
- 利用可能なレポート形式 :


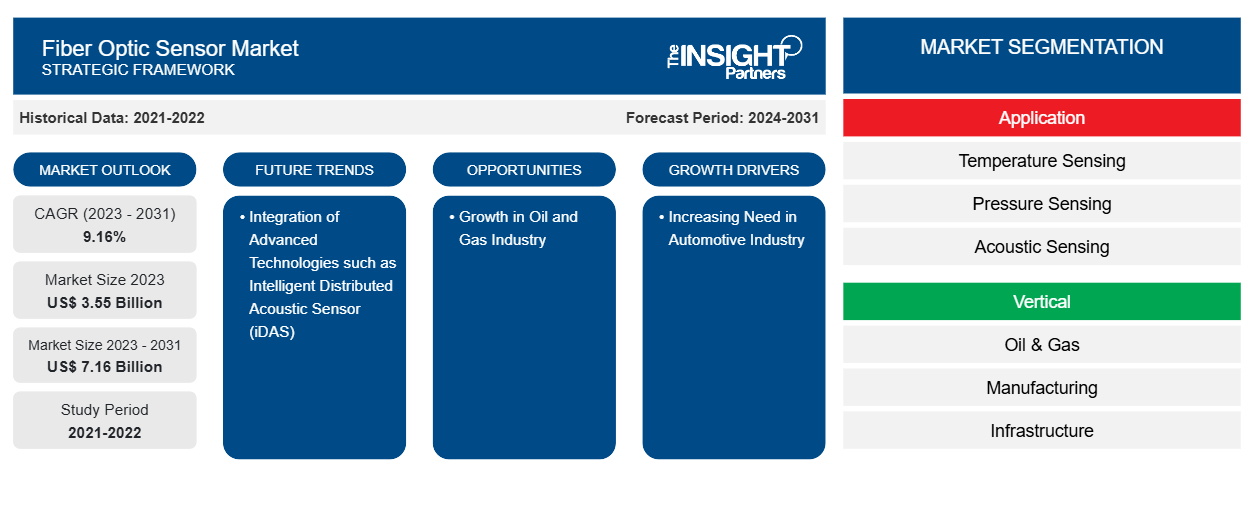
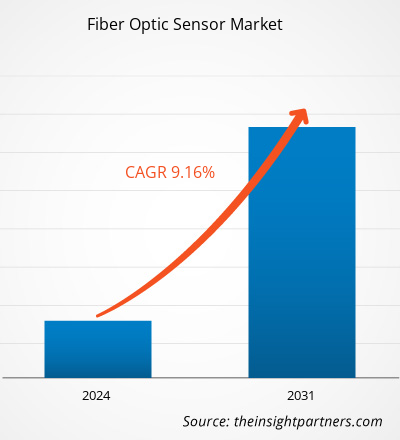
光ファイバーセンサー市場規模は、2024年の36億1,000万米ドルから2031年には67億6,000万米ドルに達すると予測されています。市場は2025年から2031年にかけて9.7%の年平均成長率(CAGR)を記録すると予想されています。今後数年間、小型化と携帯性の向上が市場に新たなトレンドをもたらすと予想されます。
光ファイバーセンサー市場分析
光ファイバーセンシングは、化学変化、歪み、温度、電場および磁場、圧力、変位、回転、放射線、液面、流量、光強度、振動を測定するために使用される技術です。光ファイバーセンサーは、光ファイバーを使用して環境の変化を検出するか(内在センサー)、リモートセンサーから処理装置に信号を伝送する(外在センサー)デバイスです。これらの小型センサーは、いくつかの利点があるため、リモートセンシングで広く使用されています。センシングポイントで電力を必要とせず、1本のファイバーで複数のセンサーをサポートできます。これらの利点により、光ファイバーセンサーは費用対効果が高く、長距離にわたる監視作業を効率的に行うことができます。光ファイバーセンサーは耐久性に優れ、極端な温度でも動作可能です。電気を伝送しないため、電気干渉、高電圧、可燃性物質の多い場所でも良好に機能します。そのため、石油・ガス、建設、航空宇宙、医療などの業界での使用に最適です。
光ファイバーセンサー市場の概要
石油・ガス分野におけるアプリケーションの急増と、様々な分野における構造ヘルスモニタリング(SHM)の需要の高まりは、光ファイバーセンサー市場を押し上げる主な要因です。これらのセンサーは、建物、パイプライン、輸送システムの安全性と効率性の向上に重要な役割を果たしています。石油・ガス、電力、通信などの業界でも、性能と信頼性の向上を目指してこれらのセンシング技術が採用されています。より多くの業界が自動化とスマートシステムへの移行を進めるにつれ、世界の光ファイバーセンサー市場は今後数年間で着実に成長すると予想されています。スマートシティの開発と再生可能エネルギー分野の成長は、近い将来、市場に大きな収益機会をもたらすでしょう。
このレポートの一部、国レベルの分析、Excelデータパックなど、あらゆるレポートを無料でカスタマイズできます。また、スタートアップや大学向けのお得なオファーや割引もご利用いただけます。
光ファイバーセンサー市場:戦略的洞察
-
このレポートの主要な市場動向を入手してください。この無料サンプルには、市場動向から見積もりや予測に至るまでのデータ分析が含まれます。
光ファイバーセンサー市場の推進要因と機会
構造健全性モニタリングの需要の急増
世界中でインフラの安全性とリアルタイム監視への関心が高まり、高度な構造ヘルスモニタリング(SHM)システムの需要が高まっています。近代都市の拡大とインフラの老朽化に伴い、橋梁、トンネル、ダム、建物などの構造物の損傷や故障の兆候を早期に検知する必要性が高まっています。抵抗型ひずみゲージなどの従来のシステムは、耐久性、長期的な精度、適応性の面で不十分な場合が多くあります。光ファイバーセンサーは、コンパクトな設計、耐腐食性、電磁干渉耐性などの利点を備え、従来の監視システムに代わる優れた選択肢として注目されています。さらに、構造物に直接埋め込むことができるという点も、その人気を高めています。これらの特性により、過酷な環境下でも長期的なSHMに最適です。これらのセンサーは、ひずみ、温度、振動、傾斜など、インフラの健全性と安全性を維持するために不可欠な重要な物理パラメータを正確に測定できます。
高まる需要に対応するため、光ファイバーセンサー市場の企業は、技術の規模拡大に向けた投資を確保しています。例えば、imecからのスピンオフ企業で光ファイバーセンサーの読み出しシステムのサプライヤーであるSenteaは、2021年に事業拡大のため約260万米ドル(230万ユーロ)を調達することに成功しました。この投資は2021年10月に発表されました。Finindus、PMV、QBIC II、Fidimecなどの投資家の支援を受けたSenteaの事業拡大イニシアチブは、土木工学、石油・ガス、再生可能エネルギー、医療用途における大規模な光ファイバーセンシングを可能にするために、フォトニック集積技術の進歩に重点を置いています。こうした投資は、SHM用途における光ファイバーセンシング技術の導入の可能性の高まりを反映しており、光ファイバーセンサー市場の成長を後押ししています。
スマートシティの開発
インド政府は2015年6月25日、「100スマートシティ・ミッション」を開始しました。これは、スマートソリューションの活用を通じて、近代的なインフラ、クリーンで持続可能な環境、そして生活の質の向上を実現する全国100都市の開発を目指しています。このミッションは、約64億米ドル(48,000クローレ)の中央政府資金に加え、州政府や官民パートナーシップ(PPP)を含むその他の資金源からの拠出による中央主導の支援制度の下、社会、経済、物理、制度といった包括的な都市開発を推進します。このミッションは、他の都市にも応用可能な、持続可能で包括的な都市成長モデルの創出を目指しています。欧州連合(EU)では、NetZeroCitiesがHorizon Europeプログラムの一環として、「2030年までに100の気候中立型スマートシティ」ミッションを支援しています。
スマートシティの拡大に伴い、光ファイバーセンサーなどの高度な監視ツールの需要はますます高まっていくでしょう。これらのセンサーは、リアルタイムのデータを提供し、過酷な環境でも優れた性能を発揮し、長寿命を実現しています。橋梁、道路、トンネル、建物、水道管、エネルギーシステムの監視に活用できます。例えば、橋の亀裂、パイプラインの漏水、電力網の温度変化などを検知し、都市当局が問題が深刻化する前に対策を講じるのに役立ちます。また、これらのセンサーはスマート交通システム、スマートグリッド、スマートビルディングにも活用でき、パフォーマンスと安全性の向上に貢献します。このように、スマートシティの台頭は、これらのセンサーがコネクテッドで効率的なシステムの構築に役立つため、光ファイバーセンサー市場に大きなビジネスチャンスをもたらします。
光ファイバーセンサー市場レポート:セグメンテーション分析
光ファイバーセンサー市場分析の導出に貢献した主なセグメントは、センシングタイプ、エンドユーザー、およびアプリケーションです。
- 光ファイバーセンサー市場は、センシングの種類に基づいて、温度センシング、圧力センシング、音響センシング、歪みセンシング、その他に分類されます。2024年には、温度センシングセグメントが市場シェアで最大を占めました。
- エンドユーザー別に見ると、光ファイバーセンサー市場は石油・ガス、製造業、インフラ、航空宇宙・防衛、電力・公益事業、その他に分類されます。2024年には石油・ガス分野が最大の市場シェアを占めました。
- 用途別に見ると、光ファイバーセンサー市場は、高電圧・高電力ケーブル監視、パイプライン監視、上流用途、重要資産の火災検知、CCS/CCUS用途、その他に分類されます。2024年には、その他分野が最大の市場シェアを占めました。
光ファイバーセンサー市場シェア分析(地域別)
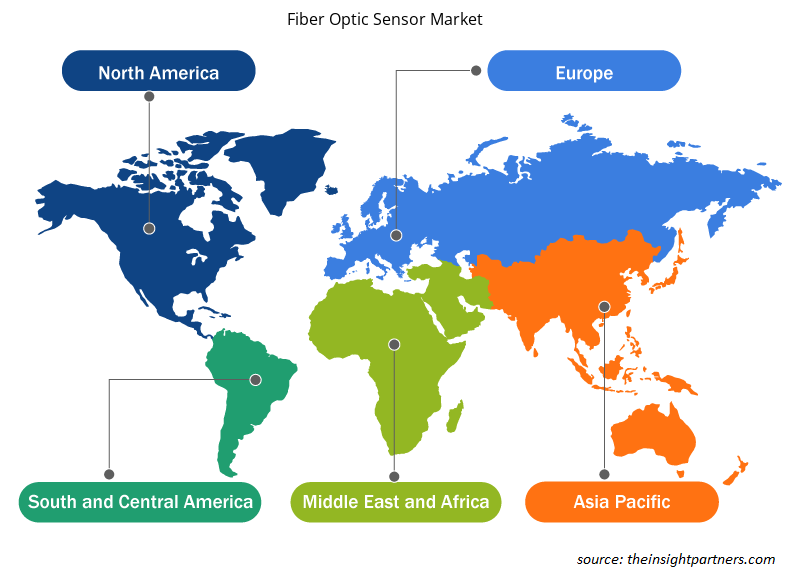
光ファイバーセンサー市場レポートの地理的範囲は、主に北米、アジア太平洋地域、欧州、中東・アフリカ、中南米の5つの地域に分かれています。2024年にはアジア太平洋地域が大きな市場シェアを占めました。
光ファイバーセンサー市場の地域別分析
Insight Partnersのアナリストは、予測期間を通じて光ファイバーセンサー市場に影響を与える地域的な動向と要因を詳細に解説しています。このセクションでは、北米、ヨーロッパ、アジア太平洋、中東・アフリカ、中南米における光ファイバーセンサー市場のセグメントと地域についても解説します。
- 光ファイバーセンサー市場の地域別データを入手
光ファイバーセンサー市場レポートの範囲
| レポート属性 | 詳細 |
|---|---|
| 2024年の市場規模 | 36億1000万米ドル |
| 2031年までの市場規模 | 67億6000万米ドル |
| 世界のCAGR(2025年~2031年) | 9.7% |
| 履歴データ | 2021-2023 |
| 予測期間 | 2025~2031年 |
| 対象セグメント |
センシングタイプ別
|
| 対象地域と国 |
北米
|
| 市場リーダーと主要企業の概要 |
|
光ファイバーセンサー市場のプレーヤー密度:ビジネスダイナミクスへの影響を理解する
光ファイバーセンサー市場は、消費者の嗜好の変化、技術の進歩、製品メリットへの認知度の高まりといった要因によるエンドユーザー需要の増加に牽引され、急速に成長しています。需要の増加に伴い、企業は製品ラインナップの拡充、消費者ニーズへの対応のための革新、そして新たなトレンドの活用を進めており、これが市場の成長をさらに加速させています。
市場プレーヤー密度とは、特定の市場または業界内で事業を展開する企業または会社の分布を指します。これは、特定の市場空間における競合企業(市場プレーヤー)の数が、その市場規模または市場価値全体と比較してどれだけ多いかを示します。
光ファイバーセンサー市場で事業を展開している主要企業は次のとおりです。
- バウマー・ホールディングAG
- ペッパール+フックス SE
- ウェングロー・センサリック社
- NEC株式会社
- プロキシミオンAB
- オムロン株式会社
免責事項:上記の企業は、特定の順序でランク付けされているわけではありません。
- 光ファイバーセンサー市場のトップキープレーヤーの概要を入手
光ファイバーセンサー市場のニュースと最近の動向
光ファイバーセンサー市場は、主要な企業出版物、協会データ、データベースなどを含む一次調査および二次調査を経て、定性・定量データを収集することで評価されます。市場における動向のいくつかを以下に示します。
Wenglorは、特に省スペース用途向けに設計されたP1XD光ファイバーアンプを発表しました。P1XD2シリーズは柔軟な統合オプションを提供し、アンプを単独で動作させることも、ネットワークシステムの一部としてマスターまたはスレーブとして動作させることも可能です。(出典:Wenglor、プレスリリース、2024年12月)
ハネウェル(NASDAQ: HON)とシビタナビ・システムズ(EURONEXT MILAN: CNS)は、世界中の民間および防衛分野のお客様向けに、新しい慣性計測ユニットを発表しました。HG2800ファミリーは、低ノイズ、高帯域幅、高性能、タクティカルグレードの慣性計測ユニットで構成され、民間航空機および軍用航空機の指向、安定化、短時間航法などの用途向けに設計されています。(出典:ハネウェル、プレスリリース、2023年9月)
光ファイバーセンサー市場レポートの対象範囲と成果物
「光ファイバーセンサー市場の規模と予測(2021〜2031年)」レポートでは、以下の分野を網羅した市場の詳細な分析を提供しています。
- スコープに含まれるすべての主要市場セグメントにおける世界、地域、国レベルでの光ファイバーセンサー市場規模と予測
- 光ファイバーセンサー市場の動向、および推進要因、制約、主要な機会などの市場動向
- 詳細なPEST分析とSWOT分析
- 主要な市場動向、世界および地域の枠組み、主要プレーヤー、規制、最近の市場動向を網羅した光ファイバーセンサー市場分析
- 市場集中、ヒートマップ分析、主要プレーヤー、光ファイバーセンサー市場の最近の動向を網羅した業界の展望と競争分析
- 詳細な企業プロフィール

Naveenは、カスタム、シンジケート、コンサルティングの各プロジェクトにおいて9年以上の実績を持つ、経験豊富な市場調査およびコンサルティングのプロフェッショナルです。現在はアソシエイトバイスプレジデントを務め、プロジェクトバリューチェーン全体にわたるステークホルダー管理を成功させ、100件以上の調査レポートと30件以上のコンサルティング案件を執筆しています。産業および政府機関のプロジェクトに幅広く携わり、クライアントの成功とデータに基づく意思決定に大きく貢献しています。
Naveenは、カルナータカ州VTUで電子通信工学の学位を取得し、マニパル大学でマーケティング&オペレーションズのMBAを取得しています。IEEEの会員として9年間活動し、会議や技術シンポジウムへの参加、セクションレベルおよび地域レベルでのボランティア活動に積極的に取り組んでいます。現職以前は、IndustryARCでアソシエイト戦略コンサルタント、Hewlett Packard(HP Global)で産業用サーバーコンサルタントを務めていました。
- 過去2年間の分析、基準年、CAGRによる予測(7年間)
- PEST分析とSWOT分析
- 市場規模価値/数量 - 世界、地域、国
- 業界と競争環境
- Excel データセット
お客様の声
Insight PartnersのSCADAシステム市場レポートは包括的で、現在のトレンドと将来の予測に関する貴重な洞察が含まれています。チームは終始、非常にプロフェッショナルで、対応が早く、サポートも充実していました。私たちは彼らのサービスに非常に満足しており、強くお勧めします。
ラン・ケデム パートナー, レアリテクノロジーズ株式会社非常に特殊なソフトウェア市場に関するレポートを依頼したところ、チームは数日でレポートを作成してくれました。情報は非常に関連性が高く、分かりやすくまとめられていました。その後、レポートにいくつか修正と追加を依頼しましたが、チームは非常に迅速に対応し、1週間も経たないうちに最終レポートを受け取ることができました。
ジャン=エルヴェ・ジェン 会長, フューチャー・アナリティカ重要な市場調査と予測のために、The Insight Partnersと協力しました。彼らは機会とリスクに関する明確な洞察を提供し、私たちの計画策定に役立ちました。彼らの調査は使いやすく、確かなデータに基づいており、賢明で自信に満ちた意思決定に役立ちました。彼らを強くお勧めします。
ピユーシュ・ナグパル 上級副社長, ハイビームグローバルInsight Partnersは、深い専門知識に基づき、洞察力に富み、構造化された市場調査を提供しました。チームは終始プロフェッショナルで、対応力も抜群でした。ユーザーフレンドリーなウェブサイトにより、業界レポートへのアクセスもスムーズでした。信頼性の高い高品質な調査サービスをお探しなら、Insight Partnersを強くお勧めします。
安達幸彦 最高経営責任者(CEO), ディープブルーLLC。The Insight Partnersから市場レポートを購入するのは今回が初めてです。最初は不安でしたが、ウェブサイトを見て、リスクを負ってでも購入してみようという気持ちになりました。レポートの品質とカスタマーサービスには大変満足しています。最初のレポートにはいくつか質問やコメントがありましたが、アナリストとメールで何度かやり取りした結果、戦略策定プロセスへのインプットとして活用できるレポートが完成しました。貴重なお時間を割いていただき、貴重な体験をさせていただき、誠にありがとうございました。他の方にもぜひお勧めしたいですし、今後さらに市場データが必要になった際には、まずThe Insight Partnersにご連絡させていただきます。
ジョン・スズキ 社長兼最高経営責任者、取締役, BKテクノロジーズナイジェリアの感染症IVD市場に関する情報提供依頼に対し、ご対応いただいた際、ご尽力とプロフェッショナルな姿勢に深く感謝申し上げます。忍耐強く、的確なアドバイスをいただき、また、最終的に取引成立に至った割引のご提供にも深く感謝申し上げます。今回の最初の出会いで得た強い印象のおかげで、今後もThe Insight Partnersとの連携を心待ちにしております。
チジオケ博士 オニア マネージングディレクター, パインクレストヘルスケア株式会社購入理由
- 情報に基づいた意思決定
- 市場動向の理解
- 競合分析
- 顧客インサイト
- 市場予測
- リスク軽減
- 戦略計画
- 投資の正当性
- 新興市場の特定
- マーケティング戦略の強化
- 業務効率の向上
- 規制動向への対応


 無料サンプルを入手 - 光ファイバーセンサー市場