
Marktübersicht für Glasfasersensoren, Wachstum, Trends, Analyse, Forschungsbericht (2025-2031)
Marktgröße und Prognose für Glasfasersensoren (2021 – 2031), Bericht über globale und regionale Anteile, Trends und Wachstumschancenanalysen: Nach Sensortyp (Temperatursensorik, Drucksensorik, Akustiksensorik, Dehnungssensorik und andere), Endbenutzer (Öl und Gas, Fertigung, Infrastruktur, Luft- und Raumfahrt und Verteidigung, Energie und Versorgung und andere), Anwendung (Pipeline-Überwachung, Upstream-Anwendung, Branderkennung in kritischen Anlagen, Überwachung von Hochspannungs-/Stromkabeln, CCS/CCUS-Anwendung, andere) und Geografie
- Status : Veröffentlicht
- Berichtscode : TIPTE100000943
- Kategorie : Elektronik und Halbleiter
- Anzahl der Seiten : 270
- Verfügbare Berichtsformate :


- Datum der letzten Aktualisierung : June 23, 2025

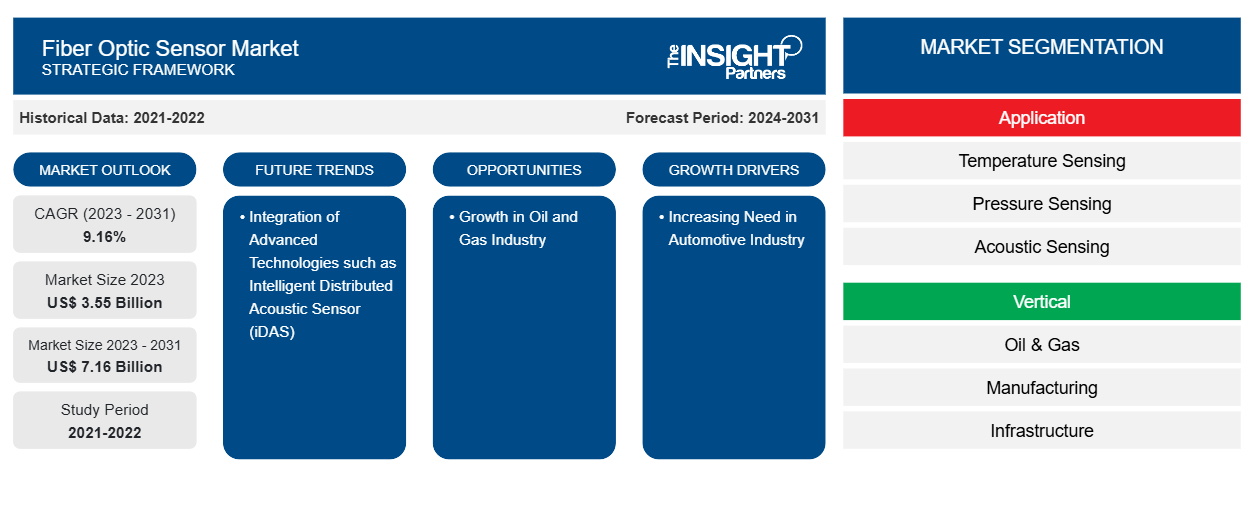
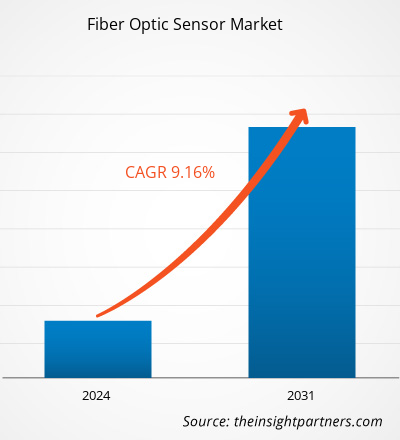
Der Markt für faseroptische Sensoren wird voraussichtlich von 3,61 Milliarden US-Dollar im Jahr 2024 auf 6,76 Milliarden US-Dollar im Jahr 2031 anwachsen. Für den Zeitraum 2025–2031 wird eine durchschnittliche jährliche Wachstumsrate (CAGR) von 9,7 % erwartet. Miniaturisierung und Portabilität dürften in den kommenden Jahren neue Trends auf den Markt bringen.
Marktanalyse für faseroptische Sensoren
Die optische Fasersensorik ist eine Technologie zur Messung von chemischen Veränderungen, Dehnung, Temperatur, elektrischen und magnetischen Feldern, Druck, Verschiebung, Rotation, Strahlung, Flüssigkeitsstand, Durchfluss, Lichtintensität und Vibrationen. Ein faseroptischer Sensor ist ein Gerät, das Glasfaser entweder zur Erkennung von Veränderungen in der Umgebung (sogenannte intrinsische Sensoren) oder zur Übertragung von Signalen von einem entfernten Sensor zu Verarbeitungsgeräten (sogenannte extrinsische Sensoren) verwendet. Diese winzigen Sensoren werden aufgrund mehrerer Vorteile häufig in der Fernerkundung eingesetzt. Sie benötigen keinen Strom am Messpunkt, und eine einzige Faser kann mehrere Sensoren versorgen. Diese Vorteile machen sie kostengünstig und effizient für die Überwachung von Vorgängen über große Entfernungen. Glasfasersensoren sind langlebig und können bei extremen Temperaturen betrieben werden. Da sie keinen Strom übertragen, funktionieren sie auch in Bereichen mit hohen elektrischen Störungen, Hochspannung oder brennbaren Materialien gut; das macht sie ideal für den Einsatz in Branchen wie der Öl- und Gasindustrie, dem Bauwesen, der Luft- und Raumfahrt sowie dem Gesundheitswesen.
Marktübersicht für faseroptische Sensoren
Zunehmende Anwendungen im Öl- und Gassektor und die wachsende Nachfrage nach Strukturüberwachung (SHM) in verschiedenen Sektoren sind die Hauptfaktoren, die den Markt für faseroptische Sensoren stärken. Diese Sensoren spielen eine entscheidende Rolle bei der Verbesserung von Sicherheit und Effizienz in Gebäuden, Pipelines und Transportsystemen. Auch Branchen wie Öl und Gas, Energie und Telekommunikation setzen diese Sensortechnologien ein, um Leistung und Zuverlässigkeit zu verbessern. Da immer mehr Branchen auf Automatisierung und intelligentere Systeme setzen, wird der globale Markt für faseroptische Sensoren in den kommenden Jahren voraussichtlich stetig wachsen. Die Entwicklung von Smart Cities und das Wachstum im Bereich der erneuerbaren Energien werden in naher Zukunft lukrative Marktchancen schaffen.
Sie erhalten kostenlos Anpassungen an jedem Bericht, einschließlich Teilen dieses Berichts oder einer Analyse auf Länderebene, eines Excel-Datenpakets sowie tolle Angebote und Rabatte für Start-ups und Universitäten
Markt für faseroptische Sensoren: Strategische Einblicke
-
Informieren Sie sich über die wichtigsten Markttrends in diesem Bericht.Dieses KOSTENLOSE Beispiel umfasst Datenanalysen, von Markttrends bis hin zu Schätzungen und Prognosen.
Markttreiber und Chancen für faseroptische Sensoren
Wachsende Nachfrage nach Strukturüberwachung
Weltweit rücken Infrastruktursicherheit und Echtzeitüberwachung zunehmend in den Fokus, was die Nachfrage nach fortschrittlichen Systemen zur Strukturüberwachung (Structural Health Monitoring, SHM) steigert. Mit der Ausdehnung moderner Städte und der Alterung der Infrastruktur besteht ein ständiger Bedarf, frühzeitig Anzeichen von Schäden oder Versagen an Bauwerken wie Brücken, Tunneln, Dämmen und Gebäuden zu erkennen. Herkömmliche Systeme wie resistive Dehnungsmessstreifen weisen häufig Mängel in Bezug auf Haltbarkeit, Langzeitgenauigkeit und Anpassungsfähigkeit auf. Glasfasersensoren haben sich als überlegene Alternative zu herkömmlichen Überwachungssystemen etabliert und bieten Vorteile wie kompaktes Design, Korrosionsbeständigkeit und Toleranz gegenüber elektromagnetischen Störungen. Zudem trägt ihre Möglichkeit, direkt in Strukturen eingebettet zu werden, zu ihrer Beliebtheit bei. Diese Eigenschaften machen sie ideal für die langfristige Strukturüberwachung, selbst in anspruchsvollen Umgebungen. Diese Sensoren können wichtige physikalische Parameter wie Dehnung, Temperatur, Vibration und Neigung genau messen, die für die Aufrechterhaltung der Integrität und Sicherheit der Infrastruktur unerlässlich sind.SHM) systems. With the expansion of modern cities and the aging of infrastructure, there is a constant need to detect early signs of damage or failure in structures such as bridges, tunnels, dams, and buildings. Traditional systems such as resistive strain gauges often fall short in terms of durability, long-term accuracy, and adaptability. Fiber optic sensors have risen as a superior alternative to traditional monitoring systems, offering benefits such as compact design, corrosion resistance, and electromagnetic interference tolerance. Moreover, their ability to be embedded directly into structures is adding to their popularity. These qualities make them ideal for long-term SHM, even in challenging environments. These sensors can accurately measure key physical parameters such as strain, temperature, vibration, and tilt, which are essential for maintaining the integrity and safety of infrastructure.
Um der steigenden Nachfrage gerecht zu werden, investieren Unternehmen im Markt für faseroptische Sensoren in die Skalierung ihrer Technologien. So konnte beispielsweise Sentea – ein Spin-off von imec und Anbieter von Auslesesystemen für faseroptische Sensoren – im Jahr 2021 erfolgreich rund 2,6 Millionen US-Dollar (2,3 Millionen Euro) für den Ausbau seines Geschäfts einwerben. Die Ankündigung dieser Investition erfolgte im Oktober 2021. Unterstützt von Investoren wie Finindus, PMV, QBIC II und Fidimec konzentriert sich Senteas Expansionsinitiative auf die Weiterentwicklung photonischer integrierter Technologie, um großflächige faseroptische Sensorik in den Bereichen Bauingenieurwesen, Öl und Gas, erneuerbare Energien und Medizin zu ermöglichen. Solche Investitionen spiegeln das wachsende Potenzial für den Einsatz faseroptischer Sensortechnologie in SHM-Anwendungen wider und fördern so das Wachstum des Marktes für faseroptische Sensoren. Sentea—a spin-off from imec and a supplier of read-out systems for fiber optic sensors—successfully raised ~US$ 2.6 million (EUR 2.3 million) in 2021 to expand its business. The announcement of this investment was made in October 2021. Backed by investors such as Finindus, PMV, QBIC II, and Fidimec, Sentea's expansion initiative focuses on advancing photonic integrated technology to enable large-scale fiber optic sensing across civil engineering, oil and gas, renewable energy, and medical applications. Such investments reflect the growing potential for the deployment of fiber optic sensing technology in SHM applications, thereby fueling the growth of the fiber optic sensor market.
Entwicklung von Smart Cities
Die indische Regierung startete am 25. Juni 2015 die „100 Smart Cities Mission“ mit dem Ziel, landesweit 100 Städte mit moderner Infrastruktur, einer sauberen und nachhaltigen Umwelt sowie verbesserter Lebensqualität durch den Einsatz intelligenter Lösungen zu entwickeln. Die Mission fördert eine ganzheitliche Stadtentwicklung – sozial, wirtschaftlich, physisch und institutionell – im Rahmen eines zentral geförderten Programms mit rund 6.400 Millionen US-Dollar (48.000 Crore INR) an zentraler Finanzierung, ergänzt durch Bundesländer und andere Quellen, darunter öffentlich-private Partnerschaften (ÖPP). Ziel der Mission ist es, replizierbare Modelle für nachhaltiges und integratives Stadtwachstum zu schaffen, denen andere Städte folgen können. In der Europäischen Union (EU) unterstützt NetZeroCities die Mission „100 klimaneutrale und intelligente Städte bis 2030“ im Rahmen des Programms Horizont Europa.
Mit der Expansion von Smart Cities steigt der Bedarf an modernen Überwachungsinstrumenten wie Glasfasersensoren weiter an. Diese Sensoren liefern Echtzeitdaten, funktionieren auch unter rauen Bedingungen zuverlässig und sind langlebig. Sie eignen sich zur Überwachung von Brücken, Straßen, Tunneln, Gebäuden, Wasserleitungen und Energiesystemen. Sie erkennen beispielsweise Risse in Brücken, Lecks in Rohrleitungen oder Temperaturschwankungen in Stromnetzen und helfen so den Stadtbehörden, rechtzeitig Maßnahmen zu ergreifen, bevor Probleme entstehen. Auch in intelligenten Verkehrssystemen, intelligenten Stromnetzen und intelligenten Gebäuden können diese Sensoren eingesetzt werden, um Leistung und Sicherheit zu verbessern. Der Aufstieg von Smart Cities bietet somit lukrative Chancen für den Markt für Glasfasersensoren, da diese Sensoren zur Schaffung vernetzter, effizienter Systeme beitragen.
Segmentierungsanalyse des Marktberichts für faseroptische Sensoren
Wichtige Segmente, die zur Ableitung der Marktanalyse für Glasfasersensoren beigetragen haben , sind Sensortyp, Endbenutzer und Anwendung.
- Basierend auf dem Sensortyp ist der Markt für faseroptische Sensoren in Temperatursensoren, Drucksensoren, Akustiksensoren, Dehnungssensoren und weitere unterteilt. Das Segment Temperatursensoren hatte im Jahr 2024 den größten Marktanteil.
- Basierend auf dem Endverbraucher ist der Markt für faseroptische Sensoren in die Bereiche Öl und Gas, Fertigung, Infrastruktur, Luft- und Raumfahrt und Verteidigung, Energie und Versorgung sowie weitere Segmente unterteilt. Das Öl- und Gassegment hatte im Jahr 2024 den größten Marktanteil.
- Der Markt für Glasfasersensoren ist je nach Anwendung in die Überwachung von Hochspannungs- oder Hochleistungskabeln, die Überwachung von Pipelines , Upstream-Anwendungen, Branderkennung in kritischen Anlagen, CCS/CCUS-Anwendungen und weitere Segmente unterteilt. Das Segment „Sonstige“ hatte 2024 den größten Marktanteil.
Marktanteilsanalyse für Glasfasersensoren nach Geografie
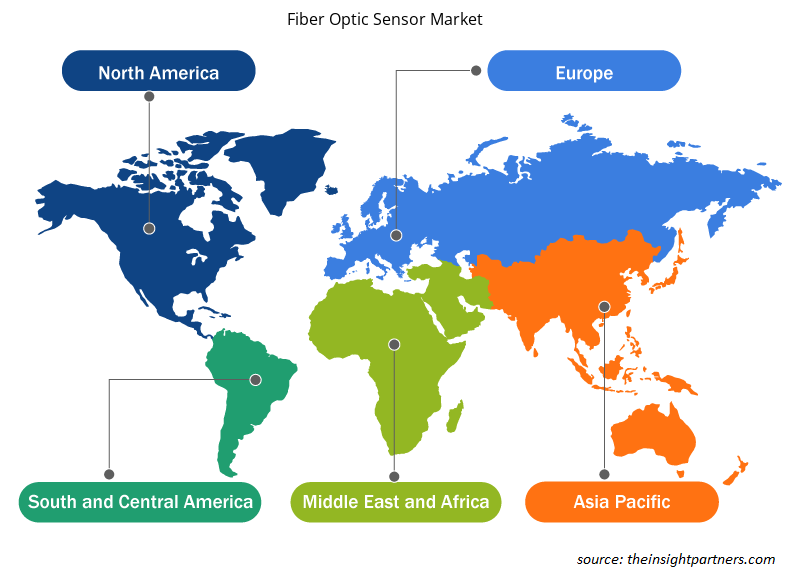
Der geografische Umfang des Marktberichts für faseroptische Sensoren ist hauptsächlich in fünf Regionen unterteilt: Nordamerika, Asien-Pazifik, Europa, Naher Osten und Afrika sowie Süd- und Mittelamerika. Der asiatisch-pazifische Raum hatte im Jahr 2024 einen bedeutenden Marktanteil.
Regionale Einblicke in den Markt für Glasfasersensoren
Die Analysten von Insight Partners haben die regionalen Trends und Faktoren, die den Markt für Glasfasersensoren im Prognosezeitraum beeinflussen, ausführlich erläutert. In diesem Abschnitt werden auch die Marktsegmente und die geografische Lage für Glasfasersensoren in Nordamerika, Europa, Asien-Pazifik, dem Nahen Osten und Afrika sowie Süd- und Mittelamerika erläutert.
- Erhalten Sie regionale Daten zum Markt für Glasfasersensoren
Umfang des Marktberichts für faseroptische Sensoren
| Berichtsattribut | Details |
|---|---|
| Marktgröße im Jahr 2024 | 3,61 Milliarden US-Dollar |
| Marktgröße bis 2031 | 6,76 Milliarden US-Dollar |
| Globale CAGR (2025 – 2031) | 9,7 % |
| Historische Daten | 2021-2023 |
| Prognosezeitraum | 2025–2031 |
| Abgedeckte Segmente |
Nach Sensortyp
|
| Abgedeckte Regionen und Länder |
Nordamerika
|
| Marktführer und wichtige Unternehmensprofile |
|
Marktteilnehmerdichte für Glasfasersensoren: Auswirkungen auf die Geschäftsdynamik
Der Markt für Glasfasersensoren wächst rasant. Die steigende Endverbrauchernachfrage ist auf Faktoren wie veränderte Verbraucherpräferenzen, technologische Fortschritte und ein stärkeres Bewusstsein für die Produktvorteile zurückzuführen. Mit der steigenden Nachfrage erweitern Unternehmen ihr Angebot, entwickeln Innovationen, um den Verbraucherbedürfnissen gerecht zu werden, und nutzen neue Trends, was das Marktwachstum weiter ankurbelt.
Die Marktteilnehmerdichte beschreibt die Verteilung der in einem bestimmten Markt oder einer bestimmten Branche tätigen Unternehmen. Sie gibt an, wie viele Wettbewerber (Marktteilnehmer) in einem bestimmten Marktraum im Verhältnis zu dessen Größe oder Gesamtmarktwert präsent sind.
Die wichtigsten Unternehmen auf dem Markt für Glasfasersensoren sind:
- Baumer Holding AG
- Pepperl+Fuchs SE
- Wenglor Sensoric GmbH
- NEC Corp
- Proximion AB
- OMRON Corp
Haftungsausschluss : Die oben aufgeführten Unternehmen sind nicht in einer bestimmten Reihenfolge aufgeführt.
- Überblick über die wichtigsten Akteure auf dem Markt für Glasfasersensoren
Marktnachrichten und aktuelle Entwicklungen im Bereich Glasfasersensoren
Der Markt für faseroptische Sensoren wird durch die Erhebung qualitativer und quantitativer Daten aus Primär- und Sekundärforschung bewertet. Dazu zählen wichtige Unternehmenspublikationen, Verbandsdaten und Datenbanken. Nachfolgend sind einige der Marktentwicklungen aufgeführt:
Wenglor hat den Glasfaserverstärker P1XD vorgestellt, der speziell für kompakte Raumanwendungen entwickelt wurde. Die Modelle der P1XD2-Serie bieten flexible Integrationsmöglichkeiten, sodass der Verstärker unabhängig oder als Teil eines vernetzten Systems sowohl als Master als auch als Subordinate eingesetzt werden kann. (Quelle: Wenglor, Pressemitteilung, Dezember 2024)
Honeywell (NASDAQ: HON) und Civitanavi Systems (EURONEXT MILAN: CNS) haben eine neue Trägheitsmesseinheit für kommerzielle und militärische Kunden weltweit auf den Markt gebracht. Die HG2800-Familie besteht aus rauscharmen, bandbreitenstarken und leistungsstarken Trägheitsmesseinheiten in taktischer Qualität, die unter anderem für die Ausrichtung, Stabilisierung und Kurzzeitnavigation in Verkehrs- und Militärflugzeugen entwickelt wurden. (Quelle: Honeywell, Pressemitteilung, September 2023)
Marktbericht zu faseroptischen Sensoren: Umfang und Ergebnisse
Der Bericht „Marktgröße und Prognose für Glasfasersensoren (2021–2031)“ bietet eine detaillierte Analyse des Marktes, die die folgenden Bereiche abdeckt:
- Marktgröße und Prognose für Glasfasersensoren auf globaler, regionaler und Länderebene für alle wichtigen Marktsegmente, die im Rahmen des Geltungsbereichs abgedeckt sind
- Markttrends für Glasfasersensoren sowie Marktdynamiken wie Treiber, Einschränkungen und wichtige Chancen
- Detaillierte PEST- und SWOT-Analyse
- Marktanalyse für Glasfasersensoren mit wichtigen Markttrends, globalen und regionalen Rahmenbedingungen, wichtigen Akteuren, Vorschriften und aktuellen Marktentwicklungen
- Branchenlandschaft und Wettbewerbsanalyse mit Marktkonzentration, Heatmap-Analyse, prominenten Akteuren und jüngsten Entwicklungen auf dem Markt für faseroptische Sensoren
- Detaillierte Firmenprofile

Naveen ist ein erfahrener Marktforschungs- und Beratungsexperte mit über 9 Jahren Erfahrung in kundenspezifischen, syndizierten und Beratungsprojekten. In seiner aktuellen Funktion als Associate Vice President hat er erfolgreich Stakeholder entlang der gesamten Projektwertschöpfungskette gemanagt und ist Autor von über 100 Forschungsberichten und über 30 Beratungsaufträgen. Seine Arbeit erstreckt sich auf Industrie- und Regierungsprojekte und trägt maßgeblich zum Kundenerfolg und zur datengesteuerten Entscheidungsfindung bei.
Naveen hat einen Ingenieursabschluss in Elektronik und Kommunikation von der VTU, Karnataka, und einen MBA in Marketing und Operations von der Manipal University. Er ist seit 9 Jahren aktives IEEE-Mitglied und nimmt an Konferenzen und technischen Symposien teil und engagiert sich ehrenamtlich auf Sektions- und regionaler Ebene. Vor seiner aktuellen Position arbeitete er als Associate Strategic Consultant bei IndustryARC und als Industrial Server Consultant bei Hewlett Packard (HP Global).
- Umfassende Analyse der Marktgröße und Prognosen
- Detaillierte Segmentierungsanalyse
- Tiefgehende Bewertung der Marktdynamik
- Einblicke auf regionaler und nationaler Ebene
- Wettbewerbslandschaft und Unternehmens-Benchmarking
- Strategische Business Intelligence
Erfahrungsberichte
Der SCADA-Systemmarktbericht von Insight Partners ist umfassend und bietet wertvolle Einblicke in aktuelle Trends und Zukunftsprognosen. Das Team war durchweg hochprofessionell, reaktionsschnell und hilfsbereit. Wir sind sehr zufrieden und können die Dienstleistungen wärmstens empfehlen.
RAN KEDEM Partner, Reali Technologies LTDsIch habe einen Bericht über einen sehr spezifischen Softwaremarkt angefordert, und das Team hat ihn innerhalb weniger Tage erstellt. Die Informationen waren sehr relevant und gut präsentiert. Anschließend habe ich einige Änderungen und Ergänzungen zum Bericht angefordert. Das Team reagierte erneut sehr schnell, und ich erhielt den Abschlussbericht in weniger als einer Woche.
JEAN-HERVE JENN Vorsitzende, Future AnalyticaWir haben mit The Insight Partners für eine wichtige Marktstudie und Prognose zusammengearbeitet. Sie gaben uns klare Einblicke in Chancen und Risiken, die uns bei der Gestaltung unserer Pläne halfen. Ihre Recherchen waren benutzerfreundlich und basierten auf soliden Daten. Sie halfen uns, kluge und sichere Entscheidungen zu treffen. Wir können sie wärmstens empfehlen.
PIYUSH NAGPAL Sr. Vizepräsident, Fernlicht GlobalDie Insight Partners lieferten aufschlussreiche, gut strukturierte Marktforschung mit fundierter Fachkompetenz. Ihr Team war durchweg professionell und reaktionsschnell. Die benutzerfreundliche Website ermöglichte den Zugriff auf Branchenberichte. Wir empfehlen sie wärmstens für zuverlässige und hochwertige Forschungsdienstleistungen.
YUKIHIKO ADACHI Geschäftsführer, Deep Blue, LLC.Dies ist das erste Mal, dass ich einen Marktbericht von The Insight Partners erworben habe. Obwohl ich zunächst unsicher war, besuchte ich die Website und fühlte mich dann sicherer, das Risiko einzugehen und einen Marktbericht zu kaufen. Ich bin mit der Qualität des Berichts und dem Kundenservice rundum zufrieden. Ich hatte einige Fragen und Anmerkungen zum ersten Bericht, aber nach einigen E-Mail-Gesprächen mit dem Analysten bin ich überzeugt, dass ich einen Bericht habe, den ich als Input für unseren strategischen Planungsprozess verwenden kann. Vielen Dank, dass Sie sich die Zeit genommen und dies zu einer positiven Erfahrung gemacht haben. Ich werde Ihren Service auf jeden Fall weiterempfehlen und Sie werden meine erste Anlaufstelle sein, wenn wir weitere Marktdaten benötigen.
JOHN SUZUKI Präsident und Chief Executive Officer, Vorstandsmitglied, BK TechnologiesIch möchte mich für Ihre Unterstützung und die Professionalität bedanken, die Sie bei der Bearbeitung meiner Informationsanfrage zum IVD-Markt für Infektionskrankheiten in Nigeria gezeigt haben. Ich schätze Ihre Geduld, Ihre Beratung und die Tatsache, dass Sie bereit waren, einen Rabatt anzubieten, der uns schließlich den Abschluss eines Geschäfts ermöglichte. Ich freue mich darauf, The Insight Partners in Zukunft wieder zu beauftragen, dank des Eindrucks, den Sie bei dieser ersten Begegnung bei mir hinterlassen haben.
DR. CHIJIOKE ONYIA GESCHÄFTSFÜHRERIN, PineCrest Healthcare Ltd.Grund zum Kauf
- Fundierte Entscheidungsfindung
- Marktdynamik verstehen
- Wettbewerbsanalyse
- Kundeneinblicke
- Marktprognosen
- Risikominimierung
- Strategische Planung
- Investitionsbegründung
- Identifizierung neuer Märkte
- Verbesserung von Marketingstrategien
- Steigerung der Betriebseffizienz
- Anpassung an regulatorische Trends


