


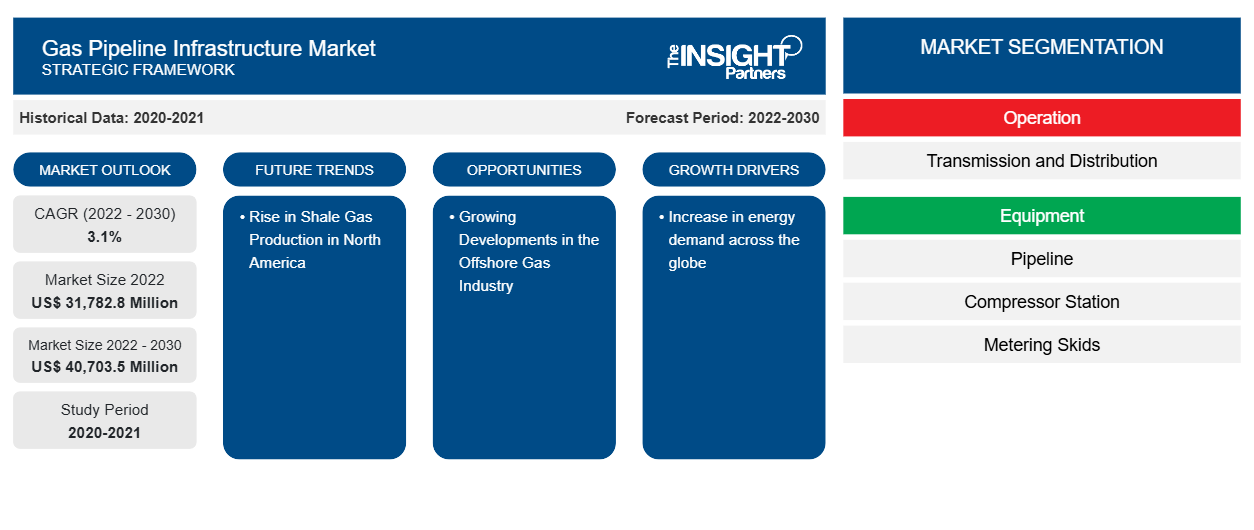
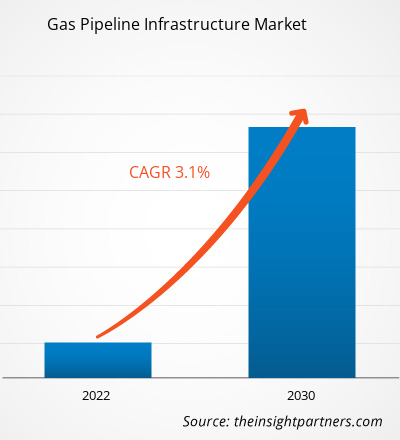
预计到 2030 年,天然气管道基础设施市场规模将从 2022 年的 317.828 亿美元增至 407.035 亿美元。预计 2022-2030 年市场复合年增长率为 3.1%。CAGR of 3.1% in 2022–2030.
天然气管道基础设施市场分析
天然气市场高度动态,需要流动性、灵活性和透明度才能有效运作。因此,需要多个供应源、多个用户以及全面的输送和分配基础设施。美国、欧洲和亚太地区的天然气市场发展迅速,预计随着未来天然气需求的增加,这将推动天然气管道基础设施的增长。
天然气管道基础设施市场概况
天然气管道基础设施生态系统包括生产阶段,即从地下储层开采天然气。勘探和生产公司采用钻井技术开采原始天然气。开采后,通常会对天然气进行加工以去除杂质,然后压缩以便运输。生产阶段需要考虑地质因素、开采技术和环境影响评估。从事天然气生产的主要参与者是荷兰皇家壳牌、埃克森美孚公司、俄罗斯天然气工业股份公司、康菲石油公司和道达尔能源公司。天然气管道输送网络的主要参与者包括 Kinder Morgan Inc.、Enbridge Inc.、TC Energy Corporation、Pembina Pipeline Corporation 和 Texas Gas Transmission LLC 等。
定制此报告以满足您的需求
您可以免费定制任何报告,包括本报告的部分内容、国家级分析、Excel 数据包,以及为初创企业和大学提供优惠和折扣
天然气管道基础设施市场:战略洞察
-
获取此报告的关键市场趋势。这个免费样品将包括数据分析,从市场趋势到估计和预测。
天然气管道基础设施市场驱动因素和机遇
全球能源需求的增长预计将成为天然气管道基础设施市场的主要驱动力
人口增长和城市化进程加快是推动全球能源消费的几个因素。天然气在发电方面具有潜在应用,从而推动了其需求。此外,由于俄乌战争导致欧洲能源不确定性增加,一些国家的政府也在推动天然气的应用。因此,能源需求的增加推动了天然气管道基础设施市场的增长
北美页岩气产量上升
北美已成为全球领先的页岩气生产国之一。加拿大是全球第五大天然气生产国和第四大天然气出口国。加拿大的主要页岩气储量包括不列颠哥伦比亚省东北部的霍恩河盆地和蒙特尼页岩、魁北克省的尤蒂卡页岩、阿尔伯塔省和萨斯喀彻温省的科罗拉多页岩群以及新不伦瑞克省和新斯科舍省的霍顿布拉夫页岩。地缘政治动荡导致的能源不确定性正在推动北美页岩气的生产,这可能为未来几年天然气管道基础设施市场的增长创造重大机遇。
天然气管道基础设施市场报告细分分析
有助于得出天然气管道基础设施市场分析的关键部分是运营、设备和应用。
- 根据运营情况,天然气管道基础设施市场分为输送和配送。配送部门在 2022 年占据了更大的市场份额。
- 在设备方面,市场细分为管道、压缩机站、计量滑橇等。管道部分在 2022 年占据了市场主导地位。
- 在应用方面,市场已细分为陆上和海上。2022 年,陆上部分占据了市场主导地位。
天然气管道基础设施市场份额(按地区)分析
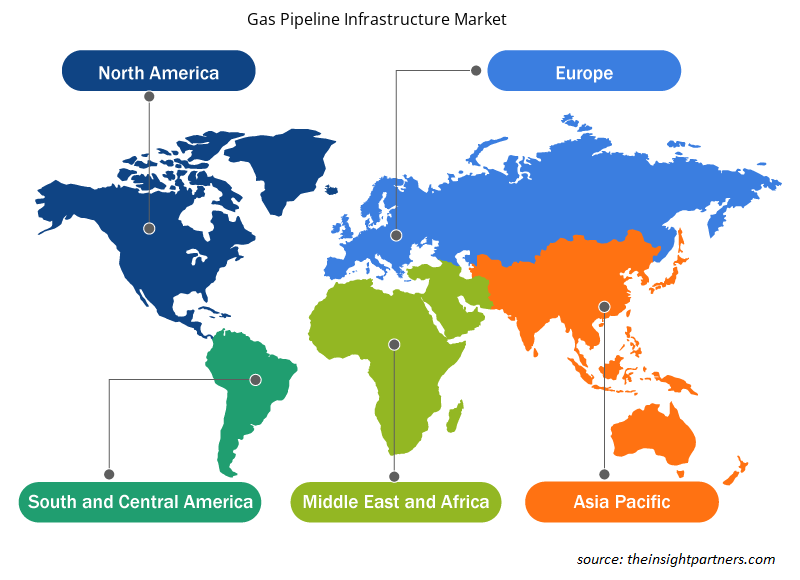
天然气管道基础设施市场报告的地理范围主要分为五个地区:北美、欧洲、亚太、中东和非洲、南美。
北美是主要的天然气出口国之一。不断增长的能源需求和日益增长的天然气应用正在推动北美天然气管道基础设施市场的发展。2022 年,美国展示了最高的天然气生产能力,其次是加拿大和墨西哥。Ixachi、Coulomb Phase 2、Quesqui、Nejo (IEPC)、Leo、May、Koban 和 Powerball 是北美一些天然气生产田。Ixachi 工厂位于墨西哥韦拉克鲁斯,2022 年的产量为 618.09mmcfd(百万立方英尺/天)。此外,预计在预测期内,政府为发展天然气管道基础设施而采取的举措和资金数量不断增加,将推动天然气管道基础设施市场的发展。
天然气管道基础设施市场区域洞察
Insight Partners 的分析师已详尽解释了预测期内影响天然气管道基础设施市场的区域趋势和因素。本节还讨论了北美、欧洲、亚太地区、中东和非洲以及南美和中美洲的天然气管道基础设施市场细分和地理位置。
- 获取天然气管道基础设施市场的区域具体数据
天然气管道基础设施市场报告范围
| 报告属性 | 细节 |
|---|---|
| 2022 年市场规模 | 317.828 亿美元 |
| 2030 年的市场规模 | 407.035 亿美元 |
| 全球复合年增长率(2022 - 2030 年) | 3.1% |
| 史料 | 2020-2021 |
| 预测期 | 2022-2030 |
| 涵盖的领域 |
按操作
|
| 覆盖地区和国家 |
北美
|
| 市场领导者和主要公司简介 |
|
天然气管道基础设施市场参与者密度:了解其对业务动态的影响
天然气管道基础设施市场正在快速增长,这得益于终端用户需求的不断增长,而这些需求又源于消费者偏好的不断变化、技术进步以及对产品优势的认识不断提高等因素。随着需求的增加,企业正在扩大其产品范围,进行创新以满足消费者的需求,并利用新兴趋势,从而进一步推动市场增长。
市场参与者密度是指在特定市场或行业内运营的企业或公司的分布情况。它表明在给定市场空间中,相对于其规模或总市场价值,有多少竞争对手(市场参与者)存在。
在天然气管道基础设施市场运营的主要公司有:
- 安桥公司
- 金德摩根公司
- TC 能源公司
- 彭比纳管道公司
- 中国石油化工集团公司
- 管道基础设施有限公司
免责声明:上面列出的公司没有按照任何特定顺序排列。
- 了解天然气管道基础设施市场顶级关键参与者概况
天然气管道基础设施市场新闻及最新发展
通过收集主要和次要研究后的定性和定量数据来评估天然气管道基础设施市场,其中包括重要的公司出版物、协会数据和数据库。以下是天然气管道基础设施市场的发展和战略列表:
- 2023 年 2 月,Enagas SA 与 Reganosa 签署了一项协议,Enagas 向 Reganosa 支付了 5814 万美元,以采购 130 公里长的天然气管道网络。伊比利亚天然气市场的高效运行和供应安全取决于该网络。(来源:Enagas SA,新闻稿/公司网站/通讯)
- 2022 年 8 月,TC Energy Corp 与墨西哥国有电力公司 CFE 达成战略协议,旨在加快墨西哥中部和东南部天然气基础设施的开发。关于墨西哥中部的天然气管道资产,TC Energy 和 CFE 决定将 TC Energy 位于墨西哥的子公司 TGNH 和 CFE 承销的早期照付不议协议 (TSA) 合并为一份以美元计价的单一照付不议协议,有效期至 2055 年。与 CFE 合作计划的相关新基础设施项目也将受这份新的 TSA 管辖。(来源:TC Energy,新闻稿/公司网站/时事通讯)
天然气管道基础设施市场报告范围和交付成果
“天然气管道基础设施市场规模和预测(2020-2030 年)”报告对以下领域进行了详细的市场分析:
- 范围内所有主要细分市场的全球、区域和国家层面的市场规模和预测
- 市场动态,如驱动因素、限制因素和关键机遇
- 未来主要趋势
- 详细的PEST分析
- 全球和区域市场分析涵盖关键市场趋势、主要参与者、法规和最新市场发展
- 行业格局和竞争分析,涵盖市场集中度、热点图分析、知名参与者和最新发展
- 带有 SWOT 分析的详细公司简介

Nivedita 是一位经验丰富的研究专业人士,在市场研究和商业咨询领域拥有超过 9 年的经验。她目前担任 The Insight Partners 的 ICT 领域项目经理,在管理和执行跨技术领域的联合研究、定制研究、订阅研究和咨询研究方面拥有深厚的专业知识。
Nivedita 在提供数据驱动的分析和切实可行的洞察方面拥有丰富的经验,并已成为多个关键项目的关键贡献者。她的工作涉及端到端的项目执行——从理解客户目标、分析市场趋势到制定战略建议。她与领先的 ICT 公司广泛合作,帮助他们识别市场机遇并引领行业变革。
Nivedita 拥有德拉敦 IMS 的管理学 MBA 学位。在加入 The Insight Partners 之前,她在浦那的 MarketsandMarkets 和 Future Market Insights 积累了宝贵的经验,担任过各种研究职位,并在行业分析和客户互动方面奠定了坚实的基础。
- 历史分析(2 年)、基准年、预测(7 年)及复合年增长率
- PEST和SWOT分析
- 市场规模、价值/数量 - 全球、区域、国家
- 行业和竞争格局
- Excel 数据集
客户评价
Insight Partners 的 SCADA 系统市场报告内容全面,对当前趋势和未来预测提供了宝贵的见解。该团队始终高度专业、响应迅速且乐于助人。我们非常满意,强烈推荐他们的服务。
兰·凯德姆 伙伴, Reali Technologies LTD我请求一份关于特定软件市场的报告,团队在几天内就完成了。报告信息非常相关,而且呈现得非常出色。之后,我请求对报告进行一些修改和补充。团队再次迅速响应,不到一周我就收到了最终报告。
让-埃尔韦·詹恩 主席, 未来分析公司我们与 Insight Partners 合作进行了一项重要的市场研究和预测。他们清晰地洞察了机遇和风险,帮助我们制定了计划。他们的研究简单易用,数据可靠,帮助我们做出了明智而自信的决策。我们强烈推荐他们。
皮尤什·纳格帕尔 高级副总裁, 远光全球Insight Partners 凭借其深厚的行业专业知识,提供了富有洞察力、结构合理的市场研究。他们的团队始终专业且响应迅速。用户友好的网站让访问行业报告变得顺畅无阻。我们强烈推荐他们可靠、高质量的研究服务。
安达幸彦 首席执行官, 深蓝有限责任公司这是我第一次从The Insight Partners购买市场报告。起初我有些犹豫,但访问了他们的网站后,我更放心地冒险购买市场报告。我对报告的质量和客户服务非常满意。我对最初的报告有一些疑问和意见,但在与他们的分析师通过电子邮件沟通了几次后,我相信这份报告可以作为我们战略规划流程的参考。非常感谢您抽出宝贵的时间,让这次体验如此愉快。我一定会向其他人推荐你们的服务,当我们需要更多市场数据时,你们将是我的首选。
约翰·铃木 总裁兼首席执行官、董事会董事, BK科技感谢您在处理我关于尼日利亚传染病体外诊断市场信息请求的过程中所展现的支持和专业精神。感谢您的耐心、指导,以及您愿意提供的折扣,最终促成了这笔交易。我期待未来与 Insight Partners 继续合作,这一切都要归功于您与我初次接触后留下的良好印象。
奇吉奥克博士 ONYIA 董事总经理, PineCrest 医疗保健有限公司购买理由
- 明智的决策
- 了解市场动态
- 竞争分析
- 客户洞察
- 市场预测
- 风险规避
- 战略规划
- 投资论证
- 识别新兴市场
- 优化营销策略
- 提升运营效率
- 顺应监管趋势


 获取免费样品 - 天然气管道基础设施市场