
Marktübersicht für Gaspipeline-Infrastruktur, Wachstum, Trends, Analyse, Forschungsbericht (2022–2030)
Marktgröße und Prognose für Gaspipeline-Infrastruktur (2020–2030), Bericht über globale und regionale Anteile, Trends und Wachstumschancenanalyse: Nach Betrieb (Übertragung und Verteilung), Ausrüstung (Pipeline, Kompressorstation, Messanlagen und andere) und Anwendung (Onshore und Offshore) und Geografie
- Status : Veröffentlicht
- Berichtscode : TIPRE00029705
- Kategorie : Energie und Leistung
- Anzahl der Seiten : 177
- Verfügbare Berichtsformate :


- Datum der letzten Aktualisierung : July 25, 2024

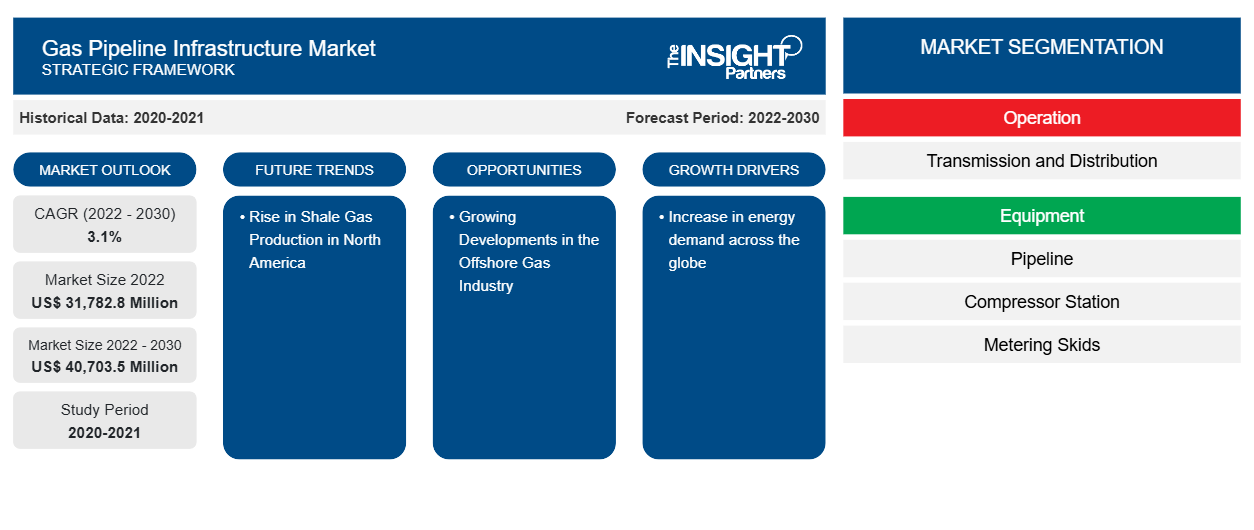
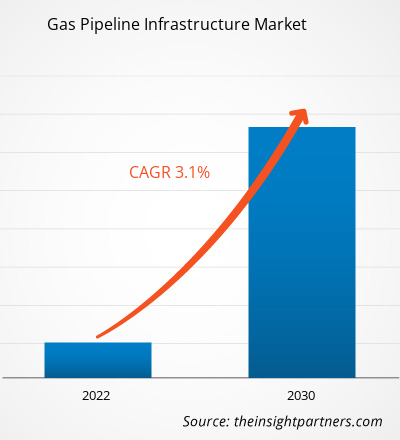
Das Marktvolumen für Gaspipeline-Infrastruktur soll von 31.782,8 Millionen US-Dollar im Jahr 2022 auf 40.703,5 Millionen US-Dollar im Jahr 2030 anwachsen. Für den Markt wird für den Zeitraum 2022–2030 eine durchschnittliche jährliche Wachstumsrate (CAGR) von 3,1 % erwartet.
Marktanalyse für Gaspipeline-Infrastruktur
Der Erdgasmarkt ist hochdynamisch und erfordert Liquidität, Flexibilität und Transparenz, um effektiv zu funktionieren. Daher sind mehrere Bezugsquellen, mehrere Nutzer und eine umfassende Infrastruktur für Übertragung und Verteilung erforderlich. Der Erdgasmarkt ist in den USA, Europa und im asiatisch-pazifischen Raum stark entwickelt, was mit der steigenden Nachfrage nach Gas in Zukunft das Wachstum der Gaspipeline-Infrastruktur vorantreiben dürfte.
Marktübersicht für Gaspipeline-Infrastruktur
Das Ökosystem der Gaspipeline-Infrastruktur umfasst die Produktionsphase, in der Erdgas aus unterirdischen Lagerstätten gefördert wird. Explorations- und Produktionsunternehmen nutzen Bohrtechnologien, um Roherdgas zu fördern. Nach der Förderung wird das Gas normalerweise verarbeitet, um Verunreinigungen zu entfernen, und dann für den Transport komprimiert. In der Produktionsphase müssen geologische Faktoren, Fördertechnologien und Umweltverträglichkeitsprüfungen berücksichtigt werden. Die wichtigsten Akteure bei der Erdgasförderung sind Royal Dutch Shell, ExxonMobil Corporation, Gazprom, ConocoPhillips und TotalEnergie. Zu den wichtigsten Akteuren im Gaspipeline-Übertragungsnetz zählen unter anderem Kinder Morgan Inc., Enbridge Inc., TC Energy Corporation, Pembina Pipeline Corporation und Texas Gas Transmission LLC.
Passen Sie diesen Bericht Ihren Anforderungen an
Sie erhalten kostenlose Anpassungen an jedem Bericht, einschließlich Teilen dieses Berichts oder einer Analyse auf Länderebene, eines Excel-Datenpakets sowie tolle Angebote und Rabatte für Start-ups und Universitäten.
Markt für Gaspipeline-Infrastruktur: Strategische Einblicke
-
Holen Sie sich die wichtigsten Markttrends aus diesem Bericht.Dieses KOSTENLOSE Beispiel umfasst eine Datenanalyse von Markttrends bis hin zu Schätzungen und Prognosen.
Treiber und Chancen auf dem Gaspipeline-Infrastrukturmarkt
Der weltweite Anstieg des Energiebedarfs dürfte der Haupttreiber für den Markt für Gaspipeline-Infrastruktur sein
Die steigende Bevölkerung und die zunehmende Urbanisierung sind einige Faktoren, die den Energieverbrauch weltweit ankurbeln. Erdgas hat das Potenzial, bei der Stromerzeugung eingesetzt zu werden, was die Nachfrage steigert. Aufgrund der zunehmenden Energieunsicherheiten in Europa aufgrund des Russland-Ukraine-Krieges fördern die Regierungen mehrerer Länder außerdem die Nutzung von Erdgas. Somit treibt der Anstieg des Energiebedarfs das Wachstum des Marktes für Gaspipeline-Infrastrukturen an.
Anstieg der Schiefergasproduktion in Nordamerika
Nordamerika hat sich seine Position als einer der führenden Schiefergasproduzenten weltweit gesichert. Kanada ist der fünftgrößte Produzent und viertgrößte Exporteur von Erdgas weltweit. Zu den wichtigsten kanadischen Schiefergasvorkommen zählen das Horn River Basin und die Montney Shales im Nordosten von British Columbia, das Utica Shale in Quebec, die Colorado Group in Alberta und Saskatchewan sowie das Horton Bluff Shale in New Brunswick und Nova Scotia. Energieunsicherheiten aufgrund geopolitischer Unruhen kurbeln die Schiefergasproduktion in Nordamerika an, was in den kommenden Jahren wahrscheinlich große Chancen für das Wachstum des Gaspipeline-Infrastrukturmarktes schaffen wird.
Segmentierungsanalyse des Marktberichts zur Gaspipeline-Infrastruktur
Wichtige Segmente, die zur Ableitung der Marktanalyse für Gaspipeline-Infrastruktur beigetragen haben, sind Betrieb, Ausrüstung und Anwendung.
- Basierend auf dem Betrieb wurde der Markt für Gaspipeline - Infrastruktur in Übertragung und Verteilung unterteilt. Das Verteilungssegment hatte im Jahr 2022 einen größeren Marktanteil.
- In Bezug auf die Ausrüstung wurde der Markt in Pipelines, Kompressorstationen, Messanlagen und andere segmentiert. Das Pipeline-Segment dominierte den Markt im Jahr 2022.
- In Bezug auf die Anwendung wurde der Markt in Onshore und Offshore segmentiert. Das Onshore-Segment dominierte den Markt im Jahr 2022.
Marktanteilsanalyse für Gaspipeline-Infrastruktur nach geografischer Lage
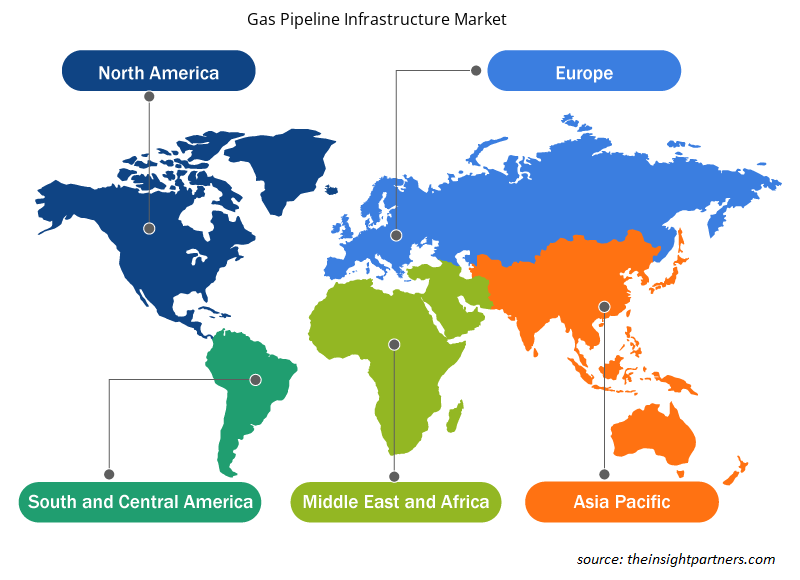
Der geografische Umfang des Berichts zum Markt für Gaspipeline-Infrastruktur ist hauptsächlich in fünf Regionen unterteilt: Nordamerika, Europa, Asien-Pazifik, Naher Osten und Afrika sowie Südamerika.
Nordamerika ist einer der führenden Gasexporteure. Der steigende Energiebedarf und die zunehmende Nutzung von Erdgas kurbeln die Marktentwicklung der Gaspipeline-Infrastruktur in Nordamerika an. Im Jahr 2022 wiesen die USA die höchste Erdgasproduktionskapazität auf, gefolgt von Kanada und Mexiko. Ixachi, Coulomb Phase 2, Quesqui, Nejo (IEPC), Leo, May, Koban und Powerball sind einige der Erdgas produzierenden Felder in Nordamerika. Das Ixachi-Werk befindet sich in Veracruz, Mexiko, und produzierte im Jahr 2022 618,09 mmcfd (Millionen Kubikfuß pro Tag). Darüber hinaus wird erwartet, dass die wachsende Zahl staatlicher Initiativen und Finanzierungen für die Entwicklung der Gaspipeline-Infrastruktur den Markt für Gaspipeline-Infrastruktur im Prognosezeitraum ankurbeln wird.
Regionale Einblicke in den Markt für Gaspipeline-Infrastruktur
Die regionalen Trends und Faktoren, die den Markt für Gaspipeline-Infrastruktur im Prognosezeitraum beeinflussen, wurden von den Analysten von Insight Partners ausführlich erläutert. In diesem Abschnitt werden auch die Marktsegmente und die Geografie der Gaspipeline-Infrastruktur in Nordamerika, Europa, im asiatisch-pazifischen Raum, im Nahen Osten und Afrika sowie in Süd- und Mittelamerika erörtert.
- Erhalten Sie regionale Daten zum Gaspipeline-Infrastrukturmarkt
Umfang des Marktberichts zur Gaspipeline-Infrastruktur
| Berichtsattribut | Details |
|---|---|
| Marktgröße im Jahr 2022 | 31.782,8 Millionen US-Dollar |
| Marktgröße bis 2030 | 40.703,5 Millionen US-Dollar |
| Globale CAGR (2022 - 2030) | 3,1 % |
| Historische Daten | 2020-2021 |
| Prognosezeitraum | 2022–2030 |
| Abgedeckte Segmente |
Nach Vorgang
|
| Abgedeckte Regionen und Länder |
Nordamerika
|
| Marktführer und wichtige Unternehmensprofile |
|
Dichte der Akteure auf dem Markt für Gaspipeline-Infrastruktur: Auswirkungen auf die Geschäftsdynamik verstehen
Der Markt für Gaspipeline-Infrastruktur wächst rasant, angetrieben durch die steigende Endverbrauchernachfrage aufgrund von Faktoren wie sich entwickelnden Verbraucherpräferenzen, technologischen Fortschritten und einem größeren Bewusstsein für die Vorteile des Produkts. Mit steigender Nachfrage erweitern Unternehmen ihr Angebot, entwickeln Innovationen, um die Bedürfnisse der Verbraucher zu erfüllen, und nutzen neue Trends, was das Marktwachstum weiter ankurbelt.
Die Marktteilnehmerdichte bezieht sich auf die Verteilung der Firmen oder Unternehmen, die in einem bestimmten Markt oder einer bestimmten Branche tätig sind. Sie gibt an, wie viele Wettbewerber (Marktteilnehmer) in einem bestimmten Marktraum im Verhältnis zu seiner Größe oder seinem gesamten Marktwert präsent sind.
Die wichtigsten auf dem Markt für Gaspipeline-Infrastruktur tätigen Unternehmen sind:
- Enbridge Inc
- Kinder Morgan Inc
- TC Energie GmbH
- Pembina Pipeline Corporation
- Sinopec-Gruppe
- Pipeline Infrastructure Limited
Haftungsausschluss : Die oben aufgeführten Unternehmen sind nicht in einer bestimmten Reihenfolge aufgeführt.
- Überblick über die wichtigsten Akteure auf dem Markt für Gaspipeline-Infrastruktur
Neuigkeiten und aktuelle Entwicklungen zum Gaspipeline-Infrastrukturmarkt
Der Markt für Gaspipeline-Infrastruktur wird durch die Erfassung qualitativer und quantitativer Daten nach Primär- und Sekundärforschung bewertet, die wichtige Unternehmensveröffentlichungen, Verbandsdaten und Datenbanken umfasst. Im Folgenden finden Sie eine Liste der Entwicklungen auf dem Markt für Gaspipeline-Infrastrukturmärkte und -strategien:
- Im Februar 2023 unterzeichnete Enagas SA eine Vereinbarung mit Reganosa, in deren Rahmen Enagas 58,14 Millionen US-Dollar an Reganosa zahlte, um ein Netz von 130 km Erdgaspipelines zu erwerben. Der effiziente Betrieb und die Versorgungssicherheit des iberischen Gasmarktes sind von diesem Netz abhängig. (Quelle: Enagas SA, Pressemitteilung/Unternehmenswebsite/Newsletter)
- Im August 2022 wurde zwischen TC Energy Corp und CFE, dem staatlichen Elektrizitätsversorgungsunternehmen in Mexiko, eine strategische Vereinbarung getroffen, mit der die Entwicklung der Erdgasinfrastruktur im zentralen und südöstlichen Teil des Landes beschleunigt werden soll. Im Zusammenhang mit den Erdgaspipeline-Anlagen in Zentralmexiko haben TC Energy und CFE beschlossen, frühere Take-or-Pay-Vereinbarungen (TSAs), die von TC Energys in Mexiko ansässiger Tochtergesellschaft TGNH und CFE unterzeichnet wurden, zu einer einzigen Take-or-Pay-Vereinbarung in US-Dollar zusammenzufassen, die bis 2055 laufen soll. Damit verbundene neue Infrastrukturprojekte, die in Zusammenarbeit mit CFE geplant werden, unterliegen ebenfalls dieser neuen TSA. (Quelle: TC Energy, Pressemitteilung/Unternehmenswebsite/Newsletter)
Marktbericht zur Gaspipeline-Infrastruktur – Umfang und Ergebnisse
Der Bericht „Marktgröße und Prognose für Gaspipeline-Infrastruktur (2020–2030)“ bietet eine detaillierte Analyse des Marktes, die die folgenden Bereiche abdeckt:
- Marktgröße und Prognose auf globaler, regionaler und Länderebene für alle wichtigen Marktsegmente, die im Rahmen des Projekts abgedeckt sind
- Marktdynamik wie Treiber, Beschränkungen und wichtige Chancen
- Wichtige Zukunftstrends
- Detaillierte PEST-Analyse
- Globale und regionale Marktanalyse mit wichtigen Markttrends, wichtigen Akteuren, Vorschriften und aktuellen Marktentwicklungen
- Branchenlandschaft und Wettbewerbsanalyse, einschließlich Marktkonzentration, Heatmap-Analyse, prominenten Akteuren und aktuellen Entwicklungen
- Detaillierte Firmenprofile mit SWOT-Analyse

Nivedita ist eine versierte Forschungsexpertin mit über 9 Jahren Erfahrung in Marktforschung und Unternehmensberatung. Sie ist derzeit als Projektmanagerin im IKT-Bereich bei The Insight Partners tätig und verfügt über umfassende Fachkenntnisse in der Leitung und Durchführung von syndizierten, kundenspezifischen, abonnementbasierten und beratenden Forschungsaufträgen in unterschiedlichen Technologiesektoren.
Mit einer nachgewiesenen Erfolgsbilanz bei der Bereitstellung datengestützter Analysen und umsetzbarer Erkenntnisse war Nivedita maßgeblich an mehreren kritischen Projekten beteiligt. Ihre Arbeit umfasst die vollständige Projektabwicklung – vom Verständnis der Kundenziele über die Analyse von Markttrends bis hin zur Ableitung strategischer Empfehlungen. Sie hat umfassend mit führenden IKT-Unternehmen zusammengearbeitet und ihnen geholfen, Marktchancen zu erkennen und Branchenveränderungen zu meistern.
Nivedita hat einen MBA in Management vom IMS, Dehradun. Vor ihrem Eintritt bei The Insight Partners sammelte sie wertvolle Erfahrungen bei MarketsandMarkets und Future Market Insights in Pune, wo sie verschiedene Forschungspositionen innehatte und sich ein solides Fundament in Branchenanalyse und Kundenbindung erarbeitete.
- Umfassende Analyse der Marktgröße und Prognosen
- Detaillierte Segmentierungsanalyse
- Tiefgehende Bewertung der Marktdynamik
- Einblicke auf regionaler und nationaler Ebene
- Wettbewerbslandschaft und Unternehmens-Benchmarking
- Strategische Business Intelligence
Erfahrungsberichte
Der SCADA-Systemmarktbericht von Insight Partners ist umfassend und bietet wertvolle Einblicke in aktuelle Trends und Zukunftsprognosen. Das Team war durchweg hochprofessionell, reaktionsschnell und hilfsbereit. Wir sind sehr zufrieden und können die Dienstleistungen wärmstens empfehlen.
RAN KEDEM Partner, Reali Technologies LTDsIch habe einen Bericht über einen sehr spezifischen Softwaremarkt angefordert, und das Team hat ihn innerhalb weniger Tage erstellt. Die Informationen waren sehr relevant und gut präsentiert. Anschließend habe ich einige Änderungen und Ergänzungen zum Bericht angefordert. Das Team reagierte erneut sehr schnell, und ich erhielt den Abschlussbericht in weniger als einer Woche.
JEAN-HERVE JENN Vorsitzende, Future AnalyticaWir haben mit The Insight Partners für eine wichtige Marktstudie und Prognose zusammengearbeitet. Sie gaben uns klare Einblicke in Chancen und Risiken, die uns bei der Gestaltung unserer Pläne halfen. Ihre Recherchen waren benutzerfreundlich und basierten auf soliden Daten. Sie halfen uns, kluge und sichere Entscheidungen zu treffen. Wir können sie wärmstens empfehlen.
PIYUSH NAGPAL Sr. Vizepräsident, Fernlicht GlobalDie Insight Partners lieferten aufschlussreiche, gut strukturierte Marktforschung mit fundierter Fachkompetenz. Ihr Team war durchweg professionell und reaktionsschnell. Die benutzerfreundliche Website ermöglichte den Zugriff auf Branchenberichte. Wir empfehlen sie wärmstens für zuverlässige und hochwertige Forschungsdienstleistungen.
YUKIHIKO ADACHI Geschäftsführer, Deep Blue, LLC.Dies ist das erste Mal, dass ich einen Marktbericht von The Insight Partners erworben habe. Obwohl ich zunächst unsicher war, besuchte ich die Website und fühlte mich dann sicherer, das Risiko einzugehen und einen Marktbericht zu kaufen. Ich bin mit der Qualität des Berichts und dem Kundenservice rundum zufrieden. Ich hatte einige Fragen und Anmerkungen zum ersten Bericht, aber nach einigen E-Mail-Gesprächen mit dem Analysten bin ich überzeugt, dass ich einen Bericht habe, den ich als Input für unseren strategischen Planungsprozess verwenden kann. Vielen Dank, dass Sie sich die Zeit genommen und dies zu einer positiven Erfahrung gemacht haben. Ich werde Ihren Service auf jeden Fall weiterempfehlen und Sie werden meine erste Anlaufstelle sein, wenn wir weitere Marktdaten benötigen.
JOHN SUZUKI Präsident und Chief Executive Officer, Vorstandsmitglied, BK TechnologiesIch möchte mich für Ihre Unterstützung und die Professionalität bedanken, die Sie bei der Bearbeitung meiner Informationsanfrage zum IVD-Markt für Infektionskrankheiten in Nigeria gezeigt haben. Ich schätze Ihre Geduld, Ihre Beratung und die Tatsache, dass Sie bereit waren, einen Rabatt anzubieten, der uns schließlich den Abschluss eines Geschäfts ermöglichte. Ich freue mich darauf, The Insight Partners in Zukunft wieder zu beauftragen, dank des Eindrucks, den Sie bei dieser ersten Begegnung bei mir hinterlassen haben.
DR. CHIJIOKE ONYIA GESCHÄFTSFÜHRERIN, PineCrest Healthcare Ltd.Grund zum Kauf
- Fundierte Entscheidungsfindung
- Marktdynamik verstehen
- Wettbewerbsanalyse
- Kundeneinblicke
- Marktprognosen
- Risikominimierung
- Strategische Planung
- Investitionsbegründung
- Identifizierung neuer Märkte
- Verbesserung von Marketingstrategien
- Steigerung der Betriebseffizienz
- Anpassung an regulatorische Trends


