
图像分析软件市场份额、增长及需求预测(至2034年)
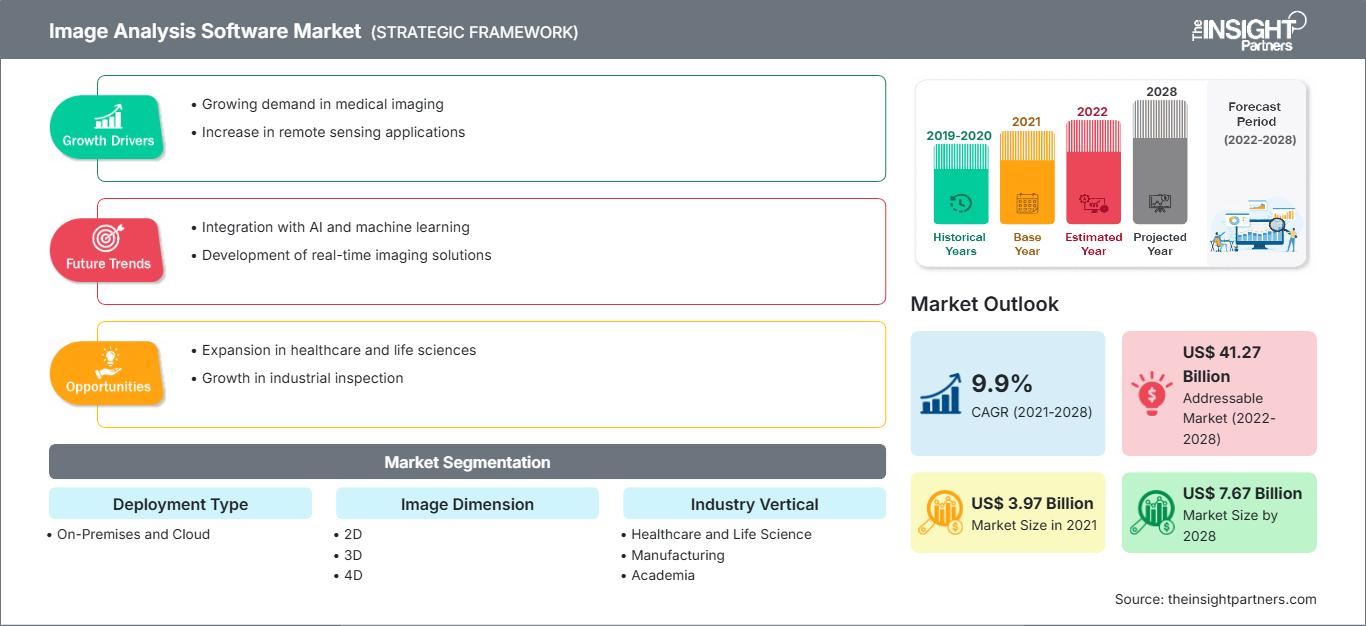
图像分析软件市场规模及预测(2021-2034 年)、全球及区域份额、趋势及增长机会分析报告涵盖范围:按部署类型(本地部署和云部署)、图像维度(2D、3D 和 4D)以及行业垂直领域(医疗保健和生命科学、制造业、学术界、矿产、金属和石油以及其他)划分
- 状态 : 数据发布
- 报告代码 : TIPRE00003045
- 类别 : 科技、媒体和电信
- 页数 : 150
- 可用报告格式 :


- 最后更新日期 : March 17, 2026

全球图像分析软件市场规模预计将从2025年的88亿美元增长至2034年的210.6亿美元。预计在2026年至2034年的预测期内,该市场将以10.91%的复合年增长率增长。
关键市场动态包括人工智能 (AI) 和机器学习 (ML) 在自动特征提取方面的快速融合、医疗保健领域对高精度诊断工具日益增长的需求,以及制造业对工业 4.0 实践的日益普及。此外,卫星成像在环境监测领域的应用扩展、高分辨率摄像头在消费电子产品中的广泛应用,以及智慧城市计划中对复杂安防监控系统日益增长的需求,预计也将推动市场发展。
图像分析软件市场分析
图像分析软件市场分析表明,随着各机构寻求消除人为错误并提高数据吞吐量,市场正朝着自主的、人工智能驱动的处理方式发生显著转变。低代码或无代码平台的开发正在涌现出战略机遇,这些平台使生命科学和矿物学领域的非技术专业人员能够进行复杂的定量分析。竞争差异化日益集中于处理多维数据(3D 和 4D)的能力以及与现有硬件(例如显微镜和工业传感器)的无缝集成。该分析还指出,市场领导者必须优先考虑网络安全和数据隐私,尤其是在临床和国防行业,才能在监管日益严格的数字化环境中保持竞争优势。
图像分析软件市场概览
图像分析软件市场正从专业研究工具向企业级解决方案转型。这些软件平台过去主要应用于学术实验室和高端医学影像领域,如今已成为生产线质量控制自动化和资源勘探地质模式识别的关键工具。市场格局既有成熟的科技巨头,也有专注于面部识别和数字病理学等细分应用的敏捷软件初创公司。随着数字化转型的加速,向云部署的转变正在推动实时协作和海量数据集的处理。全球自动化浪潮进一步推动了市场的演进,图像分析在其中扮演着智能系统“眼睛”的角色。例如,美国市场的特点是技术创新者高度集中,且拥有完善的医疗保健基础设施。该地区是研发的主要中心,这主要得益于生物技术和航空航天领域的巨额投资。美国企业正越来越多地采用先进的成像解决方案,以保持全球竞争力并提高运营效率。
根据您的需求定制此报告
获取免费定制服务图像分析软件市场:战略洞察
-
获取本报告的主要市场趋势。这份免费样品将包含数据分析,内容涵盖市场趋势、估算和预测等。
图像分析软件市场驱动因素和机遇
市场驱动因素:
- 人工智能与深度学习的融合:将神经网络融入图像分析,能够检测到人眼无法识别的模式。这显著缩短了处理时间,并提高了肿瘤学和自动驾驶等领域的准确性。
- 制造业对质量自动化的需求日益增长:随着各行业向零缺陷制造迈进,图像分析软件正被部署用于实时表面检测和尺寸测量,从而减少浪费和运营成本。
- 数字内容量激增:来自社交媒体、医疗档案和卫星信号的图像数据呈爆炸式增长,对自动标记、排序和分析工具产生了巨大的需求,以便从中获得可操作的见解。
市场机遇:
- 拓展至 4D 成像和延时分析:开发能够分析物体随时间变化的软件具有重要意义,这对于监测药物研究中的活细胞动态和土木工程中的结构完整性至关重要。
- 遥感和精准农业的发展:开发用于无人机和卫星图像的专用图像分析工具可以帮助预测作物产量和进行灾害管理,从而开拓蓬勃发展的农业科技产业。
- 为中小企业 (SME) 提供定制化服务:创建可扩展、经济高效的订阅模式 (SaaS) 使小型企业能够获得高端分析能力,从而在全球范围内开辟一个巨大的未开发市场。
图像分析软件市场报告细分分析
图像分析软件市场份额按多个细分市场进行分析,以便更清晰地了解其结构、增长潜力和新兴趋势。以下是大多数行业报告中使用的标准细分方法:
按部署类型:
- 本地部署:对于数据安全要求严格以及需要高速本地处理能力来处理海量文件的组织而言,本地部署是首选方案,例如医疗中心和国防机构。
- 云计算:增长最快的领域,提供可扩展性、远程访问和较低的前期成本,使其成为协作研究和跨国制造运营的理想选择。
按图像尺寸:
- 2D:传统且应用最广泛的格式,是标准文档处理、基本临床成像和常规工业检测所必需的格式。
- 3D:在牙科成像、3D 打印和复杂工程领域迅速发展,提供高精度任务所需的深度和空间感知能力。
- 4D:一个专注于时间分辨 3D 成像的专业领域,主要用于高级心脏成像和生物学研究,以观察运动结构。
按行业垂直领域划分:
- 医疗保健和生命科学:利用软件进行诊断辅助、药物发现和数字病理学的主要领域。
- 制造:采用软件进行自动化光学检测 (AOI) 和工厂车间的机器人引导。
- 学术界:专注于物理学、生物学和材料科学等领域的基础研究。
- 矿物、金属和石油:用于岩相学研究、矿物鉴定和地震数据解释的分析。
- 其他应用领域:包括农业、法医学、媒体和娱乐等领域。
按地理位置:
- 北美
- 欧洲
- 亚太地区
- 南美洲和中美洲
- 中东和非洲
图像分析软件市场报告范围
| 报告属性 | 细节 |
|---|---|
| 2025年市场规模 | 88亿美元 |
| 到2034年市场规模 | 210.6亿美元 |
| 全球复合年增长率(2026-2034 年) | 10.91% |
| 史料 | 2021-2024 |
| 预测期 | 2026-2034 |
| 涵盖部分 |
按部署类型
|
| 覆盖地区和国家 |
北美
|
| 市场领导者和主要公司简介 |
|
图像分析软件市场参与者密度:了解其对业务动态的影响
图像分析软件市场正快速增长,这主要得益于终端用户需求的不断增长,而终端用户需求的增长又源于消费者偏好的转变、技术的进步以及消费者对产品优势认知的提高。随着需求的增长,企业不断拓展产品和服务,持续创新以满足消费者需求,并把握新兴趋势,这些都进一步推动了市场增长。
图像分析软件市场份额按地域划分
由于快速的工业化和医疗保健现代化,亚太地区预计将在未来几年实现最快增长。南美和中美洲、中东和非洲等新兴市场也为数字基础设施提供商和软件开发商提供了许多尚未开发的扩张机会。
图像分析软件市场正经历着一场重大变革,从小众科学工具转型为全球高价值企业解决方案。自动化程度的不断提高、高分辨率数据需求的激增以及人工智能集成诊断市场的扩张是推动市场增长的主要因素。以下是按地区划分的市场份额和趋势概述:
北美
- 市场份额:在全球拥有最大的收入份额,这得益于成熟的技术生态系统和高额的医疗保健支出。
-
关键驱动因素:
- 人工智能诊断工具在临床环境中的广泛应用。
- 对航空航天和国防成像领域进行了大量投资。
- 主要市场参与者和软件创新者的强大影响力。
- 趋势:向云原生成像平台发展,并将分析软件与电子健康记录 (EHR) 集成。
欧洲
- 市场份额:凭借强大的制造基础和严格的质量法规,拥有显著的市场地位。
-
关键驱动因素:
- 重点发展工业4.0和汽车自动化。
- 严格的环境监测和卫星成像计划。
- 德国和英国的制药研发领域正在扩张。
- 趋势:软件开发中越来越注重符合伦理的人工智能和数据主权,以遵守区域隐私法。
亚太
- 市场份额:增长最快的地区,这得益于庞大的制造业中心和不断壮大的中产阶级。
-
关键驱动因素:
- 中国大陆和台湾电子制造业快速发展。
- 政府推进智慧城市发展和监控的举措。
- 印度和东南亚医疗基础设施投资不断增长。
- 趋势:移动图像分析技术的普及以及提供经济高效的软件替代方案的区域性创业公司的崛起。
南美洲和中美洲
- 市场份额:新兴市场,越来越关注农业和采矿技术。
-
关键驱动因素:
- 利用无人机图像分析实现农业现代化。
- 采矿作业的扩张需要地质成像技术。
- 城市医疗中心数字化转型正在加速推进。
- 趋势:本地化软件服务的增长以及与国际供应商合作进行资源探索。
中东和非洲
- 市场份额:通过在能源和安全领域的战略投资来发展市场。
-
关键驱动因素:
- 对地震成像和油藏分析的需求很高。
- 投资于基础设施的先进安全和人脸识别技术。
- 向智慧农业进行战略转型,以提高粮食安全。
- 趋势:高端监控软件的实施和遥感技术在荒漠化监测中的应用日益广泛。
市场密度高,竞争激烈
由于通用电气公司、奥林巴斯公司、珀金埃尔默公司和赛默飞世尔科技公司等老牌领导者的存在,竞争日益激烈。区域专家和利基企业,如 ADCIS(法国)和 Media Cybernetics 公司(美国),以及 MIPAR Software 和 Aivia(徕卡显微系统)等创新者,共同造就了多元化且快速扩张的市场格局。
这种竞争环境促使供应商通过以下方式实现差异化:
- AI原生架构:通过强调深度学习能力,将软件定位为智能软件,从而自动执行劳动密集型的标注和分割任务。
- 跨平台互操作性:确保软件能够处理来自各种来源的数据,包括共聚焦显微镜、X射线和热像仪。
- 端到端解决方案:管理从数据采集和处理到云存储和自动报告的整个数据生命周期。
- 可扩展许可:利用 SaaS 和订阅模式降低小型实验室和工业设施的准入门槛。
机遇与战略举措
- 与硬件制造商(相机和显微镜 OEM)合作,提供软硬件捆绑解决方案,确保优化性能并迅速占领市场。
- 整合边缘计算能力,实现本地设备上的实时图像分析,降低工业和监控应用的延迟和带宽成本。
图像分析软件市场的主要公司包括:
- ADCIS SA
- Bio-Rad Laboratories, Inc.
- 牛津仪器
- Clemex Technologies, Inc.
- 媒体控制论公司
- MIPAR 软件有限责任公司
- 奥林巴斯公司
- 帕克斯
- 珀金埃尔默公司
- 组织诊断有限公司
- 徕卡显微系统有限公司
- MVTec 软件有限公司
- 卡尔蔡司股份公司
- Scale AI 公司
免责声明:以上列出的公司不分先后顺序。
图像分析软件市场新闻及最新发展
- 2026年1月,全球科学服务领域的领导者赛默飞世尔科技公司宣布与英伟达达成战略合作,旨在大规模赋能基于人工智能的解决方案和实验室自动化。此次合作充分利用英伟达人工智能(AI)平台和赛默飞世尔科技的解决方案,逐步提升实验室的自动化程度、准确性和速度。双方携手合作,共同构建驱动科学仪器和数据的数字化基础架构,并将其与强大的图像分析软件和人工智能解决方案相连接,从而帮助科学家减少人工操作步骤,加速科学进步。
- 2025年5月,领先的显微镜和科学仪器供应商徕卡显微系统公司发布了其人工智能图像分析软件的最新版本——Aivia 15。Aivia 15的发布使科学家能够快速设置工作流程,并部署直观的人工智能分析功能以实现精准检测,同时还支持轻松批量处理分析数据。
图像分析软件市场报告涵盖范围及成果
《图像分析软件市场规模及预测(2021-2034)》报告对以下领域进行了详细的市场分析:
- 图像分析软件市场规模及预测,涵盖全球、区域和国家层面的所有关键细分市场。
- 图像分析软件市场趋势,以及市场动态,例如驱动因素、制约因素和关键机遇。
- 详细的PEST和SWOT分析
- 图像分析软件市场分析,涵盖关键市场趋势、全球和区域框架、主要参与者、法规以及近期市场发展动态。
- 图像分析软件市场的行业格局和竞争分析,包括市场集中度、热力图分析、主要参与者和最新发展。
- 公司详细概况

Ankita 是一位充满活力的市场研究和咨询专家,在科技、媒体、信息通信技术 (ICT) 以及电子和半导体领域拥有超过 8 年的经验。她成功领导并完成了 100 多项咨询和研究项目,服务对象包括微软、甲骨文、NEC Corporation、SAP、毕马威和 Expeditors International 等全球客户。她的核心能力包括市场评估、数据分析、预测、战略制定、竞争情报和报告撰写。
Ankita 擅长处理完整的项目周期——从售前的方案设计和客户洽谈,到售后提供切实可行的洞察。她擅长管理跨职能团队、构建复杂的研究模块,并根据客户特定的业务目标调整解决方案。她卓越的沟通能力、领导能力和演讲能力使她能够在快速变化的市场环境中持续提供价值驱动的成果。
- 全面的市场规模与预测分析
- 详细的细分市场分析
- 深入的市场动态评估
- 区域及国家级洞察
- 竞争格局与企业对标分析
- 战略性商业情报
客户评价
Insight Partners 的 SCADA 系统市场报告内容全面,对当前趋势和未来预测提供了宝贵的见解。该团队始终高度专业、响应迅速且乐于助人。我们非常满意,强烈推荐他们的服务。
兰·凯德姆 伙伴, Reali Technologies LTD我请求一份关于特定软件市场的报告,团队在几天内就完成了。报告信息非常相关,而且呈现得非常出色。之后,我请求对报告进行一些修改和补充。团队再次迅速响应,不到一周我就收到了最终报告。
让-埃尔韦·詹恩 主席, 未来分析公司我们与 Insight Partners 合作进行了一项重要的市场研究和预测。他们清晰地洞察了机遇和风险,帮助我们制定了计划。他们的研究简单易用,数据可靠,帮助我们做出了明智而自信的决策。我们强烈推荐他们。
皮尤什·纳格帕尔 高级副总裁, 远光全球Insight Partners 凭借其深厚的行业专业知识,提供了富有洞察力、结构合理的市场研究。他们的团队始终专业且响应迅速。用户友好的网站让访问行业报告变得顺畅无阻。我们强烈推荐他们可靠、高质量的研究服务。
安达幸彦 首席执行官, 深蓝有限责任公司这是我第一次从The Insight Partners购买市场报告。起初我有些犹豫,但访问了他们的网站后,我更放心地冒险购买市场报告。我对报告的质量和客户服务非常满意。我对最初的报告有一些疑问和意见,但在与他们的分析师通过电子邮件沟通了几次后,我相信这份报告可以作为我们战略规划流程的参考。非常感谢您抽出宝贵的时间,让这次体验如此愉快。我一定会向其他人推荐你们的服务,当我们需要更多市场数据时,你们将是我的首选。
约翰·铃木 总裁兼首席执行官、董事会董事, BK科技感谢您在处理我关于尼日利亚传染病体外诊断市场信息请求的过程中所展现的支持和专业精神。感谢您的耐心、指导,以及您愿意提供的折扣,最终促成了这笔交易。我期待未来与 Insight Partners 继续合作,这一切都要归功于您与我初次接触后留下的良好印象。
奇吉奥克博士 ONYIA 董事总经理, PineCrest 医疗保健有限公司购买理由
- 明智的决策
- 了解市场动态
- 竞争分析
- 客户洞察
- 市场预测
- 风险规避
- 战略规划
- 投资论证
- 识别新兴市场
- 优化营销策略
- 提升运营效率
- 顺应监管趋势


