


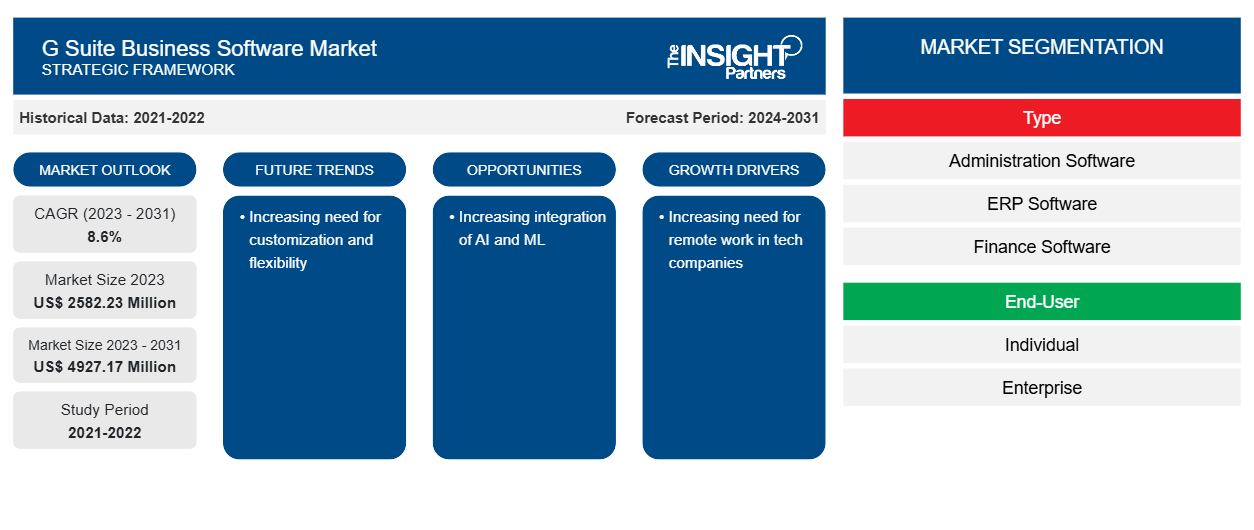
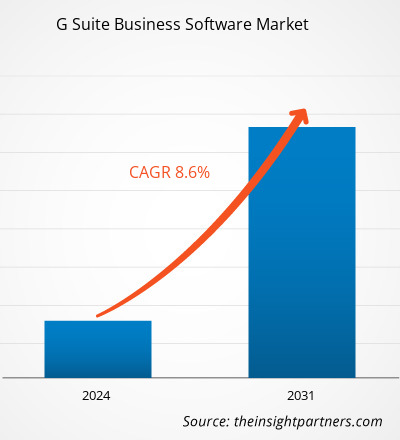
G Suite 商业软件市场规模预计将从 2023 年的 25.8223 亿美元增至 2031 年的 49.2717 亿美元。预计 2023-2031 年期间市场复合年增长率将达到 8.6%。对定制化和灵活性的需求日益增长可能仍是市场的主要趋势。
G Suite 商业软件市场分析
G Suite 允许企业和组织在其业务流程结束时使用 Google 的基于云的生产力和协作工具套件。各种第三方开发商和解决方案提供商根据企业的需求提供卓越的 G Suite 解决方案治理和管理。Calendly 为 G Suite 提供解决方案,可与 Google 日历无缝协作,以管理所有预订和与日程安排相关的活动。Mixmax 为销售、客户成功、招聘、销售运营、领导力和企业家提供日历解决方案和电子邮件生产力平台。第三方公司为 G Suite 提供额外的工具,以提高企业的生产力和可管理性,并为客户提供定制需求。
G Suite 商业软件市场概览
G Suite 是一套由 Google 设计和支持的软件即服务 (SaaS) 应用套件。这些基于云的应用专注于不同的领域,例如商业、协作、生产力和教育。Gmail、文档、表格、云端硬盘、日历、Google+、幻灯片、表单、网站、环聊和 Keep 是 Google 提供的主要 G-Suite 工具。G Suite 是全球企业和个人的宝贵资源。
定制此报告以满足您的需求
您可以免费定制任何报告,包括本报告的部分内容、国家级分析、Excel 数据包,以及为初创企业和大学提供优惠和折扣
G Suite 商业软件市场:战略洞察
-
获取此报告的关键市场趋势。这个免费样品将包括数据分析,从市场趋势到估计和预测。
G Suite 商业软件市场驱动因素和机遇
科技公司对远程工作的需求日益增加
雇主对提供远程或混合工作模式的公司职位越来越感兴趣,越来越多的雇主意识到了这一趋势。2021年至2022年,招聘网站FlexJobs.com的一份报告显示,远程职位的招聘信息从上一年的12%上升到12%。远程工作的普及已成为一个主要因素,随着雇主完善在家工作的就业政策,这一比例可能会上升。因此,科技公司对远程工作的日益增长的需求正在推动G套件商业软件市场的发展。
人工智能的融合度不断提高
借助 AI 和 ML,G Suite 增加了安全工具。许多公司都在部署具有 AI 和 ML 技术的 G Suite 业务软件。例如,在 2020 年,这家搜索巨头宣布使用 AI 对 G Suite 进行几项更新,AI 是其一组类似于 Google Docs 和 Sheets 的应用程序,但专为办公室量身定制。该公司在旧金山举行的年度 Google Cloud Next 会议上宣布了这一消息。因此,AI 与 G Suite 业务软件的日益融合为市场创造了更多机会。
G Suite 商业软件市场报告细分分析
有助于得出 G Suite 商业软件市场分析的关键部分是类型和最终用户。
- 根据类型,G Suite 商业软件市场分为管理软件、ERP 软件、财务软件、HR 软件等。定制部分在 2023 年占据了更大的市场份额。
- 根据最终用户,市场分为个人、企业和其他。
G Suite 商业软件市场份额(按地区)分析
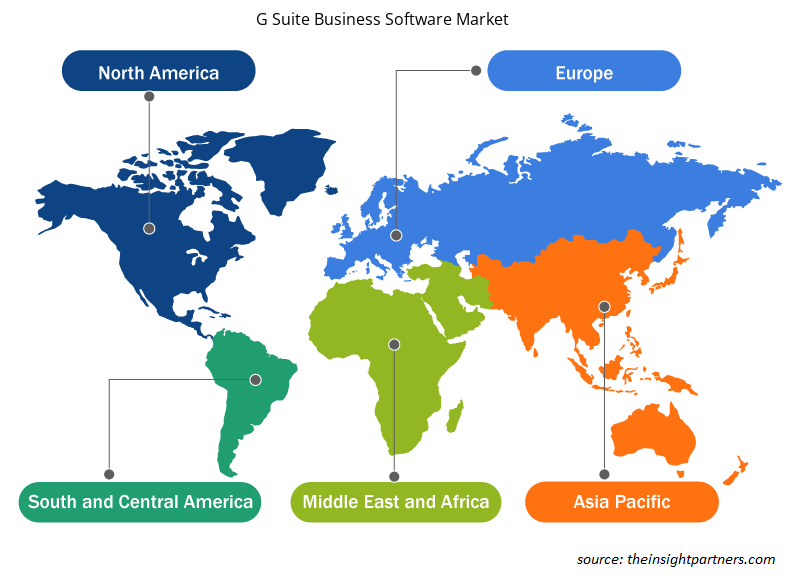
G suite商业软件市场报告的地理范围主要分为北美、亚太、欧洲、中东和非洲、南美和中美五个区域。
亚太地区在 G Suite 商业软件市场中占据主导地位。该地区的 G Suite 商业软件市场正在增长,原因多种多样,例如组织提高安全性的举措日益增多,以及知名 G Suite 商业软件提供商的存在。
G Suite 商业软件市场区域洞察
Insight Partners 的分析师已详细解释了预测期内影响 G Suite 商业软件市场的区域趋势和因素。本节还讨论了北美、欧洲、亚太地区、中东和非洲以及南美和中美洲的 G Suite 商业软件市场细分和地理位置。
- 获取 G Suite 商业软件市场的区域特定数据
G Suite 商业软件市场报告范围
| 报告属性 | 细节 |
|---|---|
| 2023 年的市场规模 | 25.8223亿美元 |
| 2031 年市场规模 | 49.2717亿美元 |
| 全球复合年增长率(2023 - 2031) | 8.6% |
| 史料 | 2021-2022 |
| 预测期 | 2024-2031 |
| 涵盖的领域 |
按类型
|
| 覆盖地区和国家 |
北美
|
| 市场领导者和主要公司简介 |
|
G Suite 商业软件市场参与者密度:了解其对业务动态的影响
G Suite 商业软件市场正在快速增长,这得益于最终用户需求的不断增长,而这些需求又源于消费者偏好的不断变化、技术进步以及对产品优势的认识不断提高等因素。随着需求的增加,企业正在扩大其产品范围,进行创新以满足消费者的需求,并利用新兴趋势,从而进一步推动市场增长。
市场参与者密度是指在特定市场或行业内运营的企业或公司的分布情况。它表明在给定市场空间中,相对于其规模或总市场价值,有多少竞争对手(市场参与者)存在。
在 G Suite 商业软件市场运营的主要公司有:
- 槽
- 邮件跟踪
- Calendly
- NetHunt 公司
- 麦克斯
- Salesforce.com 公司
免责声明:上面列出的公司没有按照任何特定顺序排列。
- 获取 G Suite 商业软件市场顶级关键参与者概览
G Suite 商业软件市场新闻和最新发展
G Suite 商业软件市场通过收集主要和次要研究后的定性和定量数据进行评估,其中包括重要的公司出版物、协会数据和数据库。下面列出了 G Suite 商业软件市场的一些发展情况:
- 谷歌重新命名了 G Suite,这是一套面向企业的在线生产力和协作工具,包括 Gmail、Drive、Docs 和 Meet 等。新名称是 Google Workspace,该公司在今年早些时候首次为该服务推出一套新的协作工具和 Google Meet 集成时就已经暗示了这个名字。(来源:谷歌,新闻稿,2020 年 10 月)
- 谷歌的 G Suite 增加了新的 AI 和安全工具。这家搜索巨头宣布对 G Suite 进行几项更新,G Suite 是一套类似于 Google Docs 和 Sheets 的应用程序,但专为办公而设计。(来源:Tungsram Group,新闻稿,2021 年 7 月)
G Suite 商业软件市场报告覆盖范围和交付成果
“G Suite 商业软件市场规模和预测(2021-2031 年)”报告对市场进行了详细分析,涵盖以下领域:
- G Suite 商业软件市场规模以及范围涵盖的所有关键细分市场的全球、区域和国家/地区预测
- G Suite 商业软件市场趋势以及市场动态,如驱动因素、限制因素和关键机遇
- 详细的 PEST/波特五力分析和 SWOT 分析
- G Suite 商业软件市场分析涵盖主要市场趋势、全球和区域框架、主要参与者、法规和最新市场发展
- 行业格局和竞争分析,涵盖市场集中度、热图分析、知名参与者以及 G Suite 商业软件市场的最新发展
- 详细的公司简介

Ankita 是一位充满活力的市场研究和咨询专家,在科技、媒体、信息通信技术 (ICT) 以及电子和半导体领域拥有超过 8 年的经验。她成功领导并完成了 100 多项咨询和研究项目,服务对象包括微软、甲骨文、NEC Corporation、SAP、毕马威和 Expeditors International 等全球客户。她的核心能力包括市场评估、数据分析、预测、战略制定、竞争情报和报告撰写。
Ankita 擅长处理完整的项目周期——从售前的方案设计和客户洽谈,到售后提供切实可行的洞察。她擅长管理跨职能团队、构建复杂的研究模块,并根据客户特定的业务目标调整解决方案。她卓越的沟通能力、领导能力和演讲能力使她能够在快速变化的市场环境中持续提供价值驱动的成果。
- 历史分析(2 年)、基准年、预测(7 年)及复合年增长率
- PEST和SWOT分析
- 市场规模、价值/数量 - 全球、区域、国家
- 行业和竞争格局
- Excel 数据集
客户评价
Insight Partners 的 SCADA 系统市场报告内容全面,对当前趋势和未来预测提供了宝贵的见解。该团队始终高度专业、响应迅速且乐于助人。我们非常满意,强烈推荐他们的服务。
兰·凯德姆 伙伴, Reali Technologies LTD我请求一份关于特定软件市场的报告,团队在几天内就完成了。报告信息非常相关,而且呈现得非常出色。之后,我请求对报告进行一些修改和补充。团队再次迅速响应,不到一周我就收到了最终报告。
让-埃尔韦·詹恩 主席, 未来分析公司我们与 Insight Partners 合作进行了一项重要的市场研究和预测。他们清晰地洞察了机遇和风险,帮助我们制定了计划。他们的研究简单易用,数据可靠,帮助我们做出了明智而自信的决策。我们强烈推荐他们。
皮尤什·纳格帕尔 高级副总裁, 远光全球Insight Partners 凭借其深厚的行业专业知识,提供了富有洞察力、结构合理的市场研究。他们的团队始终专业且响应迅速。用户友好的网站让访问行业报告变得顺畅无阻。我们强烈推荐他们可靠、高质量的研究服务。
安达幸彦 首席执行官, 深蓝有限责任公司这是我第一次从The Insight Partners购买市场报告。起初我有些犹豫,但访问了他们的网站后,我更放心地冒险购买市场报告。我对报告的质量和客户服务非常满意。我对最初的报告有一些疑问和意见,但在与他们的分析师通过电子邮件沟通了几次后,我相信这份报告可以作为我们战略规划流程的参考。非常感谢您抽出宝贵的时间,让这次体验如此愉快。我一定会向其他人推荐你们的服务,当我们需要更多市场数据时,你们将是我的首选。
约翰·铃木 总裁兼首席执行官、董事会董事, BK科技感谢您在处理我关于尼日利亚传染病体外诊断市场信息请求的过程中所展现的支持和专业精神。感谢您的耐心、指导,以及您愿意提供的折扣,最终促成了这笔交易。我期待未来与 Insight Partners 继续合作,这一切都要归功于您与我初次接触后留下的良好印象。
奇吉奥克博士 ONYIA 董事总经理, PineCrest 医疗保健有限公司购买理由
- 明智的决策
- 了解市场动态
- 竞争分析
- 客户洞察
- 市场预测
- 风险规避
- 战略规划
- 投资论证
- 识别新兴市场
- 优化营销策略
- 提升运营效率
- 顺应监管趋势


 获取免费样品 - Suite 商业软件市场