


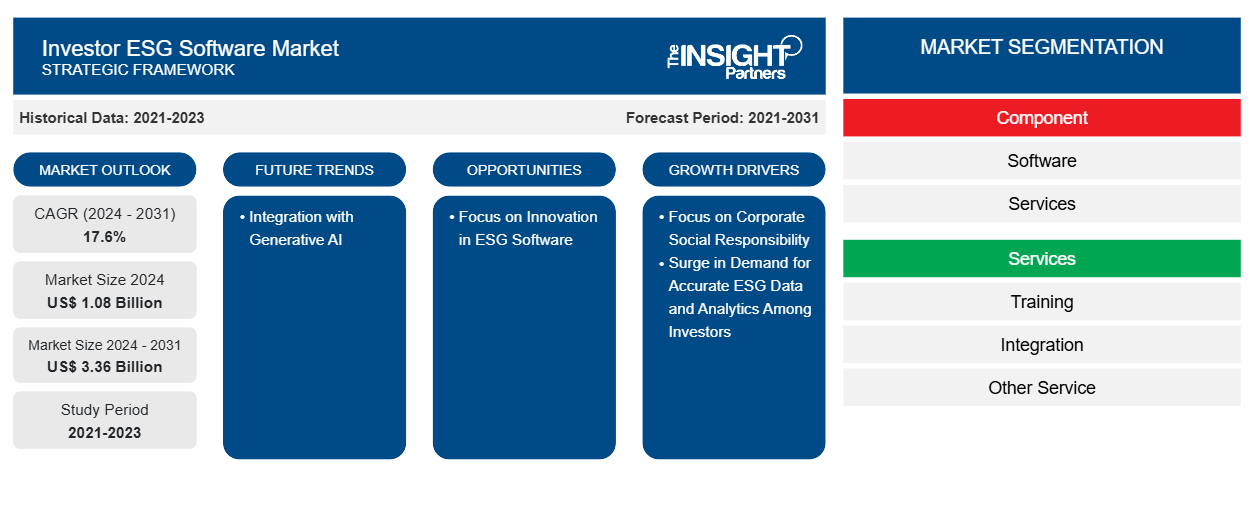
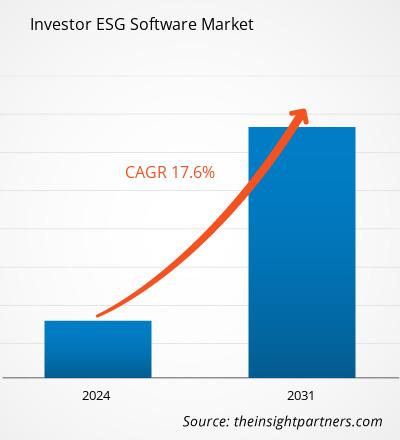
2024 年投资者 ESG 软件市场规模价值 10.8 亿美元,预计到 2031 年将达到 33.6 亿美元;预计 2024 年至 2031 年的复合年增长率为 17.6%。ESG 软件与生成式 AI 的结合可能会在未来几年为市场带来新的趋势。
投资者 ESG 软件市场分析
由于对负责任投资的需求不断增加、对气候变化、社会问题和治理实践的担忧日益增加,以及对透明度和遵守不断发展的全球 ESG 标准的需求,投资者ESG 软件市场经历了显着增长。投资者 ESG 软件的需求是由机构投资者、资产管理公司和金融机构推动的,他们希望将 ESG 因素纳入其决策过程。对企业社会责任的关注以及投资者对准确的 ESG 数据和分析的需求不断增长等因素也在推动投资者 ESG 软件市场的发展。此外,在预测期内,对 ESG 软件创新的关注和与生成式 AI 的集成为投资者 ESG 软件市场参与者的增长创造了丰厚的机会。
投资者 ESG 软件市场概览
组织利用投资者 ESG 软件来定制问卷并简化数据收集,从而能够汇总精确且可比较的 ESG 绩效指标。这个软件即服务平台增强了 ESG 计划,帮助企业实现价值最大化并评估投资。ESG 投资或可持续投资侧重于确定定义负责任、可持续或道德投资的因素。投资者和资本市场公司都使用 ESG 软件来评估企业行为,从而提供预测未来财务业绩的见解。许多公司实施这些软件解决方案来降低与其运营、业务关系、资产和投资相关的风险
ESG 平台支持投资分析,提供更明智和更具战略性的投资决策。投资者 ESG 软件经过定制,可帮助投资者评估、跟踪和管理其投资组合和投资决策的 ESG 绩效。这些平台提供数据驱动的洞察、分析和各种 ESG 指标报告,使投资者能够将其投资策略与可持续发展目标和监管要求保持一致。
定制此报告以满足您的需求
您可以免费定制任何报告,包括本报告的部分内容、国家级分析、Excel 数据包,以及为初创企业和大学提供优惠和折扣
投资者 ESG 软件市场:战略洞察
-
获取此报告的关键市场趋势。这个免费样品将包括数据分析,从市场趋势到估计和预测。
投资者 ESG 软件市场驱动因素和机遇
关注企业社会责任
《企业可持续发展报告指令》(CSRD)的颁布代表着一项重大的监管转变,极大地推动了投资者对 ESG 软件的需求。CSRD 于 2023 年 1 月取代了《非财务报告指令》(NFRD),大大扩大了欧盟内强制性 ESG 报告的范围。根据 NFRD,约有 11,000 家大公司必须披露 ESG 信息。然而,CSRD 将这一义务扩大到大约 50,000 家公司,占所有欧盟公司总营业额的约 75%。这包括大型公司以及上市的中小型企业 (SME),大大扩大了 ESG 披露和合规要求的范围。CSRD 要求公司必须披露详细的社会、环境和治理信息,涵盖人权、气候风险、生物多样性和供应链透明度等领域。这一全面的报告框架确保公司能够解决和减轻欧洲和其他地区对环境和人权的不利影响。通过执行这些新规则,中国证监会旨在提高ESG数据的一致性、可比性和可靠性,使其更加透明,更易于投资者、监管机构和公众获取。
专注于 ESG 软件创新
预计在预测期内,对 ESG 软件创新的关注将为投资者 ESG 软件市场增长创造大量机会。随着对透明、准确和可操作的 ESG 数据的需求不断增长,投资者越来越依赖先进的 ESG 软件解决方案来做出明智的投资决策。环境、社会和治理 (ESG) 因素的不断变化的格局要求投资者获得只有创新软件工具才能提供的全面、实时的见解。ESG 软件的创新涉及人工智能(AI) 等尖端技术的集成,这些技术正在重塑 ESG 数据的收集、处理和分析方式。例如,2024 年 4 月,ESG 数据解决方案提供商 ESGgo 宣布推出其一键式可持续发展报告,这是一种由人工智能驱动的工具,旨在帮助公司轻松生成符合监管框架和利益相关者期望的可持续发展报告。ESGgo 表示,这一新解决方案简化了组织的可持续发展报告流程,确保符合不断发展的标准。该平台的人工智能数据引擎可处理数字和文本信息、计算排放量并综合数据集以创建定制的可持续发展报告。这些进步使投资者能够更有效地监控公司的可持续发展绩效,并根据实时数据预测未来的 ESG 风险和机遇。能够处理通常来自不同来源的大量数据并将其综合成可操作的 ESG 指标,对于寻求透明度和可靠性的投资者来说是一项重大优势。
投资者 ESG 软件市场报告细分分析
有助于投资者 ESG 软件市场分析的关键部分是组件、服务和企业规模。
- 根据组成部分,投资者 ESG 软件市场分为软件和服务。软件部分在 2024 年占据市场主导地位。
- 在服务方面,投资者 ESG 软件市场细分为培训、集成和其他服务。其他服务部门在 2024 年占据了最大的市场份额。
- 根据企业规模,投资者 ESG 软件市场分为大型企业和中小型企业。大型企业在 2024 年占据市场主导地位。
投资者 ESG 软件市场份额(按地区)分析
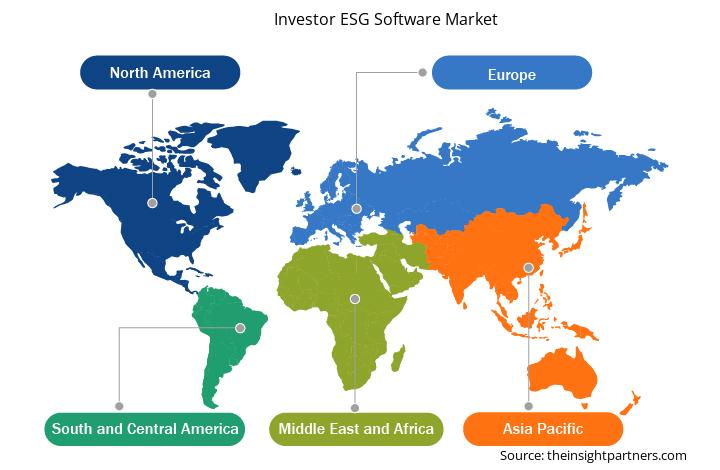
- 投资者 ESG 软件市场分为五大区域:北美、欧洲、亚太地区 (APAC)、中东和非洲 (MEA) 以及南美和中美。2024 年,北美占据市场主导地位,其次是欧洲和亚太地区。
- 由于法律要求的增加,例如美国证券交易委员会 (SEC) 提议的气候披露,北美投资者 ESG 软件市场预计在预测期内将增长。这些法律义务给资产管理者和机构投资者带来压力,要求他们在决策过程中解决 ESG 问题和规则。此外,对可持续性的日益重视和日益增长的气候变化问题促使投资者和利益相关者对 ESG 软件产生需求,以获得清晰、数据驱动的见解。这些见解有助于他们有效评估企业的 ESG 绩效。该软件通过允许实时 ESG 报告、合规性跟踪和风险评估,为公司提供了更大的责任感。
- 欧洲各国政府正在采取措施,例如《可持续金融披露条例》(SFDR)和《欧盟分类条例》,以促进企业运营的可持续性。这些要求要求资产管理者和机构投资者披露和评估其投资对 ESG 的影响,从而推动采用技术先进的 ESG 软件,以实现合规性和数据管理。此外,欧洲投资者扩大了可持续投资,以支持该地区的绿色协议目标,这增加了对有助于管理数据和做出明智决策的投资者 ESG 软件的需求。
投资者 ESG 软件市场区域洞察
Insight Partners 的分析师已详细解释了预测期内影响投资者 ESG 软件市场的区域趋势和因素。本节还讨论了北美、欧洲、亚太地区、中东和非洲以及南美和中美洲的投资者 ESG 软件市场细分和地理位置。
- 获取投资者 ESG 软件市场的区域特定数据
投资者 ESG 软件市场报告范围
| 报告属性 | 细节 |
|---|---|
| 2024 年的市场规模 | 10.8亿美元 |
| 2031 年市场规模 | 33.6亿美元 |
| 全球复合年增长率(2024 - 2031) | 17.6% |
| 史料 | 2021-2023 |
| 预测期 | 2021-2031 |
| 涵盖的领域 |
按组件
|
| 覆盖地区和国家 |
北美
|
| 市场领导者和主要公司简介 |
|
投资者 ESG 软件市场参与者密度:了解其对业务动态的影响
投资者 ESG 软件市场正在快速增长,这得益于最终用户需求的不断增长,而这些需求又源于消费者偏好的不断变化、技术进步以及对产品优势的认识不断提高等因素。随着需求的增加,企业正在扩大其产品范围,进行创新以满足消费者的需求,并利用新兴趋势,从而进一步推动市场增长。
市场参与者密度是指在特定市场或行业内运营的企业或公司的分布情况。它表明在给定市场空间中,相对于其规模或总市场价值,有多少竞争对手(市场参与者)存在。
在投资者 ESG 软件市场运营的主要公司有:
- 摩根士丹利资本国际
- Workiva 公司
- 晨星公司
- 伦敦证券交易所集团
- Cority软件公司
- Prophix 软件公司
免责声明:上面列出的公司没有按照任何特定顺序排列。
- 获取投资者 ESG 软件市场顶级关键参与者概览
投资者 ESG 软件市场新闻和最新发展
投资者 ESG 软件市场通过收集一手和二手研究后的定性和定量数据进行评估,其中包括重要的公司出版物、协会数据和数据库。投资者 ESG 软件市场的一些发展如下:
- Cority 宣布,所有利用其可持续性解决方案的客户都将在 2025 年升级到该公司基于 SaaS 的集成 CorityOne 平台。此次升级以客户十多年来信赖的可持续性管理现有技术为基础,将多种解决方案整合成一个无缝的、增强的用户体验,具有增强的功能,进一步简化操作并改善数据集成。
(来源:Cority Software Inc,新闻稿,2024 年 8 月)
- Sphera 宣布收购 SupplyShift,这是一家供应链可持续性软件公司,帮助企业建立透明、负责任且有弹性的供应链。此次收购增强了这家领先的 ESG 公司的供应链产品,扩大了供应商映射、评分和可追溯性功能,进一步帮助客户创建可持续的供应链。
(来源:Sphera Solutions, Inc.,新闻稿,2024 年 1 月)
投资者 ESG 软件市场报告覆盖范围和交付成果
“投资者 ESG 软件市场规模和预测(2021-2031 年)”对市场进行了详细分析,涵盖以下领域:
- 投资者 ESG 软件市场规模以及范围涵盖的所有关键细分市场的全球、区域和国家/地区预测
- 投资者 ESG 软件市场趋势,以及驱动因素、限制因素和关键机遇等市场动态
- 详细的 PEST 和 SWOT 分析
- 投资者 ESG 软件市场分析涵盖主要市场趋势、全球和区域框架、主要参与者、法规和最新市场发展
- 行业格局和竞争分析,涵盖市场集中度、热点图分析、知名参与者以及投资者 ESG 软件市场的最新发展
- 详细的公司简介

Ankita 是一位充满活力的市场研究和咨询专家,在科技、媒体、信息通信技术 (ICT) 以及电子和半导体领域拥有超过 8 年的经验。她成功领导并完成了 100 多项咨询和研究项目,服务对象包括微软、甲骨文、NEC Corporation、SAP、毕马威和 Expeditors International 等全球客户。她的核心能力包括市场评估、数据分析、预测、战略制定、竞争情报和报告撰写。
Ankita 擅长处理完整的项目周期——从售前的方案设计和客户洽谈,到售后提供切实可行的洞察。她擅长管理跨职能团队、构建复杂的研究模块,并根据客户特定的业务目标调整解决方案。她卓越的沟通能力、领导能力和演讲能力使她能够在快速变化的市场环境中持续提供价值驱动的成果。
- 历史分析(2 年)、基准年、预测(7 年)及复合年增长率
- PEST和SWOT分析
- 市场规模、价值/数量 - 全球、区域、国家
- 行业和竞争格局
- Excel 数据集
客户评价
Insight Partners 的 SCADA 系统市场报告内容全面,对当前趋势和未来预测提供了宝贵的见解。该团队始终高度专业、响应迅速且乐于助人。我们非常满意,强烈推荐他们的服务。
兰·凯德姆 伙伴, Reali Technologies LTD我请求一份关于特定软件市场的报告,团队在几天内就完成了。报告信息非常相关,而且呈现得非常出色。之后,我请求对报告进行一些修改和补充。团队再次迅速响应,不到一周我就收到了最终报告。
让-埃尔韦·詹恩 主席, 未来分析公司我们与 Insight Partners 合作进行了一项重要的市场研究和预测。他们清晰地洞察了机遇和风险,帮助我们制定了计划。他们的研究简单易用,数据可靠,帮助我们做出了明智而自信的决策。我们强烈推荐他们。
皮尤什·纳格帕尔 高级副总裁, 远光全球Insight Partners 凭借其深厚的行业专业知识,提供了富有洞察力、结构合理的市场研究。他们的团队始终专业且响应迅速。用户友好的网站让访问行业报告变得顺畅无阻。我们强烈推荐他们可靠、高质量的研究服务。
安达幸彦 首席执行官, 深蓝有限责任公司这是我第一次从The Insight Partners购买市场报告。起初我有些犹豫,但访问了他们的网站后,我更放心地冒险购买市场报告。我对报告的质量和客户服务非常满意。我对最初的报告有一些疑问和意见,但在与他们的分析师通过电子邮件沟通了几次后,我相信这份报告可以作为我们战略规划流程的参考。非常感谢您抽出宝贵的时间,让这次体验如此愉快。我一定会向其他人推荐你们的服务,当我们需要更多市场数据时,你们将是我的首选。
约翰·铃木 总裁兼首席执行官、董事会董事, BK科技感谢您在处理我关于尼日利亚传染病体外诊断市场信息请求的过程中所展现的支持和专业精神。感谢您的耐心、指导,以及您愿意提供的折扣,最终促成了这笔交易。我期待未来与 Insight Partners 继续合作,这一切都要归功于您与我初次接触后留下的良好印象。
奇吉奥克博士 ONYIA 董事总经理, PineCrest 医疗保健有限公司购买理由
- 明智的决策
- 了解市场动态
- 竞争分析
- 客户洞察
- 市场预测
- 风险规避
- 战略规划
- 投资论证
- 识别新兴市场
- 优化营销策略
- 提升运营效率
- 顺应监管趋势


 获取免费样品 - 投资者 ESG 软件市场