
IT 运营分析市场增长、规模、份额、趋势、关键参与者分析及 2031 年预测
IT 运营分析市场规模和预测(2021-2031 年)、全球和区域份额、趋势和增长机会分析报告覆盖范围:按产品(软件和服务)、部署(本地、云和混合)、应用程序[应用程序性能管理 (APM)、根本原因分析、网络和安全管理等]、行业垂直领域(BFSI、IT 和电信、零售和电子商务、医疗保健、制造业等)和地区(北美、欧洲、亚太地区、中东和非洲、南美和中美)
- 状态 : 已发布
- 报告代码 : TIPRE00011205
- 类别 : 科技、媒体和电信
- 页数 : 275
- 可用报告格式 :


- 最后更新日期 : August 26, 2025

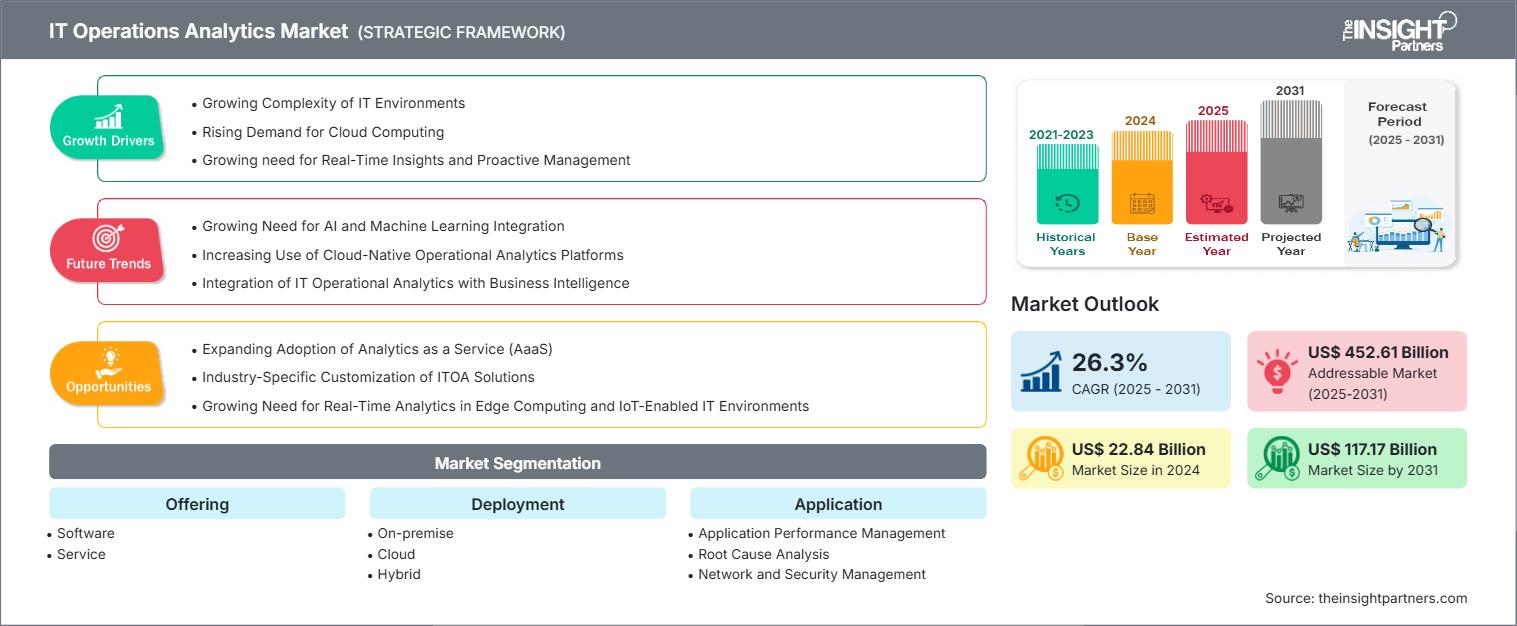
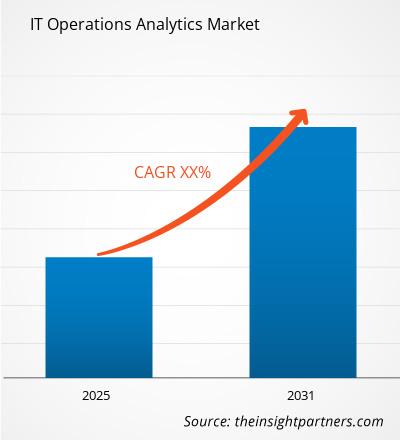
预计 2024 年 IT 运营分析市场规模将达到 228.4 亿美元,到 2031 年将达到 1171.7 亿美元。预计 2025 年至 2031 年期间,该市场的复合年增长率将达到 26.3%。
IT 运营分析市场分析随着企业寻求提高正常运行时间、保持业务连续性并从复杂的 IT 环境中获取可操作的情报,全球 ITOA 市场正在不断扩大。关键的市场驱动因素包括数据量的持续增长、云技术的采用、日益复杂的系统以及对主动安全和合规性管理的需求。混合云和多云架构、物联网部署和数字化转型计划的兴起进一步扩大了 ITOA 的采用机会。然而,高级分析平台成本高昂、与传统系统集成的挑战以及分析和人工智能人才短缺等因素可能会抑制市场增长。尽管存在这些限制,但市场对能够自动化性能监控、简化故障排除并支持数据驱动型 IT 战略的解决方案的需求依然强劲。
IT 运营分析市场概览IT 运营分析 (ITOA) 是指使用高级数据分析、机器学习和自动化技术来监控、评估和优化 IT 系统性能。通过分析网络、应用程序、云基础设施和设备生成的实时和历史数据,ITOA 使 IT 团队能够预防问题、检测异常并主动解决问题。该分析学科支持各种应用,包括根本原因分析、系统性能优化、事件管理、资源分配和安全监控。主要应用领域包括用于预测中断的预测分析、系统映射可视化、性能监控、合规性跟踪以及自动响应的编排。ITOA 解决方案有多种类型,例如事件关联工具、机器数据平台和 AI 驱动的可观察性套件,所有这些解决方案都旨在推动更快、更高效、由洞察驱动的 IT 运营。
您将免费获得任何报告的定制,包括本报告的部分内容,或国家级分析、Excel 数据包,以及为初创企业和大学提供超值优惠和折扣
IT运营分析市场: 战略洞察
-
获取本报告的主要市场趋势。这个免费样本将包括数据分析,从市场趋势到估计和预测。
IT 运营分析市场驱动因素和机遇
市场驱动因素:-
云计算需求不断增长:
云计算的兴起从根本上改变了 IT 运营分析 (ITOA) 的格局,通过为分析工具引入前所未有的可扩展性、灵活性和易于集成性,加速了市场增长。现代云环境会产生大量连续的新数据流,涵盖应用程序、设备、用户交互和交易。IT 组织利用基于云的 ITOA 解决方案来处理和分析这些运营数据,实时提取可行的洞察,从而优化系统性能、主动响应事件并增强服务可靠性。
-
对实时洞察和主动管理的需求不断增长:
ITOA 工具使 IT 团队能够持续监控系统运行状况、跟踪关键绩效指标 (KPI)、检测异常并可视化跨网络和应用程序的依赖关系。实时数据分析使组织能够快速查明问题的根本原因,通常在问题影响最终用户或业务之前。例如,影响系统性能的事件可以立即与基础设施或使用模式的变化关联起来,并将警报路由到正确的团队以便快速解决,从而大幅缩短平均修复时间。大型金融机构已利用统一的报告平台来消除手动报告周期——将数天的延迟响应转化为数分钟的可操作洞察,并最终增强业务连续性。
市场机遇:
-
分析即服务 (AaaS) 的采用范围不断扩大:
随着组织努力应对激增的运营数据量和日益复杂的基础设施,分析即服务 (AaaS) 正在成为一种强大的交付模式——它通过云平台提供托管、可扩展的分析,而无需沉重的基础设施投资负担。AaaS 平台默认集成人工智能和机器学习,可实现开箱即用的实时分析和预测洞察。这种模式与 ITOA 的需求完美契合,企业寻求即时、智能驱动的 IT 运营可视性,而无需大量的实施成本。 -
ITOA 解决方案的行业定制化:
随着各垂直行业的企业对定制化可观察性功能的需求日益增长,行业定制化已成为 ITOA 市场强大的增长杠杆。单一的通用分析平台通常无法满足特定行业的工作流程、合规性要求或数据结构。当 ITOA 解决方案进行定制化时——例如制造级分析、以医疗保健为中心的可观察性或以电信为中心的网络智能——它们能够通过更紧密地与业务和运营现实相结合,提供更大的价值。例如,拥有大规模物联网部署的制造商受益于实时机器监控和…… Observata 的制造可观测性平台帮助一家中型汽车零部件厂减少能源浪费,简化生产规程,从而根据装配车间的具体情况实现可持续性和效率改进。
IT 运营分析市场分为不同的细分市场,以便更清晰地了解其运作方式、增长潜力和最新趋势。以下是大多数行业报告中使用的标准细分方法:
按产品/服务:
-
软件:
软件细分市场构成了 IT 运营分析市场的核心,它提供平台和工具,使企业能够监控、分析和优化 IT 基础设施和应用程序性能。这些软件解决方案利用人工智能、机器学习和实时分析来处理海量运营数据,包括日志、指标、事件和轨迹。 -
服务:
服务细分市场是对 ITOA 软件的补充,提供最大化分析平台价值所需的专业知识、定制化和运营支持。它包括咨询、集成、实施、培训和持续支持,以及由外部供应商监督日常 IT 运营分析任务的托管服务。服务提供商帮助 ITOA 工具与业务目标保持一致,确保合规性,并实现跨系统的无缝数据集成。
按部署方式:
-
本地部署:
本地部署仍然是 IT 运营分析市场的关键部分,尤其对于在银行、政府、国防和医疗保健等受监管行业运营的组织而言。这些实体优先考虑数据主权、严格的合规性以及对基础设施的更严格控制——这使得本地 ITOA 解决方案成为首选。此模型提供增强的定制化和安全性,使组织能够根据特定的运营环境和内部策略定制分析平台。 -
云:
云部署是 IT 运营分析市场中增长最快的领域,这得益于向可扩展、灵活且按需数字化基础架构的转变。基于云的 ITOA 平台提供快速部署、极低的维护开销和持续更新——使其成为现代 DevOps 和敏捷环境的理想选择。这些解决方案支持动态资源监控、实时分析以及跨 SaaS、PaaS 和 IaaS 生态系统的无缝集成。 -
混合:
混合部署代表了 IT 运营分析市场的战略中间地带,它提供了同时监控云端和本地系统的灵活性。它在正在进行数字化转型但仍依赖于传统基础设施的大型企业中越来越受欢迎。
按应用:
- 应用程序性能管理 (APM)
- 根本原因分析 (RCA)
- 网络和安全管理
- 其他
垂直行业:
- BFSI
- 零售和电子商务
- IT 和电信
- 医疗保健
- 制造业
- 其他
按地域:
- 北美
- 欧洲
- 亚太地区
- 南美洲和中美洲
- 中东和非洲
北美 IT 运营分析市场是全球最大的市场,这得益于早期的云计算采用、大规模企业数字化以及对自动化和网络安全的高度重视。美国和加拿大聚集了众多财富 500 强企业、超大规模云服务提供商以及金融、电信、电子商务和医疗保健等科技驱动型行业——所有这些行业都严重依赖实时性能监控和 AIOps 功能。
IT运营分析市场
The Insight Partners 的分析师已详尽阐述了预测期内影响 IT 运营分析市场的区域趋势和因素。本节还讨论了北美、欧洲、亚太地区、中东和非洲以及南美和中美洲的 IT 运营分析市场细分和地域分布。
IT运营分析市场报告范围
| 报告属性 | 细节 |
|---|---|
| 市场规模 2024 | US$ 22.84 Billion |
| 市场规模 2031 | US$ 117.17 Billion |
| 全球复合年增长率 (2025 - 2031) | 26.3% |
| 历史数据 | 2021-2023 |
| 预测期 | 2025-2031 |
| 涵盖的领域 |
By 产品
|
| 覆盖地区和国家 |
北美
|
| 市场领导者和主要公司简介 |
|
IT 运营分析市场参与者密度:了解其对业务动态的影响
IT 运营分析市场正在快速增长,这得益于终端用户需求的不断增长,而这些需求又源于消费者偏好的不断变化、技术进步以及对产品优势的认知度不断提升等因素。随着需求的增长,企业正在扩展其产品线,不断创新以满足消费者需求,并抓住新兴趋势,从而进一步推动市场增长。
- 获取 IT运营分析市场 主要参与者概述
按地区划分的 IT 运营分析市场份额分析
受快速数字化转型、工业 4.0 和智慧城市战略以及智能基础设施计划的推动,亚太地区正在成为 IT 运营分析增长最快的市场之一。中国、印度、日本、韩国、新加坡和澳大利亚等国家是主要贡献者,每个国家都有不同的驱动因素。上述国家的初创公司和电信公司正在实施 ITOA 工具,以支持大规模、移动优先的消费者平台。
每个地区的 IT 运营分析市场增长情况不同。这是由于数字化转型、技术进步和产业扩张等因素造成的。以下是按地区划分的市场份额和趋势摘要:
1.
- 1. 北美
-
市场份额:
在全球 IT 运营分析市场中占有重要份额
-
关键驱动因素:
- 早期采用云技术
- 大规模企业数字化
- 高度重视自动化和网络安全
-
趋势:
云原生可观察性工具、混合基础设施监控和安全集成 ITOA 解决方案的创新
2. 欧洲
-
市场份额:
相当大的份额 -
关键驱动因素:
- 严格的数据治理法律
- 特定于行业的合规性要求
- 日益加强的数字主权推动力。
-
趋势:
对模块化、策略感知分析平台的需求、企业对传统基础设施进行现代化改造以及向云或混合模型过渡
3. 亚太地区
-
市场份额:
增长最快的地区,市场份额每年都在增长 -
关键驱动因素:
- 加速云采用
- 智能基础设施计划
- 新兴经济体和发达经济体的大规模数字化转型
-
趋势:
作为更广泛的工业 4.0 和智慧城市战略的一部分,对 ITOA 的投资以及对实时异常检测的高度关注
4.南美和中美洲
-
市场份额:
市场稳步增长 -
关键驱动因素:
- 政府增加对数字基础设施的投资
- 智慧城市和公共部门现代化
-
趋势:
国家战略专注于人工智能、云计算和数字化转型
5.中东和非洲
-
市场份额:
虽然规模较小,但增长迅速 -
关键驱动因素:
- 数字化转型
- 对智能 IT 运营的需求日益增长,尤其是在银行、电信和政府服务等领域
-
趋势:
越来越多的组织采用 ITOA 工具来应对与系统可用性、网络延迟和资源优化相关的挑战。
由于国际商业机器公司 (IBM)、思科系统公司 (Cisco Systems Inc)、New Relic Inc、Dynatrace LLC 和 ServiceNow Inc 等老牌参与者的存在,竞争非常激烈。此外,甲骨文公司 (Oracle Corp)、BMC Software, Inc.、微软公司 (Microsoft Corp)、Open Text Corp 和 Broadcom Inc 等区域性和专业性供应商也正在为充满活力和竞争力的市场做出贡献形势。
这种激烈的竞争促使公司通过提供以下服务脱颖而出:
- 先进的调查技术(例如,人工智能驱动的分析、机器学习和分析即服务 (AaaS))
- 跨平台取证支持(支持混合基础架构,包括本地、云和边缘环境)
- 针对 GDPR、CCPA 和 SOX 等法规的合规性中心解决方案
- 快速的根本原因分析和自动修复
机遇与战略举措
- 与 AIOps 供应商、云服务提供商和 DevOps 团队建立战略联盟对于扩展平台功能和加速数字化转型计划至关重要。
- 受可扩展性、灵活性和实时数据处理需求的推动,云原生 ITOA 解决方案和 ITOA 即服务模式正在获得发展势头。
- 向新兴地区扩张(亚太、中东、拉丁美洲)正在为各组织开辟新的增长途径,因为各组织正在对其 IT 基础设施进行现代化改造,并寻求主动的 IT 管理工具。
- 对人工智能、机器学习和预测分析的研发投资正在实现自动异常检测、根本原因分析和性能预测。
- 与 ITSM、APM、NPM 和可观察性平台的集成正在增强可见性,缩短平均解决时间 (MTTR),并支持统一的监控策略。
- 国际商业机器公司
- Dynatrace LLC
- Open Text Corp
- 思科系统公司
- BMC Software, Inc.
- 微软公司
- New Relic Inc
- Broadcom Inc
- ServiceNow Inc
- 甲骨文公司
免责声明:所列公司以上排名不分先后。
研究过程中分析的其他公司:
- Sisense Ltd.
- SolarWinds Worldwiden LLC
- Hitachi Vantara Corp
- NetApp Inc
- Elastic
- Broadcom
- Hewlett Packard Enterprise
- Sumo Logic
- Exabeam
- PagerDuty, Inc.
- LogicMonitor
- 戴尔公司
- ScienceLogic
- Datadog
- Zoho Corporation Pvt. Ltd.
- Atlassian
- Freshworks Inc.
- Anker
- Alteryx
- Nexthink
- HCL Technologies
- Cloud Software Group
- Veritas
- ExtraHop Networks
- Apica
-
IBM 推出全新代理和自动化功能
2025 年 4 月,IBM 为其托管检测和响应服务产品引入了全新代理和自动化功能,帮助客户实现自主安全运营和预测性威胁情报。IBM 正在推出自主威胁操作机器 (ATOM),这是一种代理 AI 系统,可在极少人工干预的情况下提供自主威胁分类、调查和补救。 IBM 还为 ATOM 推出了全新的 X-Force 预测威胁情报 (PTI) 代理,该代理利用特定于行业垂直领域的 AI 基础模型,生成有关潜在对抗活动的预测性威胁洞察,并最大限度地减少手动威胁搜寻工作。
-
思科推出 Cisco XDR 和 Splunk Security 的新功能
2025 年 4 月,思科宣布了多项重要创新和合作伙伴关系,以帮助安全团队应对 AI 时代日益严峻的挑战。该公司推出了 Cisco XDR 和 Splunk Security 的新功能、与 ServiceNow 建立了更深层次的合作伙伴关系,并推出了 Foundation AI。
-
Dynatrace 宣布推出全新的 AI 驱动的日志分析功能
2025 年 2 月,领先的 AI 驱动的可观察性平台 Dynatrace 宣布推出全新的 AI 驱动的日志分析功能,以应对组织在使用传统日志管理解决方案时面临的日益严峻的挑战。传统解决方案通常独立于现有监控工具运行,导致运营效率低下,进而导致事件解决延迟、成本增加和安全漏洞。
-
BMC 更新其 BMC Helix 平台
2025 年 5 月,全球领先的软件解决方案供应商 BMC Helix 宣布更新其 BMC Helix 平台,通过代理式人工智能 (AI) 实现生产力转型并提升员工体验。BMC Helix 致力于帮助全球最具前瞻性的 IT 组织将人工智能 (AI) 付诸实践。Helix 平台是首批采用新一代人工智能 (gen AI) 的市场化解决方案之一,它通过洞察和自动化提升服务交互质量和整体运营体验。BMC Helix IT Operations Management for AIOps 25.2 版本包含全新扩展的 AI 代理,以扩展可观察性、发现能力和洞察能力,从而防止重大事件发生并优化应用程序性能。
-
BMC 添加生成式 AI、低代码/无代码开发
2023 年 12 月,自主数字企业软件解决方案的全球领导者 BMC 将在 BMC Helix 服务管理解决方案中添加生成式 AI、低代码/无代码开发和上下文工具,帮助企业客户增强安全态势并提升工作方式。
《IT 运营分析市场规模和预测(2021-2031 年)》报告对以下领域进行了详细的市场分析:
- 涵盖范围内所有关键细分市场的全球、区域和国家/地区级别的 IT 运营分析市场规模和预测
- IT 运营分析市场趋势以及市场动态,例如驱动因素、限制因素和关键机遇
- 详细的 PEST 和 SWOT 分析分析
- IT 运营分析市场分析涵盖关键市场趋势、全球和区域框架、主要参与者、法规和最新市场发展
- 行业格局和竞争分析涵盖市场集中度、热图分析、知名参与者和 IT 运营分析市场的最新发展
- 详细的公司简介

Ankita 是一位充满活力的市场研究和咨询专家,在科技、媒体、信息通信技术 (ICT) 以及电子和半导体领域拥有超过 8 年的经验。她成功领导并完成了 100 多项咨询和研究项目,服务对象包括微软、甲骨文、NEC Corporation、SAP、毕马威和 Expeditors International 等全球客户。她的核心能力包括市场评估、数据分析、预测、战略制定、竞争情报和报告撰写。
Ankita 擅长处理完整的项目周期——从售前的方案设计和客户洽谈,到售后提供切实可行的洞察。她擅长管理跨职能团队、构建复杂的研究模块,并根据客户特定的业务目标调整解决方案。她卓越的沟通能力、领导能力和演讲能力使她能够在快速变化的市场环境中持续提供价值驱动的成果。
- 全面的市场规模与预测分析
- 详细的细分市场分析
- 深入的市场动态评估
- 区域及国家级洞察
- 竞争格局与企业对标分析
- 战略性商业情报
客户评价
Insight Partners 的 SCADA 系统市场报告内容全面,对当前趋势和未来预测提供了宝贵的见解。该团队始终高度专业、响应迅速且乐于助人。我们非常满意,强烈推荐他们的服务。
兰·凯德姆 伙伴, Reali Technologies LTD我请求一份关于特定软件市场的报告,团队在几天内就完成了。报告信息非常相关,而且呈现得非常出色。之后,我请求对报告进行一些修改和补充。团队再次迅速响应,不到一周我就收到了最终报告。
让-埃尔韦·詹恩 主席, 未来分析公司我们与 Insight Partners 合作进行了一项重要的市场研究和预测。他们清晰地洞察了机遇和风险,帮助我们制定了计划。他们的研究简单易用,数据可靠,帮助我们做出了明智而自信的决策。我们强烈推荐他们。
皮尤什·纳格帕尔 高级副总裁, 远光全球Insight Partners 凭借其深厚的行业专业知识,提供了富有洞察力、结构合理的市场研究。他们的团队始终专业且响应迅速。用户友好的网站让访问行业报告变得顺畅无阻。我们强烈推荐他们可靠、高质量的研究服务。
安达幸彦 首席执行官, 深蓝有限责任公司这是我第一次从The Insight Partners购买市场报告。起初我有些犹豫,但访问了他们的网站后,我更放心地冒险购买市场报告。我对报告的质量和客户服务非常满意。我对最初的报告有一些疑问和意见,但在与他们的分析师通过电子邮件沟通了几次后,我相信这份报告可以作为我们战略规划流程的参考。非常感谢您抽出宝贵的时间,让这次体验如此愉快。我一定会向其他人推荐你们的服务,当我们需要更多市场数据时,你们将是我的首选。
约翰·铃木 总裁兼首席执行官、董事会董事, BK科技感谢您在处理我关于尼日利亚传染病体外诊断市场信息请求的过程中所展现的支持和专业精神。感谢您的耐心、指导,以及您愿意提供的折扣,最终促成了这笔交易。我期待未来与 Insight Partners 继续合作,这一切都要归功于您与我初次接触后留下的良好印象。
奇吉奥克博士 ONYIA 董事总经理, PineCrest 医疗保健有限公司购买理由
- 明智的决策
- 了解市场动态
- 竞争分析
- 客户洞察
- 市场预测
- 风险规避
- 战略规划
- 投资论证
- 识别新兴市场
- 优化营销策略
- 提升运营效率
- 顺应监管趋势


