
再分布层材料市场战略、顶级参与者、增长机会、2030 年分析和预测
再分布层材料市场规模和预测(2020 - 2030 年)、全球和区域份额、趋势和增长机会分析报告范围:按类型 [聚酰亚胺 (PI)、聚苯并恶唑 (PBO)、苯并环丁烯 (BCB) 等] 和应用 {扇出型晶圆级封装 (FOWLP) 和 2.5D/3D IC 封装 [高带宽存储器 (HBM)、多芯片集成、堆叠封装 (FOPOP) 等]}
- 状态 : 已发布
- 报告代码 : TIPRE00002904
- 类别 : 化学品和材料
- 页数 : 161
- 可用报告格式 :


- 最后更新日期 : June 13, 2024

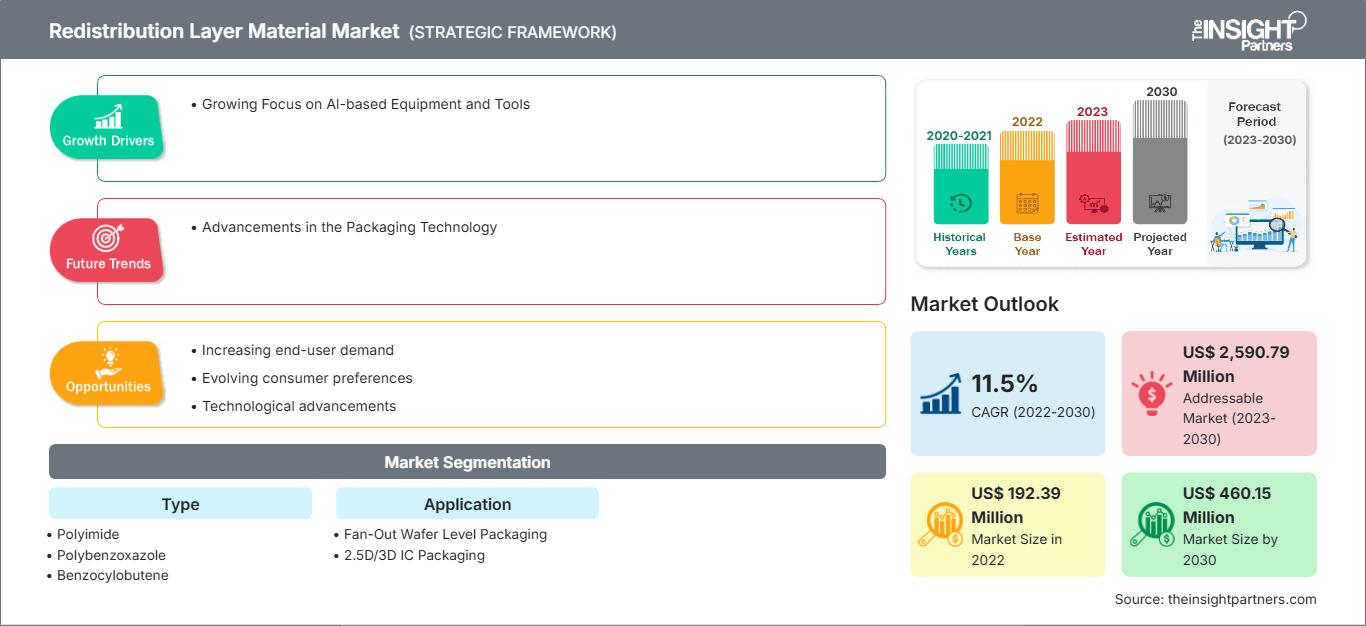
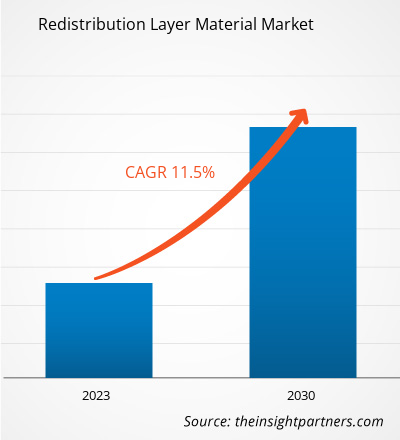
[研究报告] 预计重分布层材料市场规模将从 2022 年的 1.9239 亿美元增长到 2030 年的 4.6015 亿美元;预计 2022 年至 2030 年的复合年增长率为 11.5%。
市场洞察和分析师观点:
先进封装工艺始于芯片级,其目标始终是在不影响输入输出 (I/O) 密度的情况下减小芯片尺寸。其他几种新兴封装技术在器件异构集成中发挥着关键作用。晶圆级扇出型封装 (WLFO) 是主要的封装技术之一,它是一种综合封装工艺。早期的 WLFO 工艺只有单芯片设计,即在重组晶圆的一侧只有一个重分布层 (RDL)。RDL 是先进晶圆封装中的关键步骤。 RDL 可重新布线 I/O 布局,并支持更高的 I/O 数量。高 I/O 密度通常可带来更佳的电气性能,因为更多的输出会导致芯片之间电信号传输速度更快,并最大限度地降低电气短路带来的风险。此外,更高的 I/O 密度还能使封装同时实现更佳性能。此外,亚洲作为全球制造业中心的战略位置,加上具有竞争力的生产成本,吸引了寻求优化供应链的跨国公司。这为再分布层材料市场创造了一个强大的生态系统,众多供应商和制造商纷纷在该地区建立业务。这一因素极大地推动了全球再分布层材料市场的增长。
增长动力与挑战:
再分布层 (RDL) 材料是实现半导体封装小型化的基础,这对于适应日益复杂的人工智能设备至关重要。对更先进人工智能功能的追求需要开发紧凑且高集成度的硬件组件。随着人工智能系统日益复杂,对更小、更高效组件的需求也日益增长。因此,对基于人工智能的设备和工具日益增长的需求正在推动重分布层材料市场的发展。此外,全球重分布层材料市场正在经历显著增长,这主要得益于两大关键行业——汽车和电信——的需求激增。汽车行业不断增长的生产需求推动了市场的增长。根据尤索夫·伊萨东南亚研究所的数据,东南亚是重要的汽车生产基地。东南亚是全球第七大汽车制造中心,2021 年汽车产量达 350 万辆。然而,原材料价格波动对全球重分布层材料市场的增长构成了重大挑战。这些价格变化会对行业产生重大影响,影响生产成本、定价策略和整体市场稳定性。其中一个关键问题是对进口原材料的依赖。重分布层材料的许多基本成分,例如专用聚合物、金属和化学品,通常都来自国际供应商。
自定义此报告以满足您的要求
您将免费获得任何报告的定制,包括本报告的部分内容,或国家级分析、Excel 数据包,以及为初创企业和大学提供超值优惠和折扣
重分布层材料市场: 战略洞察
-
获取本报告的主要市场趋势。这个免费样本将包括数据分析,从市场趋势到估计和预测。
报告细分和范围:
全球再分布层材料市场根据类型和应用分为两类。根据类型,再分布层材料市场分为聚酰亚胺 (PI)、聚苯并恶唑 (PBO)、苯并环丁烯 (BCB) 等。根据应用,再分布层材料市场分为扇出型晶圆级封装 (FOWLP) 和 2.5D/3D IC 封装。从地理上讲,市场分为北美(美国、加拿大和墨西哥)、欧洲(德国、法国、意大利、英国、俄罗斯和欧洲其他地区)、亚太地区(澳大利亚、中国、日本、印度、韩国和亚太其他地区)、中东和非洲(阿联酋、沙特阿拉伯、南非和中东和非洲其他地区)以及南非和中美洲(巴西、阿根廷以及南美洲和中美洲其他地区)。
细分分析:
根据类型,再分布层材料市场细分为聚酰亚胺 (PI)、聚苯并恶唑 (PBO)、苯并环丁烯 (BCB) 和其他材料。聚酰亚胺 (PI) 细分市场在 2022 年占据最大市场份额。聚酰亚胺是一种基于聚合物的热塑性塑料,具有高熔体粘度,需要更高的压力才能成型模制部件。聚酰亚胺具有良好的耐化学性、高机械强度、更高的热稳定性和优异的电气性能。在 IC 封装方法中,聚酰亚胺可用作高温粘合剂、机械应力缓冲剂以及支撑微尺寸电路的薄膜。使用聚酰亚胺的唯一缺点是固化温度较高,而封装需要较低的固化温度。因此,一些材料供应商专注于提供固化温度较低的聚酰亚胺。PI 主要用于所有倒装芯片晶圆凸块和 WLP 应用。根据应用,重分布层材料市场可分为扇出型晶圆级封装 (FOWLP) 和 2.5D/3D IC 封装 [高带宽存储器 (HBM)、多芯片集成、层叠封装 (FOPOP) 等]。2022 年,重分布层材料在 2.5D/3D IC 封装领域的市场份额显著提升。下一代硅节点的光刻步骤和晶圆处理成本的普遍上升,促使业界寻求替代方案,以提升电子设备的性能和功能。此外,在小尺寸器件中集成逻辑、存储器、射频和传感器等不同技术的需求,也推动业界转向 3D 集成作为解决方案。
区域分析:
重分布层材料市场分为五个主要区域——北美、欧洲、亚太地区、南美和中美以及中东和非洲。亚太地区主导着全球再分配层材料市场,2022 年其市场规模达到 1.5 亿美元。北美也是一个主要贡献者,占据着全球再分配层材料市场的重要份额。预计到 2030 年,北美再分配层材料市场规模将超过 6000 万美元。预计 2022 年至 2030 年期间,欧洲的复合年增长率将超过 10%。亚太再分配层材料市场按国家/地区划分,包括澳大利亚、中国、印度、日本、韩国和亚太其他地区。汽车和电信行业对再分配层材料日益增长的需求推动了市场的发展。台湾在区域市场占据主导地位,其次是中国、韩国、日本和越南等国家。由于制造业多元化,该地区被视为全球制造业中心。随着中国逐渐发展成为高技能制造业中心,印度、韩国、台湾和越南等发展中国家/地区正在吸引众多企业,这些企业计划将其中低技能到中等技能的制造设施迁往邻国,从而降低劳动力成本。
行业发展和未来机遇:
以下列出了重分配层材料市场主要参与者采取的各种举措:
- 2022 年 8 月,日月光科技在马来西亚槟城举行了新的半导体封装和测试工厂的动工仪式。日月光马来西亚 (ASEM) 的新工厂将包括两栋建筑(4 号和 5 号厂房),建筑面积为 982,000 平方英尺,位于峇六拜自由工业区。
- 2021 年 7 月,杜邦移动技术与Materials 宣布计划向其位于德国和瑞士的制造工厂投资 500 万美元用于资本和运营资源,以提高其高性能汽车粘合剂的产能。
COVID-19 疫情影响:
COVID-19 疫情对各国几乎所有行业都产生了不利影响。北美、欧洲、亚太地区 (APAC)、南美和中美 (SAM) 以及中东和非洲 (MEA) 的封锁、企业停工和旅行限制阻碍了多个行业的增长,包括化学和材料行业。制造部门的关闭扰乱了全球供应链、制造活动、交付时间表以及必需和非必需产品的销售。多家公司报告称,2020 年产品交付延迟,产品销售下滑。由于疫情引发的经济衰退,消费者在购买决策时变得谨慎和挑剔。由于收入较低和收入前景不确定,消费者大幅减少了非必需品的购买,尤其是在发展中地区。许多再分配层材料制造商报告称,由于疫情初期消费者需求下降,利润有所下降。然而,到2021年底,许多国家已全面接种疫苗,各国政府宣布放松某些监管规定,包括封锁和旅行禁令。居民可支配收入增加,购买新家具和进行房屋翻新的意愿增强,从而刺激了对再分配层材料的需求。所有这些因素都推动了不同地区再分配层材料市场的增长。
再分配层材料
重分布层材料市场区域洞察The Insight Partners 的分析师已详尽阐述了预测期内影响再分配层材料市场的区域趋势和因素。本节还讨论了北美、欧洲、亚太地区、中东和非洲以及南美和中美洲的再分配层材料市场细分和地域分布。
重分布层材料市场报告范围
| 报告属性 | 细节 |
|---|---|
| 市场规模 2022 | US$ 192.39 Million |
| 市场规模 2030 | US$ 460.15 Million |
| 全球复合年增长率 (2022 - 2030) | 11.5% |
| 历史数据 | 2020-2021 |
| 预测期 | 2023-2030 |
| 涵盖的领域 |
By 类型
|
| 覆盖地区和国家 |
北美
|
| 市场领导者和主要公司简介 |
|
重分布层材料市场参与者密度:了解其对业务动态的影响
受消费者偏好变化、技术进步以及产品优势认知度提升等因素推动,终端用户需求不断增长,重分布层材料市场正在快速增长。随着需求的增长,企业正在扩展产品线,不断创新以满足消费者需求,并抓住新兴趋势,从而进一步推动市场增长。
- 获取 重分布层材料市场 主要参与者概述
竞争格局和主要公司:
SK海力士公司、三星电子有限公司、英飞凌科技股份公司、杜邦公司、富士胶片控股公司、安靠科技公司、日月光科技控股有限公司、恩智浦半导体公司、长电科技集团有限公司和信越化学株式会社是全球再分配层材料市场的领军企业。这些公司提供高质量的再分配层材料,满足全球众多消费者的需求。

- 全面的市场规模与预测分析
- 详细的细分市场分析
- 深入的市场动态评估
- 区域及国家级洞察
- 竞争格局与企业对标分析
- 战略性商业情报
客户评价
Insight Partners 的 SCADA 系统市场报告内容全面,对当前趋势和未来预测提供了宝贵的见解。该团队始终高度专业、响应迅速且乐于助人。我们非常满意,强烈推荐他们的服务。
兰·凯德姆 伙伴, Reali Technologies LTD我请求一份关于特定软件市场的报告,团队在几天内就完成了。报告信息非常相关,而且呈现得非常出色。之后,我请求对报告进行一些修改和补充。团队再次迅速响应,不到一周我就收到了最终报告。
让-埃尔韦·詹恩 主席, 未来分析公司我们与 Insight Partners 合作进行了一项重要的市场研究和预测。他们清晰地洞察了机遇和风险,帮助我们制定了计划。他们的研究简单易用,数据可靠,帮助我们做出了明智而自信的决策。我们强烈推荐他们。
皮尤什·纳格帕尔 高级副总裁, 远光全球Insight Partners 凭借其深厚的行业专业知识,提供了富有洞察力、结构合理的市场研究。他们的团队始终专业且响应迅速。用户友好的网站让访问行业报告变得顺畅无阻。我们强烈推荐他们可靠、高质量的研究服务。
安达幸彦 首席执行官, 深蓝有限责任公司这是我第一次从The Insight Partners购买市场报告。起初我有些犹豫,但访问了他们的网站后,我更放心地冒险购买市场报告。我对报告的质量和客户服务非常满意。我对最初的报告有一些疑问和意见,但在与他们的分析师通过电子邮件沟通了几次后,我相信这份报告可以作为我们战略规划流程的参考。非常感谢您抽出宝贵的时间,让这次体验如此愉快。我一定会向其他人推荐你们的服务,当我们需要更多市场数据时,你们将是我的首选。
约翰·铃木 总裁兼首席执行官、董事会董事, BK科技感谢您在处理我关于尼日利亚传染病体外诊断市场信息请求的过程中所展现的支持和专业精神。感谢您的耐心、指导,以及您愿意提供的折扣,最终促成了这笔交易。我期待未来与 Insight Partners 继续合作,这一切都要归功于您与我初次接触后留下的良好印象。
奇吉奥克博士 ONYIA 董事总经理, PineCrest 医疗保健有限公司购买理由
- 明智的决策
- 了解市场动态
- 竞争分析
- 客户洞察
- 市场预测
- 风险规避
- 战略规划
- 投资论证
- 识别新兴市场
- 优化营销策略
- 提升运营效率
- 顺应监管趋势


