智能水表市场规模、份额及需求预测(2034年)
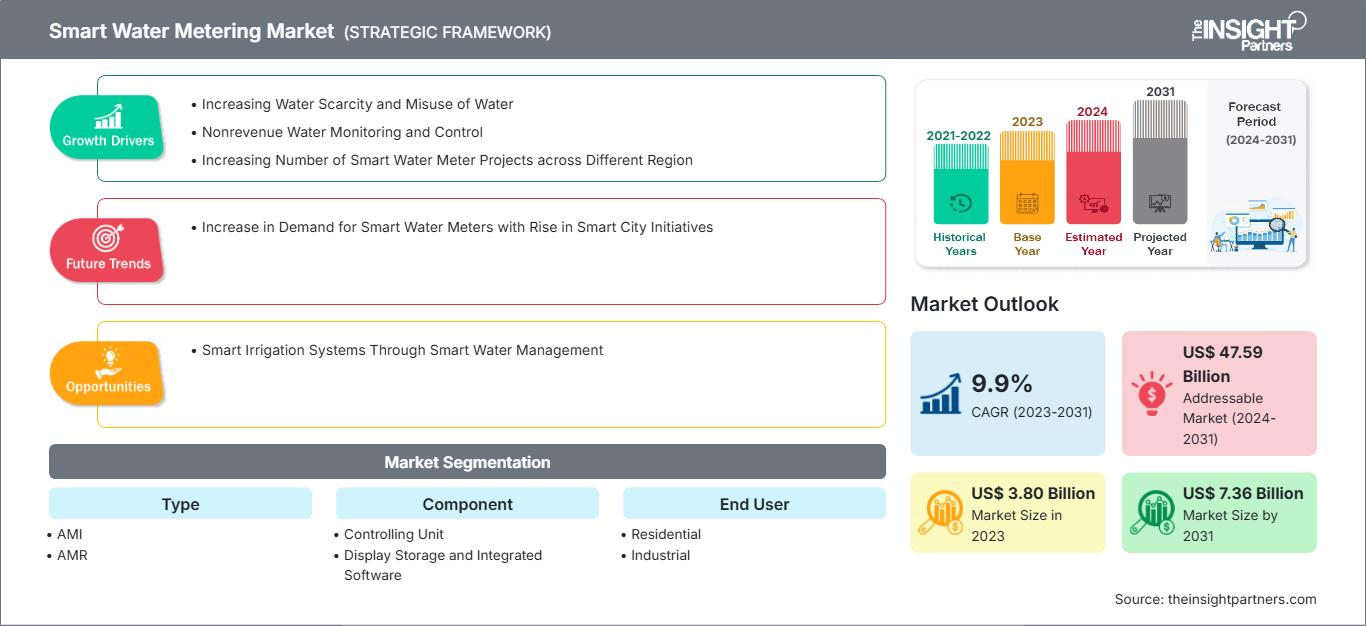
智能水表市场规模及预测(2021-2034 年)、全球及区域份额、趋势和增长机会分析报告涵盖范围:按类型(AMI 和 AMR)、应用(住宅、商业、工业)和地理区域(北美、欧洲、亚太、中东和非洲以及南美和中美洲)划分
- 状态 : 已发布
- 报告代码 : TIPTE100000347
- 类别 : 电子和半导体
- 页数 : 216
- 可用报告格式 :


- 最后更新日期 : April 08, 2026


智能水表市场规模预计将从2025年的62亿美元增长到2034年的158.4亿美元。预计该市场在2026年至2034年期间的复合年增长率将达到11.5%。
智能水表市场分析
智能水表市场正因城市化进程、水资源短缺以及智慧城市建设等举措而不断扩张。高级计量基础设施(AMI)有助于泄漏检测、实时监控和数据分析,从而提高公用事业公司的运营效率。市场上的主要参与者包括Sensus、Itron和霍尼韦尔。
智能水表市场概览
智能水表依靠物联网 (IoT)、低功耗广域网 (LPWAN) 和云技术来实现远程计量、用水量分析和预测性维护。由于监管要求和可持续发展战略的推动,住宅、商业和工业领域的智能水表应用日益普及。行业趋势包括 Badger Meter 和 Kamstrup 等公司开展的合作和平台战略。
根据您的需求定制此报告
获取免费定制服务智能水表市场:战略洞察
-
获取本报告的主要市场趋势。这份免费样品将包含数据分析,内容涵盖市场趋势、估算和预测等。
智能水表市场驱动因素和机遇
市场驱动因素:
- 城市化与基础设施现代化:快速的城市化进程给供水企业带来了优化供水效率的压力。智能水表能够实现自动抄表、漏水检测和用水量分析,帮助城市优化老旧基础设施,降低运营成本。
- 水资源日益短缺与节水要求:日益严重的水资源短缺和政府日益严格的监管迫使公用事业公司采用先进的计量技术。智能水表能够提供实时用水数据,增强消费者的责任感,并通过精准的监测和报告系统促进节水措施的实施。
- 物联网和连接技术的进步:物联网、低功耗广域网和云分析功能的集成提升了智能电表的功能。像Itron这样的公司利用互联平台提供预测性维护、远程监控和数据驱动的决策功能。
市场机遇:
- 新兴经济体扩张:发展中地区正在投资智慧城市和数字化公用事业项目。不断增长的基础设施投资为大规模部署智能电表创造了机遇,从而提高计费准确性和水资源管理水平。
- 与智慧城市生态系统集成:智能电表可与智慧城市平台集成,实现集中式公用事业管理。与西门子等技术供应商的合作,支持高级分析和跨公用事业优化解决方案。
- 高级数据分析和人工智能应用:人工智能驱动的分析技术日益普及,为消费预测和需求管理带来了新的机遇。智能电表能够生成宝贵的数据集,帮助公用事业公司优化供电计划并提升客户互动策略。
智能水表市场报告细分分析
为了解智能水表市场的结构、增长前景和新兴趋势,可将其划分为不同的细分市场。以下是行业报告中常用的标准细分方法:
按技术分类:
- AMI:智能水表中的AMI技术实现了公用事业公司与用户之间的双向通信。AMI系统提供实时数据采集,使公用事业公司能够监测用水量、检测泄漏并高效优化供水。该技术支持远程抄表、动态定价和预测性维护,从而提高运营效率并减少水资源浪费。
- AMR:AMR技术可实现水表单向远程抄表,无需人工抄表。AMR系统利用射频(RF)或蜂窝网络,按预定时间间隔将用水量数据传输给公用事业公司。虽然AMR无法提供AMI的实时数据,但它能提高计费准确性、运营效率并降低人工成本。
最终用户:
- 住宅用水:住宅用水量不断增长,节水意识也日益增强。智能水表有助于精准计费、漏水检测和实时用水量监测,从而帮助减少浪费,并有效管理房主的每月用水开支。
- 商业用途:办公楼、酒店、医院和零售综合体等商业场所采用智能水表来监控高用水量。这些系统有助于成本控制、符合可持续发展要求并及早发现泄漏,从而在确保运营效率的同时满足环境和监管标准。
- 工业领域:各行各业都需要精确的水量监测,以支持制造、加工和冷却作业。智能水表可提供详细的用水量分析,帮助企业优化资源利用、遵守法规,并最大限度地减少因泄漏或低效用水管理措施造成的生产中断。
按地理位置:
- 北美
- 欧洲
- 亚太地区
- 南美洲和中美洲
- 中东和非洲
智能水表市场报告范围
| 报告属性 | 细节 |
|---|---|
| 2025年市场规模 | 62亿美元 |
| 2026-2034年市场规模 | 158.4亿美元 |
| 全球复合年增长率(2026-2034 年) | 11.5% |
| 史料 | 2021-2024 |
| 预测期 | 2026-2034 |
| 涵盖的领域 |
按类型
|
| 覆盖地区和国家 |
北美
|
| 市场领导者和主要公司简介 |
|
智能水表市场参与者密度:了解其对商业动态的影响
智能水表市场正快速增长,主要受终端用户需求不断增长的推动,而这又源于消费者偏好的转变、技术的进步以及消费者对产品优势认知的提高。随着需求的增长,企业不断拓展产品和服务,持续创新以满足消费者需求,并把握新兴趋势,这些都进一步推动了市场增长。
智能水表市场份额地域分析
亚太地区智能水表市场正经历快速增长,这主要得益于加速的城市化进程、政府主导的智慧城市计划以及日益严峻的水资源短缺问题。中国、印度和日本等国家正大力投资数字化水务基础设施、先进计量技术和物联网集成,以提高效率、减少无收益水并支持可持续资源管理。基础设施投资的增加、公私合作以及旨在促进精准计费系统的监管改革也进一步推动了市场需求。城市公用事业的扩张和云端监控平台的日益普及也加速了智能水表的部署。
智能水表市场增长因各地区基础设施成熟度、监管政策、水资源短缺程度、政府投入以及数字化技术普及速度的差异而有所不同。以下是各地区市场份额和趋势概述:
1. 北美洲
- 市场份额:占据全球市场相当大的份额
-
关键驱动因素:
- 先进的公用设施基础设施现代化:美国和加拿大老化的水利基础设施正在促使公用事业公司采用智能水表,以提高运营效率、减少泄漏损失、实现远程监控并加强长期资产管理策略。
- 严格的监管合规要求
- 物联网计量技术得到广泛应用
- 趋势:AMI 平台的日益普及增强了实时分析、客户互动和自动计费的准确性。
2. 欧洲
- 市场份额:由于欧盟早期出台的严格法规,占据了相当大的份额。
-
关键驱动因素:
- 严格的节水法规:欧盟指令促进高效用水和计费透明化,鼓励公用事业公司实施智能水表,以支持泄漏检测、用水量跟踪和遵守环境可持续性框架。
- 可持续发展和碳中和目标
- 政府支持的数字化转型计划。
- 趋势:将智能电表整合到更广泛的智慧城市生态系统中,可以改善跨公用事业的数据协调和可持续性规划。
3. 亚太地区
- 市场份额:增长最快的地区,占据主导市场份额
-
关键驱动因素:
- 快速的城市化和人口增长:中国和印度等国家不断扩大的都市人口给公用事业公司带来了更大的压力,促使其部署智能水表,以实现高效的配水管理和减少无收益水。
- 智慧城市基础设施投资
- 水资源短缺问题日益严重
- 趋势:公用事业公司采用物联网平台和云分析技术来实现水资源管理系统的现代化。
4. 中东和非洲
- 市场份额:虽然规模较小,但增长迅速。
-
关键驱动因素:
- 严峻的水资源短缺挑战:干旱的气候和有限的淡水资源迫使各国政府部署智能水表,以跟踪用水量、进行需求管理,并提高城市和工业部门的可持续性。
- 政府海水淡化和水资源管理投资
- 智能基础设施多元化计划
- 趋势:智能计量支持与国家可持续发展愿景和基础设施现代化目标相一致的长期节水战略。
5. 南美洲和中美洲
- 市场份额:市场稳步增长
-
关键驱动因素:
- 基础设施发展举措:由于泄漏和盗窃造成的大量水资源损失促使公用事业公司实施智能计量系统,以提高监测精度、加强收入征收并提高运营透明度。
- 减少水资源损失(无收益水)。
- 不断发展的公私合作关系
- 趋势:试点项目和分阶段部署是区域智能电表实施策略的特点。
市场密度高,竞争激烈
由于西门子股份公司、施耐德电气股份公司、霍尼韦尔国际公司、哈勃公司、兰吉尔集团股份公司、艾创公司、博维科技公司、ZENNER国际有限公司、赛莱默公司和Sagemcom英国有限公司等全球主要企业的参与,竞争非常激烈。
激烈的竞争促使企业通过提供以下服务来脱颖而出:
- 创新型仪表设计
- 先进的物联网智能计量
- 经济高效的解决方案
- 全面的客户支持
- 产品组合扩大。
机遇与战略举措
- 与智慧城市计划的整合——与智慧城市项目合作,使公司能够提供互联互通的公用事业解决方案,增强跨公用事业数据分析和运营效率。
- 人工智能和数据分析应用——利用人工智能进行预测性维护、需求预测和消费优化,为公用事业公司和消费者创造增值服务。
研究过程中分析的其他公司包括:
- 阿拉德集团
- 卡姆斯特鲁普
- 獾牌计量器公司
- 海王星科技集团有限公司
- 迪尔计量
- Aclara Technologies LLC
- Master Meter, Inc.
- 穆勒系统有限责任公司
- 宁波水表有限公司
- 三川智慧科技有限公司
- 森特朗科技有限公司
- Datamatic公司
- B METERS srl
- 阿奎巴有限公司
- BETAR公司
智能水表市场新闻及最新进展
- 2025年5月,ZENNER在LoRa联盟大会上发布了IUWS超声波水表。这款水表实现了无缝计量。其并行无线电功能使其能够同时通过无线M-Bus和LoRaWAN发送测量数据。新款ZENNER IoT Gateway Outdoor 16也备受瞩目——这款功能强大的网关专为满足物联网应用的需求而开发,并支持远距离节能数据传输。
- BOVE 于 2025 年 6 月加速部署 4G Cat. 1 智能水表。此举旨在助力新兴市场实现智慧公用事业发展。随着智慧城市和数字化公用事业的持续发展,4G 蜂窝技术已成为智能计量领域广泛采用的连接解决方案。
智能水表市场报告涵盖范围及成果
《智能水表市场规模及预测(2021-2034)》报告对以下领域进行了详细的市场分析:
- 智能水表市场规模及预测,涵盖全球、区域和国家层面的所有细分市场。
- 智能水表市场趋势,以及驱动因素、制约因素和主要机遇等动态因素。
- 详细的PEST和SWOT分析
- 智能水表市场医疗保健分析,涵盖关键趋势、全球和区域框架、主要参与者、法规和最新发展
- 智能水表市场的行业格局和竞争分析,包括市场集中度、热力图分析、主要参与者和最新发展动态
- 公司详细概况

Naveen 是一位经验丰富的市场研究和咨询专业人士,在定制项目、联合项目和咨询项目方面拥有超过 9 年的专业经验。他目前担任副总裁,成功管理了项目价值链中的利益相关者,撰写了 100 多份研究报告和 30 多项咨询项目。他的工作涵盖工业和政府项目,为客户的成功和数据驱动的决策做出了重要贡献。
Naveen 拥有卡纳塔克邦 VTU 的电子与通信工程学位,以及马尼帕尔大学的市场营销与运营 MBA 学位。他已担任 IEEE 会员 9 年,积极参与各种会议、技术研讨会,并在分部和地区层面担任志愿者。在此之前,他曾担任 IndustryARC 的助理战略顾问和惠普(惠普全球)的工业服务器顾问。
- 全面的市场规模与预测分析
- 详细的细分市场分析
- 深入的市场动态评估
- 区域及国家级洞察
- 竞争格局与企业对标分析
- 战略性商业情报
客户评价
Insight Partners 的 SCADA 系统市场报告内容全面,对当前趋势和未来预测提供了宝贵的见解。该团队始终高度专业、响应迅速且乐于助人。我们非常满意,强烈推荐他们的服务。
兰·凯德姆 伙伴, Reali Technologies LTD我请求一份关于特定软件市场的报告,团队在几天内就完成了。报告信息非常相关,而且呈现得非常出色。之后,我请求对报告进行一些修改和补充。团队再次迅速响应,不到一周我就收到了最终报告。
让-埃尔韦·詹恩 主席, 未来分析公司我们与 Insight Partners 合作进行了一项重要的市场研究和预测。他们清晰地洞察了机遇和风险,帮助我们制定了计划。他们的研究简单易用,数据可靠,帮助我们做出了明智而自信的决策。我们强烈推荐他们。
皮尤什·纳格帕尔 高级副总裁, 远光全球Insight Partners 凭借其深厚的行业专业知识,提供了富有洞察力、结构合理的市场研究。他们的团队始终专业且响应迅速。用户友好的网站让访问行业报告变得顺畅无阻。我们强烈推荐他们可靠、高质量的研究服务。
安达幸彦 首席执行官, 深蓝有限责任公司这是我第一次从The Insight Partners购买市场报告。起初我有些犹豫,但访问了他们的网站后,我更放心地冒险购买市场报告。我对报告的质量和客户服务非常满意。我对最初的报告有一些疑问和意见,但在与他们的分析师通过电子邮件沟通了几次后,我相信这份报告可以作为我们战略规划流程的参考。非常感谢您抽出宝贵的时间,让这次体验如此愉快。我一定会向其他人推荐你们的服务,当我们需要更多市场数据时,你们将是我的首选。
约翰·铃木 总裁兼首席执行官、董事会董事, BK科技感谢您在处理我关于尼日利亚传染病体外诊断市场信息请求的过程中所展现的支持和专业精神。感谢您的耐心、指导,以及您愿意提供的折扣,最终促成了这笔交易。我期待未来与 Insight Partners 继续合作,这一切都要归功于您与我初次接触后留下的良好印象。
奇吉奥克博士 ONYIA 董事总经理, PineCrest 医疗保健有限公司购买理由
- 明智的决策
- 了解市场动态
- 竞争分析
- 客户洞察
- 市场预测
- 风险规避
- 战略规划
- 投资论证
- 识别新兴市场
- 优化营销策略
- 提升运营效率
- 顺应监管趋势


