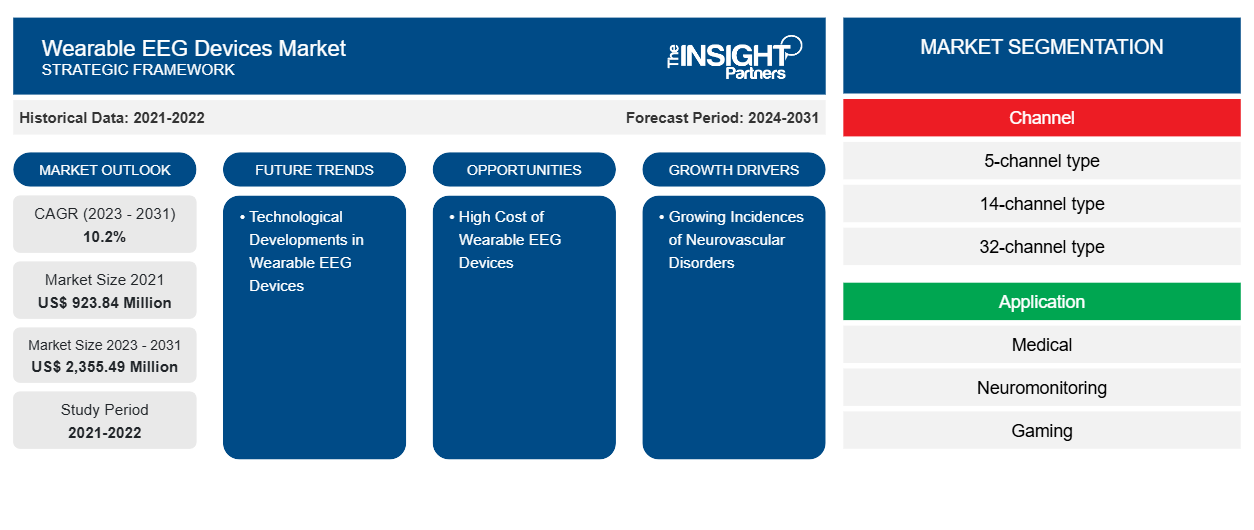
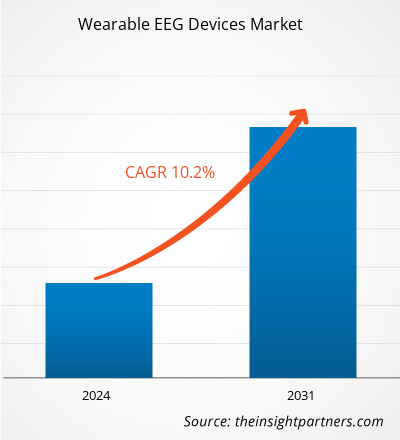
可穿戴脑电图设备市场规模预计将从2024年的3.9617亿美元增至2031年的6.9551亿美元。预计2025年至2031年期间,该市场的复合年增长率将达到8.7%。与人工智能的融合可能会在未来几年为市场带来新的趋势。
可穿戴脑电图设备市场分析
可穿戴脑电图 (EEG) 设备是一种先进的非侵入式系统,旨在实时监测和记录脑电活动。传统脑电图设备通常局限于医院或临床环境,且需要复杂的接线,而可穿戴脑电图设备则具有便携性、易用性和持续监测功能,使其成为临床和非临床应用的理想选择。这些设备由嵌入耳机、帽子或腕带的紧凑轻巧的传感器组成,可检测脑电波模式并将数据无线传输到智能手机、平板电脑或云端系统。捕获的数据可用于分析,以检测异常情况、评估神经系统状况、监测精神状态或优化认知能力。与人工智能和机器学习的集成进一步提高了诊断准确性,并提供了个性化的洞察。
可穿戴脑电图设备市场概况
神经系统疾病患病率的上升、技术的不断进步以及医疗保健、游戏、体育、学术研究和其他领域对非侵入式脑监测的需求不断增长,正在推动可穿戴脑电图 (EEG) 设备市场的增长。2024 年 1 月,斯坦福大学的研究人员开发了一种能够解读脑电图信号的可穿戴电子帽。这一突破使用户能够控制机器人、执行清洁等任务、与机器宠物互动,甚至完全通过脑活动准备简单的饭菜。这些进步凸显了脑电图技术在临床应用之外的应用不断扩展,展现了其增强人机交互的潜力。此外,全球人口老龄化是市场扩张的主要推动因素。老年人患阿尔茨海默病、帕金森病和中风等神经系统疾病的风险更高。随着预期寿命的延长,对持续监测和有效管理与年龄相关的健康状况的需求也在不断增长。可穿戴脑电图设备能够提供实时、非侵入式的脑监测,是满足这一日益增长的需求的理想之选。
您可以免费定制任何报告,包括本报告的部分内容、国家级分析、Excel 数据包,以及为初创企业和大学提供优惠和折扣
可穿戴脑电图设备市场:

- 获取此报告的顶级关键市场趋势。此免费样品将包括数据分析,从市场趋势到估计和预测。
可穿戴脑电图设备市场驱动因素和机遇
老年人口不断增加
医疗保健的进步和生活水平的提高延长了预期寿命,导致全球老年人口数量急剧上升。根据世界卫生组织2024年10月的数据,到2050年,全球80%的老年人口将居住在中低收入国家。人口老龄化的速度比前几代人更快。2020年,60岁及以上老年人口的数量超过了5岁以下儿童的数量。此外,预计2015年至2050年间,全球60岁以上人口的比例将增长近一倍,从12%上升到22%。
随着老龄人口的增长,医疗保健提供者面临着管理慢性神经系统疾病的挑战,这些疾病通常需要长期观察大脑活动。传统的脑电图 (EEG) 方法通常局限于医院环境,由于其复杂性和不适性,不太适合满足这一人群的需求。相比之下,可穿戴脑电图设备提供了一种便捷、非侵入性且患者友好的实时脑部监测解决方案,能够在家庭或社区环境中持续收集数据。对远程医疗解决方案日益增长的需求与可穿戴脑电图技术的功能完美契合。这些设备通过促进远程诊断和减少医院就诊频率来支持远程医疗计划,从而改善患者的治疗效果并降低医疗成本。因此,老年人口的增长推动了对可穿戴脑电图设备的需求。
扩大非医疗领域的应用
虽然可穿戴脑电图 (EEG) 设备传统上与临床和神经系统应用相关,但其在非医疗领域的不断扩展应用为市场带来了巨大的增长机会。EEG 技术与消费者健康、游戏、教育、工作场所生产力和神经营销的融合,正在开辟新的收入来源,并使市场格局更加多样化。在消费者健康领域,可穿戴脑电图设备越来越多地被用于压力管理、冥想增强、睡眠优化和其他应用。实时追踪脑电波的设备使用户能够监测心理状态,并采用一些技术来提高注意力、情绪健康和认知能力。这与全球对个性化健康和心理健康解决方案日益增长的需求相契合。
在游戏和虚拟现实(VR) 领域,支持脑电图 (EEG) 的头戴式设备正被用于通过响应玩家的认知和情绪状态来创造沉浸式体验。同样,教育领域也正在探索脑电图技术,通过神经反馈、注意力追踪和认知训练工具来提升学习成果,尤其针对有学习障碍的学生。企业部门也在采用基于脑电图的工具来监测员工的压力、认知负荷和生产力水平,以优化工作环境并提高绩效。同时,在神经营销领域,脑电图设备通过测量消费者对广告、品牌和产品设计的潜意识反应,为消费者行为提供了宝贵的洞察。这些非医疗应用不仅拓宽了客户群,还减少了对传统医疗保健市场的依赖,使可穿戴脑电图 (EEG) 市场更能抵御监管和报销限制。随着设备制造商不断改进可用性、设计和价格承受能力,可穿戴脑电图设备在非临床环境中的应用预计将加速,从而推动长期市场增长和创新。
可穿戴脑电图设备市场报告细分分析
有助于可穿戴脑电图设备市场分析的关键部分是产品和应用。
- 按产品划分,全球可穿戴脑电图设备市场分为32通道脑电图、14通道脑电图、5通道脑电图及其他类型。2024年,32通道脑电图占据了可穿戴脑电图设备市场的最大份额。
- 根据应用,全球可穿戴脑电图设备市场细分为健康与保健、人机自适应交互、汽车、航空、工业及其他领域。2024年,健康与保健领域占据了可穿戴脑电图设备市场的最大份额。
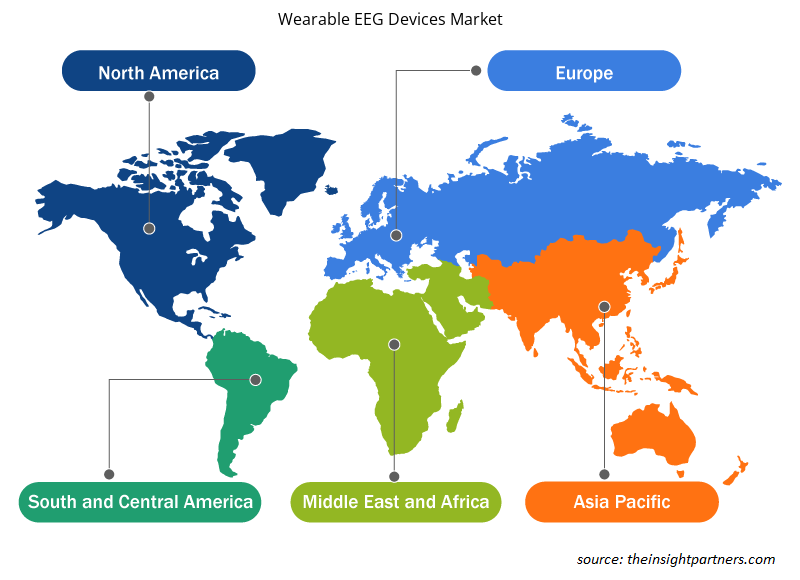
可穿戴脑电图设备市场份额(按地区)分析
可穿戴脑电图设备市场报告的地理范围主要分为五个地区:北美、亚太地区、欧洲、中东和非洲、南美和中美。
2024年,亚太地区占据了相当大的市场份额。随着癫痫、中风和痴呆等神经系统疾病患病率的不断上升,亚太地区的可穿戴脑电图 (EEG) 设备市场有望快速增长,成为重要驱动因素。根据经济合作与发展组织 (OECD) 发布的《健康概览:2024年亚太地区》报告,精神健康状况是亚太地区面临的重大公共卫生挑战,影响着约4.75亿人,约占该地区总人口的七分之一。可穿戴脑电图 (EEG) 设备为早期诊断和持续监测提供了经济高效、非侵入式的解决方案,满足了关键的医疗保健需求。
该地区(尤其是日本和韩国)不断扩大的医疗基础设施,通过对远程医疗和数字医疗的投资,促进了这些技术的采用。中国的“健康中国2030”规划等政府举措,正在推动先进医疗技术的发展。“健康中国行动2019-2030”是一项旨在改善中国公共卫生和福祉的综合性国家战略。它侧重于疾病预防、健康促进和缩小健康差距。该行动包含15项专项行动,尤其强调抗击非传染性疾病(NCD)和促进全民健康覆盖。
可穿戴脑电图设备市场区域洞察
Insight Partners 的分析师已详尽阐述了预测期内影响可穿戴脑电图设备市场的区域趋势和因素。本节还讨论了北美、欧洲、亚太地区、中东和非洲以及南美和中美洲的可穿戴脑电图设备市场细分和地域分布。

- 获取可穿戴脑电图设备市场的区域特定数据
可穿戴脑电图设备市场报告范围
报告属性 | 细节 |
---|---|
2024年的市场规模 | 3.9617亿美元 |
2031年的市场规模 | 6.9551亿美元 |
全球复合年增长率(2025-2031) | 8.7% |
史料 | 2021-2023 |
预测期 | 2025-2031 |
涵盖的领域 | 按产品
|
覆盖地区和国家 | 北美
|
市场领导者和主要公司简介 |
|
可穿戴脑电图设备市场参与者密度:了解其对业务动态的影响
可穿戴脑电图设备市场正在快速增长,这得益于终端用户需求的不断增长,而这些需求的驱动因素包括消费者偏好的演变、技术进步以及对产品优势的认知度的提升。随着需求的增长,企业正在扩展产品线,不断创新以满足消费者需求,并抓住新兴趋势,从而进一步推动市场增长。
市场参与者密度是指特定市场或行业内企业或公司的分布情况。它表明特定市场空间内竞争对手(市场参与者)的数量相对于其规模或总市值而言。
可穿戴脑电图设备市场的主要公司有:
- 脑比特
- ANT Neuro
- 脑产品有限公司
- Electrical Geodesics, Inc.(荷兰皇家飞利浦公司)
- EMOTIV
- g.tec 医疗工程有限公司
免责声明:以上列出的公司没有按照任何特定顺序排列。

- 获取可穿戴脑电图设备市场主要参与者概览
可穿戴脑电图设备市场新闻及最新发展
可穿戴脑电图设备市场评估是通过收集一手资料和二手资料后进行的定性和定量数据进行的,这些数据包括重要的企业出版物、协会数据和数据库。以下列出了可穿戴脑电图设备市场的一些发展:
- BrainBit 和 ROOK 欣然宣布建立新的合作伙伴关系,旨在改变健康数据的使用方式。ROOK 的 API 使开发者能够将数百种可穿戴设备(现在包括 BrainBit 设备)的数据无缝集成、处理和嵌入到他们的应用程序中。此次合作消除了开发者在单个集成上投入大量时间的需要,使团队能够专注于创建有效的健康解决方案。(来源:BrainBit Inc,新闻稿,2024 年 6 月)
- Neuro XR (NXR) 和 Emotiv 宣布推出情绪热力图技术,将 NXR 的分析软件与 Emotiv 的脑电图 (EEG) 设备相结合。此次合作将彻底改变情绪和行为分析,提供对用户参与度的实时洞察。(来源:Emotiv,新闻稿,2025 年 1 月)
可穿戴脑电图设备市场报告覆盖范围及交付成果
《可穿戴脑电图设备市场规模及预测(2021-2031)》报告对以下领域进行了详细的市场分析:
- 可穿戴脑电图设备市场规模及预测,涵盖全球、区域和国家层面的所有关键细分市场
- 可穿戴脑电图设备市场趋势,以及驱动因素、限制因素和关键机遇等市场动态
- 详细的 PEST 和 SWOT 分析
- 可穿戴脑电图设备市场分析涵盖主要市场趋势、全球和区域框架、主要参与者、法规和最新市场发展
- 行业格局和竞争分析,包括市场集中度、热图分析、知名参与者以及可穿戴脑电图设备市场的最新发展
- 详细的公司简介
- 历史分析(2 年)、基准年、预测(7 年)及复合年增长率
- PEST 和 SWOT 分析
- 市场规模价值/数量 - 全球、区域、国家
- 行业和竞争格局
- Excel 数据集


Report Coverage
Revenue forecast, Company Analysis, Industry landscape, Growth factors, and Trends

Segment Covered
This text is related
to segments covered.

Regional Scope
North America, Europe, Asia Pacific, Middle East & Africa, South & Central America

Country Scope
This text is related
to country scope.
常见问题
The wearable EEG devices market is expected to reach US$ 695.51 million in the year 2031.
The North America held the largest market share in 2024, followed by Europe.
Growing Prevalence of Neurological Disorders; Increasing Geriatric Population; and Rising Number of Traumatic Brain Injuries are the driving factors impacting the wearable EEG devices market.
Integration with Artificial Intelligence is the future trends of the wearable EEG devices market.
The key players, holding majority shares, in wearable EEG devices market includes BrainBit, NeuroSky, Brain Products GmbH, Emotiv, and MagstimEGI.
The wearable EEG devices market was valued at US$ 396.17 million in 2024 and is projected to reach US$ 695.51 million by 2031; it is expected to grow at a CAGR of 8.7% during 2025–2031.
The List of Companies - Wearable EEG Devices Market
- BrainBit Inc.
- ANT Neuro
- Brain Products GmbH
- EMOTIV
- g.tec medical engineering GmbH
- Neuroelectrics Barcelona S.L.U.
- Cadwell Industries Inc
- Magstim
- Wearable Sensing
- NeuroSky Inc
The Insight Partners performs research in 4 major stages: Data Collection & Secondary Research, Primary Research, Data Analysis and Data Triangulation & Final Review.
- Data Collection and Secondary Research:
As a market research and consulting firm operating from a decade, we have published and advised several client across the globe. First step for any study will start with an assessment of currently available data and insights from existing reports. Further, historical and current market information is collected from Investor Presentations, Annual Reports, SEC Filings, etc., and other information related to company’s performance and market positioning are gathered from Paid Databases (Factiva, Hoovers, and Reuters) and various other publications available in public domain.
Several associations trade associates, technical forums, institutes, societies and organization are accessed to gain technical as well as market related insights through their publications such as research papers, blogs and press releases related to the studies are referred to get cues about the market. Further, white papers, journals, magazines, and other news articles published in last 3 years are scrutinized and analyzed to understand the current market trends.
- Primary Research:
The primarily interview analysis comprise of data obtained from industry participants interview and answers to survey questions gathered by in-house primary team.
For primary research, interviews are conducted with industry experts/CEOs/Marketing Managers/VPs/Subject Matter Experts from both demand and supply side to get a 360-degree view of the market. The primary team conducts several interviews based on the complexity of the markets to understand the various market trends and dynamics which makes research more credible and precise.
A typical research interview fulfils the following functions:
- Provides first-hand information on the market size, market trends, growth trends, competitive landscape, and outlook
- Validates and strengthens in-house secondary research findings
- Develops the analysis team’s expertise and market understanding
Primary research involves email interactions and telephone interviews for each market, category, segment, and sub-segment across geographies. The participants who typically take part in such a process include, but are not limited to:
- Industry participants: VPs, business development managers, market intelligence managers and national sales managers
- Outside experts: Valuation experts, research analysts and key opinion leaders specializing in the electronics and semiconductor industry.
Below is the breakup of our primary respondents by company, designation, and region:
Once we receive the confirmation from primary research sources or primary respondents, we finalize the base year market estimation and forecast the data as per the macroeconomic and microeconomic factors assessed during data collection.
- Data Analysis:
Once data is validated through both secondary as well as primary respondents, we finalize the market estimations by hypothesis formulation and factor analysis at regional and country level.
- Macro-Economic Factor Analysis:
We analyse macroeconomic indicators such the gross domestic product (GDP), increase in the demand for goods and services across industries, technological advancement, regional economic growth, governmental policies, the influence of COVID-19, PEST analysis, and other aspects. This analysis aids in setting benchmarks for various nations/regions and approximating market splits. Additionally, the general trend of the aforementioned components aid in determining the market's development possibilities.
- Country Level Data:
Various factors that are especially aligned to the country are taken into account to determine the market size for a certain area and country, including the presence of vendors, such as headquarters and offices, the country's GDP, demand patterns, and industry growth. To comprehend the market dynamics for the nation, a number of growth variables, inhibitors, application areas, and current market trends are researched. The aforementioned elements aid in determining the country's overall market's growth potential.
- Company Profile:
The “Table of Contents” is formulated by listing and analyzing more than 25 - 30 companies operating in the market ecosystem across geographies. However, we profile only 10 companies as a standard practice in our syndicate reports. These 10 companies comprise leading, emerging, and regional players. Nonetheless, our analysis is not restricted to the 10 listed companies, we also analyze other companies present in the market to develop a holistic view and understand the prevailing trends. The “Company Profiles” section in the report covers key facts, business description, products & services, financial information, SWOT analysis, and key developments. The financial information presented is extracted from the annual reports and official documents of the publicly listed companies. Upon collecting the information for the sections of respective companies, we verify them via various primary sources and then compile the data in respective company profiles. The company level information helps us in deriving the base number as well as in forecasting the market size.
- Developing Base Number:
Aggregation of sales statistics (2020-2022) and macro-economic factor, and other secondary and primary research insights are utilized to arrive at base number and related market shares for 2022. The data gaps are identified in this step and relevant market data is analyzed, collected from paid primary interviews or databases. On finalizing the base year market size, forecasts are developed on the basis of macro-economic, industry and market growth factors and company level analysis.
- Data Triangulation and Final Review:
The market findings and base year market size calculations are validated from supply as well as demand side. Demand side validations are based on macro-economic factor analysis and benchmarks for respective regions and countries. In case of supply side validations, revenues of major companies are estimated (in case not available) based on industry benchmark, approximate number of employees, product portfolio, and primary interviews revenues are gathered. Further revenue from target product/service segment is assessed to avoid overshooting of market statistics. In case of heavy deviations between supply and demand side values, all thes steps are repeated to achieve synchronization.
We follow an iterative model, wherein we share our research findings with Subject Matter Experts (SME’s) and Key Opinion Leaders (KOLs) until consensus view of the market is not formulated – this model negates any drastic deviation in the opinions of experts. Only validated and universally acceptable research findings are quoted in our reports.
We have important check points that we use to validate our research findings – which we call – data triangulation, where we validate the information, we generate from secondary sources with primary interviews and then we re-validate with our internal data bases and Subject matter experts. This comprehensive model enables us to deliver high quality, reliable data in shortest possible time.