استراتيجيات سوق أجهزة التشفير، وأهم اللاعبين، وفرص النمو، والتحليل والتوقعات بحلول عام 2031
البيانات التاريخية : 2021-2022 | سنة الأساس : 2023 | فترة التنبؤ : 2024-2031حجم سوق أجهزة التشفير وتوقعاته (2021-2031)، والحصة العالمية والإقليمية، والاتجاهات، وفرص النمو. تغطية التقرير: حسب النوع (الخطي والدوار)، والتكنولوجيا (البصرية، والمغناطيسية، والحثية، وغيرها)، والجغرافيا.
- تاريخ التقرير : Jan 2025
- رمز التقرير : TIPTE100000522
- الفئة : الإلكترونيات وأشباه الموصلات
- الحالة : نُشرت
- تنسيقات التقارير المتاحة :


- عدد الصفحات : 95
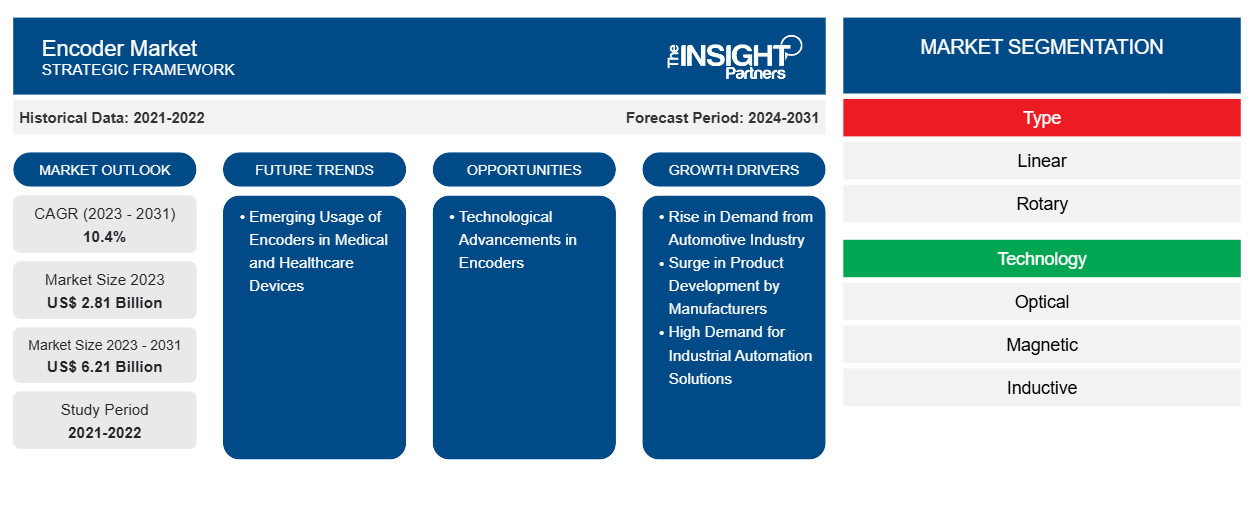
من المتوقع أن يصل حجم سوق أجهزة الترميز إلى 6.21 مليار دولار أمريكي بحلول عام 2031 من 2.81 مليار دولار أمريكي في عام 2023. ومن المتوقع أن يسجل السوق معدل نمو سنوي مركب بنسبة 10.4٪ خلال الفترة 2023-2031. ومن المرجح أن يؤدي الاستخدام الناشئ لأجهزة الترميز في الأجهزة الطبية والرعاية الصحية إلى ظهور اتجاهات جديدة في السوق في السنوات القادمة.
تحليل سوق أجهزة الترميز
إن ارتفاع الطلب من صناعة السيارات؛ والطلب المرتفع على حلول الأتمتة الصناعية بين الشركات الصغيرة والمتوسطة والكبيرة؛ وتركيز الشركات المصنعة على تصنيع سيارات جديدة هي بعض العوامل المهمة التي تدفع سوق أجهزة الترميز . علاوة على ذلك، فإن زيادة الاستثمار في الروبوتات وحلول الأتمتة الصناعية تزيد من الطلب العالمي على أجهزة الترميز. بالإضافة إلى ذلك، من المتوقع أن يؤدي التقدم التكنولوجي وتكامل التقنيات المتقدمة مثل تقنية إنترنت الأشياء الصناعية (IIoT) وأجهزة الترميز عالية السرعة وأجهزة استشعار الصور عالية الدقة ذات المصفوفة الطورية وشريحة LED الزرقاء في أجهزة الترميز التي تقلل من تكاليف التشغيل إلى خلق فرص لنمو السوق خلال فترة التنبؤ. علاوة على ذلك، فإن ارتفاع الطلب على أجهزة الترميز المخصصة، وتركيز الشركات المصنعة على تطوير أجهزة ترميز صغيرة، وزيادة أنشطة البحث والتطوير تدفع سوق أجهزة الترميز.
نظرة عامة على سوق أجهزة الترميز
المشفر هو جهاز يحول الحركة إلى إشارة كهربائية يمكن قراءتها بواسطة جهاز التحكم في الحركة مثل العداد أو PLC. إنه يترجم المعلومات من تنسيق أو رمز إلى آخر، وعادةً ما يكون ذلك عن طريق تغيير الحركة المادية أو الموضع إلى إشارة رقمية. يرسل المشفر إشارة تغذية مرتدة يمكن استخدامها لحساب الموضع والسرعة والاتجاه. هذا الإجراء ضروري للحفاظ على التوحيد والسرعة والضغط في مجموعة متنوعة من التطبيقات التقنية. تلعب أجهزة التشفير دورًا حاسمًا في ترجمة الحركات الميكانيكية إلى بيانات كهربائية قابلة للاستخدام، وهو أمر مطلوب للتحكم الدقيق في النظام وأتمتته. تعد أجهزة التشفير مكونات أساسية للتكنولوجيا الحديثة التي تضمن الدقة والتحكم في مجموعة واسعة من التطبيقات، بما في ذلك الآلات الصناعية والإلكترونيات الاستهلاكية. هذا المستوى من الدقة ضروري للمهام التي تتطلب دقة عالية، مثل خطوط التجميع والروبوتات الجراحية. تُستخدم أجهزة التشفير في أجهزة الإلكترونيات الاستهلاكية مثل الفئران ولوحات المفاتيح لترجمة تصرفات المستخدم إلى إشارات رقمية يمكن لأجهزة الكمبيوتر التعامل معها، وبالتالي تحسين تجربة المستخدم وتفاعله.
قم بتخصيص هذا التقرير ليناسب متطلباتك
ستحصل على تخصيص لأي تقرير - مجانًا - بما في ذلك أجزاء من هذا التقرير، أو تحليل على مستوى الدولة، وحزمة بيانات Excel، بالإضافة إلى الاستفادة من العروض والخصومات الرائعة للشركات الناشئة والجامعات
سوق أجهزة الترميز: رؤى استراتيجية
-
احصل على أهم اتجاهات السوق الرئيسية لهذا التقرير.ستتضمن هذه العينة المجانية تحليلاً للبيانات، بدءًا من اتجاهات السوق وحتى التقديرات والتوقعات.
محركات وفرص سوق أجهزة التشفير
ارتفاع الطلب من صناعة السيارات
يتم تجهيز السيارات بشكل متزايد بمجموعة من التقنيات المتقدمة والرقمية لجعل القيادة أكثر أمانًا وراحة للمستخدمين. تلعب أجهزة التشفير دورًا مهمًا في صناعة السيارات، حيث تعمل على تحسين دقة وأداء وسلامة العديد من أنظمة المركبات. في السيارات الحديثة والكهربائية، يتم استخدام أجهزة التشفير في مجموعة متنوعة من التطبيقات، بما في ذلك أنظمة التوجيه الكهربائي (EPS)، وأنظمة التحكم في المحرك، وأنظمة المكابح المانعة للانغلاق (ABS)، وأنظمة التحكم في الجر، والتحكم في موضع المصابيح الأمامية، وأنظمة البطاريات، وغيرها. في أنظمة EPS، يتم استخدام أجهزة التشفير لمراقبة موضع عجلة القيادة من خلال ضمان التحكم والاستجابة الدقيقة. وبالمثل، في أنظمة ABS والتحكم في الجر، يتم استخدام أجهزة التشفير للكشف عن انزلاق العجلات ومنعه، مما يدعم تعزيز استقرار السيارة. على سبيل المثال، وفقًا لتقرير وكالة الطاقة الدولية السنوي عن السيارات الكهربائية العالمية لعام 2024، تم بيع ما يقرب من 14 مليون سيارة كهربائية في جميع أنحاء العالم في عام 2023، وهو ما يزيد بمقدار 3.5 مليون عن عام 2022، بزيادة قدرها 35٪ على أساس سنوي؛ وهذا يجعل العدد الإجمالي للسيارات على الطرق 40 مليونًا. يُظهر هذا النمو في عدد السيارات أن حصة السيارات الكهربائية في سوق السيارات الإجمالية ارتفعت إلى 18٪ في عام 2023، ارتفاعًا من 14٪ في عام 2022. تعمل المبيعات المتزايدة للسيارات الكهربائية في جميع أنحاء العالم على تعزيز اعتماد أجهزة التشفير بين مصنعي السيارات للتحكم في المحرك في المركبات الكهربائية والهجينة. توفر هذه الأجهزة التشفيرية ملاحظات دقيقة حول سرعة المحرك وموضعه واتجاهه، مما يسمح بكفاءة طاقة أفضل وتحسين الأداء. تعد موثوقية ودقة الملاحظات التي توفرها أجهزة التشفير أمرًا بالغ الأهمية للمستخدمين والمصنعين لتحسين التعامل مع المركبات وتحقيق لوائح السلامة وتعزيز تكنولوجيا القيادة الذاتية. علاوة على ذلك، فإن التقدم في صناعة السيارات والتطور المتزايد في الأتمتة والكهرباء يزيد من الطلب على أجهزة التشفير عالية الدقة. يتم استخدام أجهزة التشفير عالية الدقة في أنظمة القيادة الذاتية مثل مثبت السرعة التكيفي، والذي يستخدم سرعة العجلة وموضعها لإدارة التسارع والكبح. لذلك، فإن الطلب المتزايد على دوائر التشفير المتكاملة من صناعة السيارات يحرك سوق أجهزة التشفير.
التطورات التكنولوجية في أجهزة الترميز
إن الطلب المتزايد على الأتمتة الصناعية وكفاءة الطاقة والحلول المستدامة بين الصناعات يعزز الحاجة إلى أجهزة ترميز متقدمة تقنيًا في جميع أنحاء العالم. إن دمج التقنيات المتقدمة مثل إنترنت الأشياء الصناعي والمنتجات المتقدمة، بما في ذلك أجهزة الترميز عالية السرعة وأجهزة استشعار الصور عالية الدقة ذات المصفوفة الطورية وشريحة LED الزرقاء، مع أجهزة الترميز يمكن أن يوفر ميزات مراقبة وتحكم متقدمة، والتي قد تمكن بشكل أكبر من جمع البيانات وتحليلها في الوقت الفعلي. على سبيل المثال، أطلقت شركة MELEXIS جهاز MLX90382، وهو عبارة عن IC ترميز عالي السرعة لأتمتة الصناعة والروبوتات وحلول التنقل. MLX90382 عبارة عن IC ترميز مغناطيسي مطلق مدمج مع مستشعر موضع مغناطيسي متجانس. إنه يجمع بين واجهة أمامية مغناطيسية هول ومحول تناظري إلى رقمي ومعالجة إشارة رقمية على الشريحة مع زمن انتقال صفري وبرامج تشغيل إخراج متعددة، مما يجعل الجهاز مناسبًا للتطبيقات التي تعمل بمحرك كهربائي، مثل الأذرع الروبوتية وآلات النسيج الصناعية وآلات التعبئة والتغليف الآلية. يسمح الحجم الصغير لـ MLX90382، وقدرته على مقاومة المجال الضال، ودعمه للاستشعار على المحور وخارجه، بالتكامل السلس مع المحركات الدقيقة. تم تصميم هذه المشفرات لتلبية احتياجات الصناعة للتغذية الراجعة عالية السرعة والتي تعد ضرورية لتصحيح أداء وسلامة التطبيقات التي تعمل بمحرك كهربائي.
وفقًا لبيانات شركة Valin Corporation في ديسمبر 2022، يوفر إنترنت الأشياء الصناعي فوائد كبيرة للمشفرات من خلال تحسين إمكانية الوصول إلى البيانات والأداء والموثوقية. يوفر إنترنت الأشياء الصناعي مراقبة في الوقت الفعلي وتشخيصات عن بُعد، مما يسمح للعمال بتتبع ظروف وأداء المشفر باستمرار من خلال القضاء على وقت التوقف. على سبيل المثال، يعد مشفر إيثرنت الصناعي Sendix من Kubler مع واجهة OPC UA المتكاملة مناسبًا للغاية لتطبيقات إنترنت الأشياء الصناعي. إنه قادر على أتمتة الاتصالات المستقلة عن التحكم لحل سحابي أو نظام آخر أعلى مستوى. يسمح تكوين المشفر عبر الإنترنت بالاتصال عبر الأنظمة ويزيل الأعطال بسرعة وكفاءة في حالة حدوث عطل. على سبيل المثال، تدعم مشفرات إيثرنت الصناعية من Kubler المدمجة مع واجهات Profinet أو EtherCAT أو EtherNet/IP واجهة OPC UA، وبالتالي زيادة التنوع والسماح بنقل البيانات إلى التحكم أو خادم الويب أو السحابة في وقت واحد. يتيح دمج أجهزة التشفير مع الأنظمة التي تدعم إنترنت الأشياء الصناعي تجميع البيانات من هذه الأجهزة ومعالجتها وتخزينها على منصات قائمة على السحابة، مما يوفر رؤى مهمة حول أنماط المعدات والكفاءة التشغيلية.
وبالتالي، فمن المتوقع أن يؤدي التقدم التكنولوجي في أجهزة الترميز إلى خلق فرص لنمو سوق أجهزة الترميز خلال الفترة المتوقعة.
تحليل تجزئة تقرير سوق أجهزة الترميز
إن القطاعات الرئيسية التي ساهمت في استخلاص تحليل سوق أجهزة الترميز هي النوع والتكنولوجيا.
- وفقًا للنوع، ينقسم سوق أجهزة الترميز إلى خطية ودوارة. احتلت شريحة الأجهزة الدوارة حصة أكبر من السوق في عام 2023.
- بناءً على التكنولوجيا، يتم تقسيم سوق أجهزة الترميز إلى بصرية ومغناطيسية وحثية وغيرها. احتل القطاع البصري الحصة الأكبر من السوق في عام 2023.
تحليل حصة سوق أجهزة الترميز حسب المنطقة الجغرافية
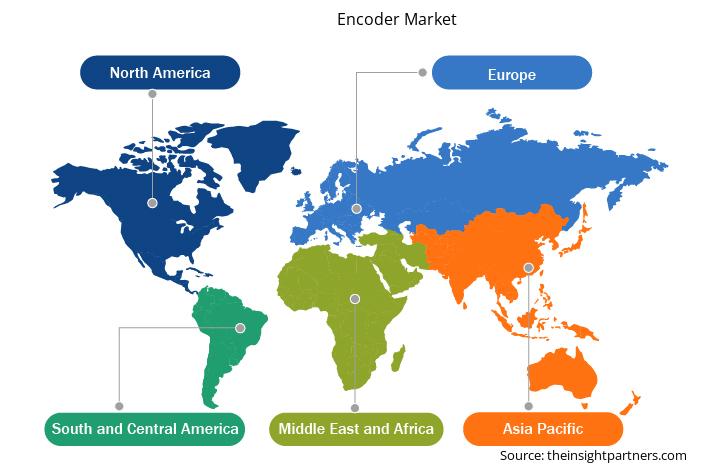
ينقسم النطاق الجغرافي لتقرير سوق المشفر بشكل أساسي إلى خمس مناطق: أمريكا الشمالية، ومنطقة آسيا والمحيط الهادئ، وأوروبا، والشرق الأوسط وأفريقيا، وأمريكا الجنوبية والوسطى.
استحوذت أمريكا الشمالية على حصة سوقية كبيرة في عام 2023. تعد الولايات المتحدة وكندا والمكسيك من بين الاقتصادات الرئيسية في أمريكا الشمالية. تساهم المنطقة بحصة ملحوظة في سوق أجهزة التشفير العالمية نظرًا للاستثمارات المتزايدة من قبل الصناعات نحو تبني الروبوتات. على سبيل المثال، وفقًا لبيانات الاتحاد الدولي للروبوتات (IFR) المنشورة في أبريل 2024، تستثمر الصناعات في الولايات المتحدة وكندا والمكسيك بكثافة في تبني الروبوتات وتثبيتها لأتمتة العمليات الصناعية. تعد صناعة السيارات والكهرباء والإلكترونيات والتصنيع الصناعات الرئيسية التي تستثمر بشكل كبير في تقنيات الروبوتات، مما يزيد من الطلب على أجهزة التشفير للتنقل في موضع وسرعة وحركة أجزاء الروبوتات.
الولايات المتحدة هي ثاني أكبر منتج للسيارات والمركبات الخفيفة في العالم بعد الصين. ارتفعت مبيعات سوق السيارات في الولايات المتحدة بنسبة 1٪، مع تسجيل رقم قياسي بلغ 14678 روبوتًا تم تركيبها في عام 2023، والتي زادت بنسبة 47٪ مع تركيب 14472 وحدة في عام 2022. في عام 2023، تمثل شركات تصنيع السيارات والمكونات 33٪ من جميع عمليات نشر الروبوتات الصناعية في البلاد. وبالمثل، في عام 2023، زادت عمليات تركيب الروبوتات في كندا بنسبة 43٪ إلى 4616 وحدة. شكلت صناعة السيارات 55% من تركيبات الروبوتات في البلاد، وزادت مبيعات قطاع السيارات بنسبة 99%، حيث تم تركيب 2549 وحدة في عام 2023. بالإضافة إلى ذلك، بلغ عدد الروبوتات المثبتة في صناعة التصنيع في المكسيك 5868 وحدة في صناعة السيارات في عام 2023. تعد صناعة السيارات أكبر دولة في البلاد تتبنى الروبوتات، حيث تمثل 69% من إجمالي التركيبات التي بلغ إجمالي مبيعاتها 4068 وحدة في عام 2023. أدى التوسع المتزايد لصناعة السيارات والتركيب المتزايد للروبوتات إلى زيادة اعتماد أجهزة الترميز في خطوط إنتاج السيارات. تُستخدم أجهزة الترميز في خطوط تصنيع السيارات للحفاظ على الدقة المتسقة وتقليل الأخطاء وضمان تكرار الروبوتات. الروبوتات في صناعة السيارات مسؤولة عن مهام مثل تركيب الأجزاء وتطبيق الطلاء وعمليات اللحام المعقدة. تسمح أجهزة الترميز للروبوتات بالتفاعل في الوقت الفعلي مع أي اختلافات في المواضع من خلال تحسين كفاءة وجودة العمليات.
رؤى إقليمية حول سوق أجهزة التشفير
لقد قام المحللون في Insight Partners بشرح الاتجاهات والعوامل الإقليمية المؤثرة على سوق التشفير طوال فترة التنبؤ بشكل شامل. يناقش هذا القسم أيضًا قطاعات سوق التشفير والجغرافيا في جميع أنحاء أمريكا الشمالية وأوروبا ومنطقة آسيا والمحيط الهادئ والشرق الأوسط وأفريقيا وأمريكا الجنوبية والوسطى.
- احصل على البيانات الإقليمية المحددة لسوق أجهزة التشفير
نطاق تقرير سوق أجهزة التشفير
| سمة التقرير | تفاصيل |
|---|---|
| حجم السوق في عام 2023 | 2.81 مليار دولار أمريكي |
| حجم السوق بحلول عام 2031 | 6.21 مليار دولار أمريكي |
| معدل النمو السنوي المركب العالمي (2023 - 2031) | 10.4% |
| البيانات التاريخية | 2021-2022 |
| فترة التنبؤ | 2024-2031 |
| القطاعات المغطاة |
حسب النوع
|
| المناطق والدول المغطاة |
أمريكا الشمالية
|
| قادة السوق وملفات تعريف الشركات الرئيسية |
|
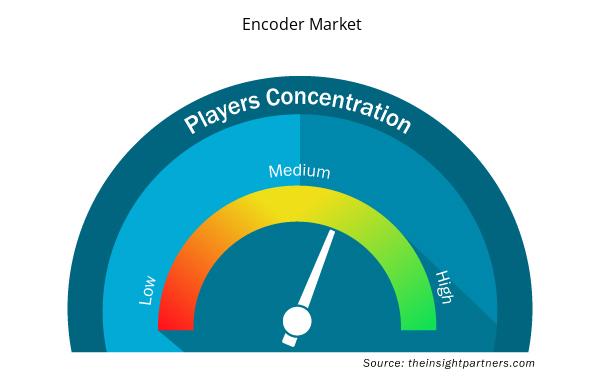
كثافة اللاعبين في سوق أجهزة التشفير: فهم تأثيرها على ديناميكيات الأعمال
يشهد سوق أجهزة التشفير نموًا سريعًا، مدفوعًا بالطلب المتزايد من جانب المستخدم النهائي بسبب عوامل مثل تفضيلات المستهلكين المتطورة والتقدم التكنولوجي والوعي المتزايد بفوائد المنتج. ومع ارتفاع الطلب، تعمل الشركات على توسيع عروضها والابتكار لتلبية احتياجات المستهلكين والاستفادة من الاتجاهات الناشئة، مما يؤدي إلى زيادة نمو السوق.
تشير كثافة اللاعبين في السوق إلى توزيع الشركات أو المؤسسات العاملة في سوق أو صناعة معينة. وهي تشير إلى عدد المنافسين (اللاعبين في السوق) الموجودين في مساحة سوق معينة نسبة إلى حجمها أو قيمتها السوقية الإجمالية.
الشركات الرئيسية العاملة في سوق التشفير هي:
- شركة أساهي كاساي للأجهزة الدقيقة
- فيشاي إنترتكنولوجي المحدودة
- AG مريض
- شركة هونيويل الدولية
- شركة روهم المحدودة
- شركة اليجرو مايكرو سيستمز
إخلاء المسؤولية : الشركات المذكورة أعلاه ليست مرتبة بأي ترتيب معين.
- احصل على نظرة عامة على أهم اللاعبين الرئيسيين في سوق التشفير
أخبار سوق أجهزة التشفير والتطورات الأخيرة
يتم تقييم سوق أجهزة الترميز من خلال جمع البيانات النوعية والكمية بعد البحث الأولي والثانوي، والذي يتضمن منشورات الشركات المهمة وبيانات الجمعيات وقواعد البيانات. فيما يلي بعض التطورات في سوق أجهزة الترميز:
- تهدف شركة OMRON Automation، وهي شركة رائدة في تقديم حلول الأتمتة الصناعية المتقدمة في الهند، إلى تعزيز استراتيجيتها التجارية التي تركز على i-Belt، وهي خدمة حلول الإبداع المشترك القائمة على البيانات. تشتهر شركة OMRON بمجموعتها الواسعة من الحلول التي تشمل أجهزة الاستشعار الذكية والروبوتات والرؤية وسلامة الآلات وأجهزة التحكم المنطقية القابلة للبرمجة والمحركات، وهي على استعداد لإثراء مجموعة حلولها الشاملة من خلال التكامل مع خدمة i-Belt القائمة على البيانات. (المصدر: OMRON، بيان صحفي، أغسطس 2023)
- أعلنت شركة Microchip Technology Inc. عن مبادرة متعددة السنوات تزيد عن 300 مليون دولار أمريكي لتوسيع وجودها في الهند. من خلال هذا الاستثمار، تهدف الشركة إلى إنشاء مراكز أبحاث أشباه الموصلات وتصميم الرقائق وهندسة المعدات في البلاد. في نفس الشهر، افتتحت شركة Microchip Technology Inc. مركزًا للبحث والتطوير في حيدر أباد. وفقًا للشركة، من المرجح أن يصل سوق أشباه الموصلات في الهند إلى 64 مليار دولار أمريكي بحلول عام 2026 من 22.7 مليار دولار أمريكي في عام 2019. (المصدر: Microchip Technology Inc.، بيان صحفي، يوليو 2024)
تغطية تقرير سوق أجهزة التشفير والمنتجات النهائية
يوفر تقرير "حجم سوق أجهزة التشفير والتوقعات (2021-2031)" تحليلاً مفصلاً للسوق يغطي المجالات التالية:
- حجم سوق الترميز والتوقعات على المستويات العالمية والإقليمية والوطنية لجميع قطاعات السوق الرئيسية التي يغطيها النطاق
- اتجاهات سوق أجهزة التشفير، بالإضافة إلى ديناميكيات السوق مثل المحركات والقيود والفرص الرئيسية
- تحليل مفصل لـ PEST و SWOT
- تحليل سوق أجهزة التشفير يغطي اتجاهات السوق الرئيسية والإطار العالمي والإقليمي والجهات الفاعلة الرئيسية واللوائح والتطورات الأخيرة في السوق
- تحليل المشهد الصناعي والمنافسة الذي يغطي تركيز السوق، وتحليل خريطة الحرارة، واللاعبين البارزين، والتطورات الأخيرة لسوق الترميز
- ملفات تعريف الشركة التفصيلية

نافين خبيرٌ متمرسٌ في أبحاث السوق والاستشارات، يتمتع بخبرةٍ تزيد عن 9 سنوات في مشاريع مُخصصة ومُشتركة واستشارية. يشغل حاليًا منصب نائب الرئيس المساعد، وقد نجح في إدارة أصحاب المصلحة عبر سلسلة قيمة المشاريع، وألّف أكثر من 100 تقرير بحثي وأكثر من 30 مهمة استشارية. يمتد نطاق عمله ليشمل مشاريع صناعية وحكومية، مساهمًا بشكل كبير في نجاح العملاء واتخاذ القرارات القائمة على البيانات.
نافين حاصلٌ على شهادة في هندسة الإلكترونيات والاتصالات من جامعة فرجينيا التقنية، كارناتاكا، وشهادة ماجستير في إدارة الأعمال في التسويق والعمليات من جامعة مانيبال. وهو عضوٌ نشطٌ في معهد مهندسي الكهرباء والإلكترونيات (IEEE) لمدة 9 سنوات، حيث شارك في مؤتمراتٍ وندواتٍ تقنية، وتطوّع على مستوى الأقسام والمناطق. قبل منصبه الحالي، عمل مستشارًا استراتيجيًا مساعدًا في IndustryARC، ومستشارًا للخوادم الصناعية في شركة هيوليت باكارد (HP Global).
- التحليل التاريخي (سنتان)، سنة الأساس، التوقعات (7 سنوات) مع معدل النمو السنوي المركب
- تحليل PEST و SWOT
- حجم السوق والقيمة / الحجم - عالمي، إقليمي، بلد
- الصناعة والمنافسة
- مجموعة بيانات إكسل
التقارير الحديثة
شهادات العملاء
تقرير سوق أنظمة SCADA من Insight Partners شامل، ويقدم رؤى قيّمة حول الاتجاهات الحالية والتوقعات المستقبلية. تميّز الفريق باحترافية عالية وسرعة في الاستجابة ودعم مستمر طوال الوقت. نحن راضون جدًا ونوصي بشدة بخدماتهم.
ران كيديم شريك, شركة ريالي تكنولوجيز المحدودةطلبتُ تقريرًا عن سوق برمجيات محدد، وأعدّه الفريق في غضون أيام قليلة. كانت المعلومات ذات صلة وثيقة وعرضها جيد. ثم طلبتُ بعض التعديلات والإضافات على التقرير. وكان الفريق متجاوبًا للغاية، وحصلتُ على التقرير النهائي في أقل من أسبوع.
جان هيرفيه جين رئيس مجلس الإدارة, فيوتشر أناليتيكاعملنا مع شركة "إنسايت بارتنرز" لإجراء دراسة سوقية وتوقعات مهمة. زودونا برؤى واضحة حول الفرص والمخاطر، مما ساعدنا في صياغة خططنا. كانت أبحاثهم سهلة الاستخدام ومبنية على بيانات دقيقة، مما ساعدنا على اتخاذ قرارات ذكية وواثقة. نوصي بهم بشدة.
بيوش ناجبال نائب الرئيس الأول, شعاع عالي عالميقدّمت شركة Insight Partners أبحاثًا سوقية ثاقبة ومنظمة جيدًا بخبرة واسعة في هذا المجال. تميّز فريقهم بالاحترافية وسرعة الاستجابة طوال الوقت. وسهّل موقعهم الإلكتروني سهل الاستخدام الوصول إلى تقارير القطاع. نوصي بهم بشدة لخدمات بحثية موثوقة وعالية الجودة.
يوكيهيكو أداتشي المدير التنفيذي, ديب بلو، ذ.م.م.هذه أول مرة أشتري فيها تقرير سوق من The Insight Partners. رغم أنني كنت مترددًا في البداية، إلا أنني زرت موقعهم الإلكتروني وشعرت براحة أكبر للمخاطرة وشراء تقرير السوق. أنا راضٍ تمامًا عن جودة التقرير وخدمة العملاء. كانت لديّ عدة أسئلة وتعليقات حول التقرير الأولي، ولكن بعد بضع محادثات عبر البريد الإلكتروني مع محللهم، أعتقد أن لديّ تقريرًا يمكنني استخدامه كمدخل لعملية التخطيط الاستراتيجي لدينا. شكرًا جزيلاً لكم على تخصيص وقتكم الإضافي وجعل هذه التجربة إيجابية. سأوصي بخدماتكم للآخرين بالتأكيد، وستكونون أول من ألجأ إليه عندما نحتاج إلى المزيد من بيانات السوق.
جون سوزوكي الرئيس والرئيس التنفيذي وعضو مجلس الإدارة, بي كيه تكنولوجيزأود أن أقدّر دعمكم واحترافيتكم في الاستجابة لطلبي للحصول على معلومات بشأن سوق التشخيص المخبري للأمراض المعدية في نيجيريا. كما أُقدّر صبركم وتوجيهكم، واستعدادكم لتقديم خصم، مما مكّننا في النهاية من إتمام الصفقة. أتطلع إلى التعامل مع "ذا إنسايت بارتنرز" مستقبلًا، كل ذلك بفضل الانطباع الذي تركتموه لديّ نتيجةً لهذا اللقاء الأول.
الدكتور تشيجيوك أونيا المدير الإداري, شركة باينكريست للرعاية الصحية المحدودةسبب الشراء
- اتخاذ قرارات مدروسة
- فهم ديناميكيات السوق
- تحليل المنافسة
- رؤى العملاء
- توقعات السوق
- تخفيف المخاطر
- التخطيط الاستراتيجي
- مبررات الاستثمار
- تحديد الأسواق الناشئة
- تحسين استراتيجيات التسويق
- تعزيز الكفاءة التشغيلية
- مواكبة التوجهات التنظيمية


 احصل على عينة مجانية ل - سوق التشفير