Marktanalyse und Prognose für Diagrammerstellungssoftware nach Größe, Anteil, Wachstum, Trends 2031
Historische Daten : 2021-2022 | Basisjahr : 2023 | Prognosezeitraum : 2024-2031Marktgröße und Prognose für Diagrammsoftware (2021 – 2031), Bericht über globale und regionale Anteile, Trends und Wachstumschancenanalysen: Nach Bereitstellungstyp (Cloud und vor Ort), Unternehmensgröße (kleine und mittlere Unternehmen sowie große Unternehmen), Anwendung (Bildungseinrichtungen, Unternehmen und Privatpersonen) und Geografie
- Status : Veröffentlichte Daten
- Berichtscode : TIPRE00011177
- Kategorie : Technologie, Medien und Telekommunikation
- Anzahl der Seiten : 150
- Verfügbare Berichtsformate :


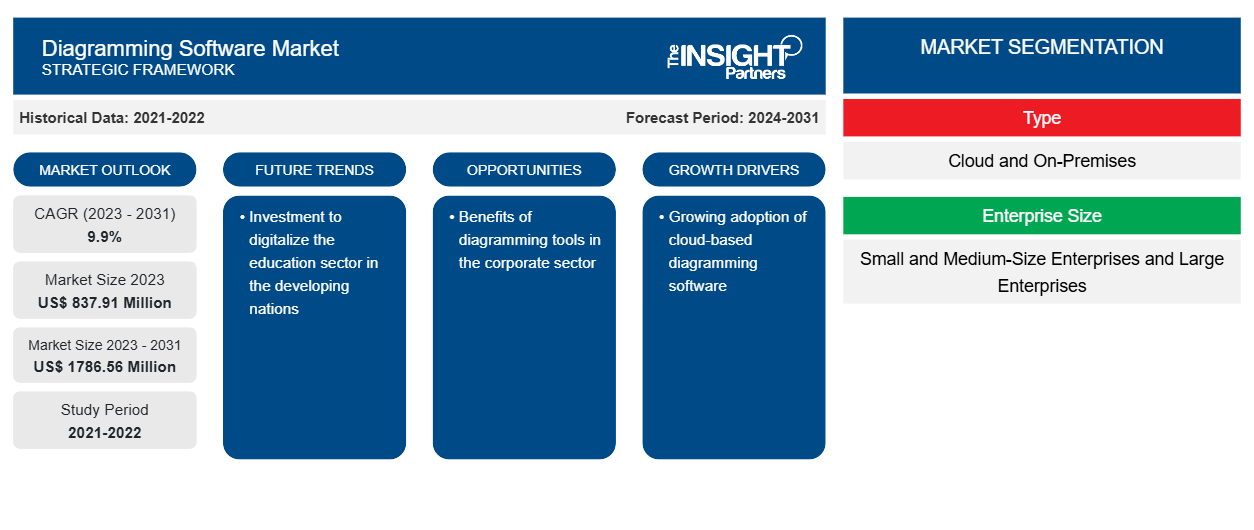
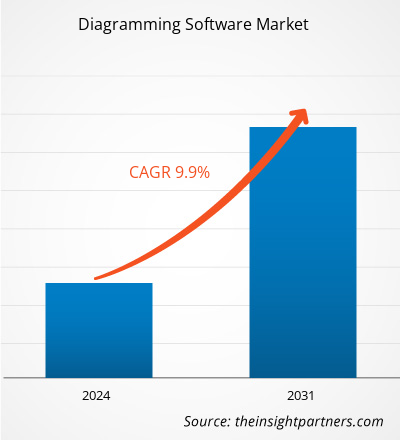
Der Markt für Diagrammerstellungssoftware soll von 837,91 Millionen US-Dollar im Jahr 2023 auf 1786,56 Millionen US-Dollar im Jahr 2031 anwachsen. Der Markt wird zwischen 2023 und 2031 voraussichtlich eine durchschnittliche jährliche Wachstumsrate von 9,9 % verzeichnen. Die zunehmende Digitalisierung und die zunehmende Nutzung cloudbasierter Diagrammerstellungssoftware dürften weiterhin wichtige Trends auf dem Markt bleiben.
Marktanalyse für Diagrammerstellungssoftware
Der Markt für Diagrammerstellungssoftware gewinnt an Bedeutung, da sie zunehmend von großen und kleinen bis mittelgroßen Unternehmen genutzt wird. Die Einführung dieser Software hilft ihnen, den Arbeitsablauf und die Abläufe in der Geschäftsumgebung besser zu definieren . Verschiedene Abteilungen des Unternehmens wie Marketing, Personalwesen, Technik und Betrieb können sie umfassend nutzen.
Marktübersicht für Diagrammerstellungssoftware
Mithilfe von Diagrammerstellungssoftware kann der Benutzer detaillierte Diagramme erstellen, darunter Flussdiagramme, Kreisdiagramme, Grundrisse und andere Diagramme, basierend auf den Datensätzen und Bildern. Diagrammerstellungssoftware enthält verschiedene Vorlagen, die dem Benutzer helfen, das Diagramm von Grund auf neu zu erstellen. Diese Software lässt sich problemlos in andere Tools und Plattformen integrieren, sodass mehrere Benutzer das Diagramm anzeigen und zur Erstellung beitragen können.
Passen Sie diesen Bericht Ihren Anforderungen an
Sie erhalten kostenlose Anpassungen an jedem Bericht, einschließlich Teilen dieses Berichts oder einer Analyse auf Länderebene, eines Excel-Datenpakets sowie tolle Angebote und Rabatte für Start-ups und Universitäten.
Markt für Diagrammerstellungssoftware: Strategische Einblicke
-
Holen Sie sich die wichtigsten Markttrends aus diesem Bericht.Dieses KOSTENLOSE Beispiel umfasst eine Datenanalyse von Markttrends bis hin zu Schätzungen und Prognosen.
Treiber und Chancen auf dem Markt für Diagrammerstellungssoftware
Vorteile von Diagrammtools im Unternehmenssektor
Diagramme helfen, die Komplexität der Kommunikation zu reduzieren. Im Geschäftsumfeld bieten Diagramme eine klare und prägnante visuelle Darstellung von Geschäftsprozessen. Sie helfen allen Mitarbeitern, die Ziele und Prozesse zu verstehen, die bei der Projektumsetzung befolgt werden müssen. Mit dem Einsatz von Diagrammtools können Teamleiter oder Projektmanager ihren Mitarbeitern den Projektablauf anhand eines Diagramms erläutern. Mithilfe von Diagrammsoftware können sie Kreisdiagramme, Flussdiagramme und verschiedene andere Diagrammvorlagen erstellen. Die visuelle Darstellung des Projekts oder der Geschäftsziele hilft den Mitarbeitern, die Trends und den Umfang des Projekts besser zu verstehen. Daher setzen Unternehmen häufig Diagrammsoftware ein.
Einführung cloudbasierter Software
Aufgrund der zunehmenden Industrialisierung und Globalisierungsinitiativen in Industrie- und Entwicklungsländern nehmen die Geschäftsaktivitäten in allen Branchen zu. Darüber hinaus wurde beobachtet, dass Unternehmen die digitale Transformation nutzen, um einen Wettbewerbsvorteil zu erzielen und ihre Produktivität zu maximieren. Dafür suchen die Unternehmen nach einer kostengünstigen Lösung, was zur Einführung der Cloud-basierten Diagrammerstellungssoftwarelösung führt.
Segmentierungsanalyse des Marktberichts zur Diagrammerstellungssoftware
Wichtige Segmente, die zur Ableitung der Marktanalyse für Diagrammerstellungssoftware beigetragen haben, sind Bereitstellungstyp, Unternehmensgröße und Anwendung.
- Basierend auf der Bereitstellungsart ist der Markt für Diagrammerstellungssoftware in Cloud und On-Premise unterteilt. Das On-Premise-Segment hatte im Jahr 2023 den größten Marktanteil.
- Nach Unternehmensgröße ist der Markt in kleine und mittlere Unternehmen sowie in große Unternehmen segmentiert. Das Segment der kleinen und mittleren Unternehmen wird voraussichtlich mit der höchsten durchschnittlichen jährlichen Wachstumsrate wachsen.CAGR.
- Nach Unternehmensgröße ist der Markt in Bildungseinrichtungen, Unternehmen und Personal segmentiert. Das Segment der Bildungseinrichtungen hielt im Jahr 2023 einen bedeutenden Marktanteil.corporates, and personnel. The educational institutions segment held a significant share of the market in 2023.
Diagrammerstellungssoftware Marktanteilsanalyse nach Geografie
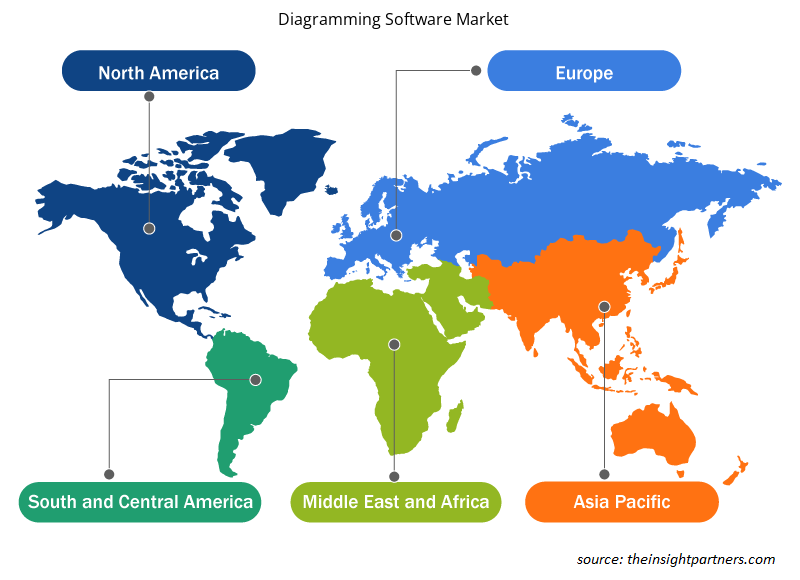
Der geografische Umfang des Marktberichts für Diagrammerstellungssoftware ist hauptsächlich in fünf Regionen unterteilt: Nordamerika, Asien-Pazifik, Europa, Naher Osten und Afrika sowie Süd- und Mittelamerika.
Der asiatisch-pazifische Raum hatte den größten Marktanteil und wird voraussichtlich mit der höchsten durchschnittlichen jährlichen Wachstumsrate wachsen. Länder wie Indien, Japan und China halten den größten Marktanteil im asiatisch-pazifischen Raum. Die zunehmende Digitalisierung ist einer der Hauptfaktoren, die zur Einführung digitaler Lösungen führen. Wachsende E-Learning-Plattformen und wachsende KMU in Entwicklungsländern treiben die Einführung von Diagrammerstellungssoftwarelösungen voran.CAGR. Countries such as India, Japan, and China hold the majority of the Asia-Pacific market share. The growing digitalization is one of the major factors leading to the adoption of digital solutions. Growing e-learning platforms and growing SMEs in developing nations are driving the adoption of diagramming software solutions.
Regionale Einblicke in den Markt für Diagrammerstellungssoftware
Die regionalen Trends und Faktoren, die den Markt für Diagrammerstellungssoftware während des Prognosezeitraums beeinflussen, wurden von den Analysten von Insight Partners ausführlich erläutert. In diesem Abschnitt werden auch die Marktsegmente und die Geografie von Diagrammerstellungssoftware in Nordamerika, Europa, im asiatisch-pazifischen Raum, im Nahen Osten und Afrika sowie in Süd- und Mittelamerika erörtert.
- Erhalten Sie regionale Daten zum Markt für Diagrammerstellungssoftware
Umfang des Marktberichts zur Diagrammerstellungssoftware
| Berichtsattribut | Details |
|---|---|
| Marktgröße im Jahr 2023 | 837,91 Millionen US-Dollar |
| Marktgröße bis 2031 | 1786,56 Millionen US-Dollar |
| Globale CAGR (2023 - 2031) | 9,9 % |
| Historische Daten | 2021-2022 |
| Prognosezeitraum | 2024–2031 |
| Abgedeckte Segmente |
Nach Typ
|
| Abgedeckte Regionen und Länder |
Nordamerika
|
| Marktführer und wichtige Unternehmensprofile |
|
Dichte der Marktteilnehmer für Diagrammerstellungssoftware: Die Auswirkungen auf die Geschäftsdynamik verstehen
Der Markt für Diagrammerstellungssoftware wächst rasant, angetrieben durch die steigende Nachfrage der Endnutzer aufgrund von Faktoren wie sich entwickelnden Verbraucherpräferenzen, technologischen Fortschritten und einem größeren Bewusstsein für die Vorteile des Produkts. Mit steigender Nachfrage erweitern Unternehmen ihr Angebot, entwickeln Innovationen, um die Bedürfnisse der Verbraucher zu erfüllen, und nutzen neue Trends, was das Marktwachstum weiter ankurbelt.
Die Marktteilnehmerdichte bezieht sich auf die Verteilung von Firmen oder Unternehmen, die in einem bestimmten Markt oder einer bestimmten Branche tätig sind. Sie gibt an, wie viele Wettbewerber (Marktteilnehmer) in einem bestimmten Marktraum im Verhältnis zu seiner Größe oder seinem gesamten Marktwert präsent sind.
Die wichtigsten auf dem Markt für Diagrammerstellungssoftware tätigen Unternehmen sind:
- Kreativ
- zeichnen.io
- Gliffy von Perforce
- Edrawsoft
- Lucidchart
- Microsoft
Haftungsausschluss : Die oben aufgeführten Unternehmen sind nicht in einer bestimmten Reihenfolge aufgeführt.
- Überblick über die wichtigsten Akteure auf dem Markt für Diagrammerstellungssoftware
Neuigkeiten und aktuelle Entwicklungen zum Markt für Diagrammerstellungssoftware
Der Markt für Diagrammerstellungssoftware wird durch die Erfassung qualitativer und quantitativer Daten nach Primär- und Sekundärforschung bewertet, die wichtige Unternehmensveröffentlichungen, Verbandsdaten und Datenbanken umfasst. Nachfolgend sind einige der Entwicklungen auf dem Markt für Diagrammerstellungssoftware aufgeführt:
- Google hat das brandneue Google Cloud Architecture Diagramming Tool eingeführt. Mit diesem Tool kann der Benutzer die Vision mit dem Team teilen, mit ihnen zusammenarbeiten, das Design iterieren und die endgültige Version erstellen, die den Anforderungen für den Geschäftsanwendungsfall am besten entspricht. (Quelle: Google, Pressemitteilung, Februar 2022)
- EdrawMax, eine führende Diagrammerstellungssoftware, hat seine mobile Version, die EdrawMax App, herausgebracht, mit der Benutzer mühelos professionelle Flussdiagramme und Blockdiagramme erstellen können. Die neue App steigert die Produktivität und spart den Benutzern Zeit. Sie bietet über 20.000 hochwertige Diagrammvorlagen, die Benutzer anpassen und ändern können, um professionell aussehende Diagramme zu erstellen. (Quelle: PRNewswire, Pressemitteilung, April 2023)
Marktbericht zu Diagrammerstellungssoftware – Umfang und Ergebnisse
Der Bericht „Marktgröße und Prognose für Diagrammerstellungssoftware (2021–2031)“ bietet eine detaillierte Analyse des Marktes, die die folgenden Bereiche abdeckt:
- Diagrammerstellungssoftware-Marktgröße und -prognose auf globaler, regionaler und Länderebene für alle wichtigen Marktsegmente, die im Rahmen des Projekts abgedeckt sind
- Diagrammerstellung von Softwaremarkttrends sowie Marktdynamiken wie Treibern, Einschränkungen und wichtigen Chancen
- Detaillierte PEST/Porters Five Forces- und SWOT-Analyse
- Marktanalyse für Diagrammerstellungssoftware mit Blick auf wichtige Markttrends, globale und regionale Rahmenbedingungen, wichtige Akteure, Vorschriften und aktuelle Marktentwicklungen
- Branchenlandschaft und Wettbewerbsanalyse, die die Marktkonzentration, Heatmap-Analyse, prominente Akteure und aktuelle Entwicklungen für den Markt für Diagrammerstellungssoftware umfasst
- Detaillierte Firmenprofile

Ankita ist eine dynamische Marktforschungs- und Beratungsexpertin mit über 8 Jahren Erfahrung in den Bereichen Technologie, Medien, IKT sowie Elektronik und Halbleiter. Sie hat über 100 Beratungs- und Forschungsaufträge für globale Kunden wie Microsoft, Oracle, NEC Corporation, SAP, KPMG und Expeditors International erfolgreich geleitet und durchgeführt. Zu ihren Kernkompetenzen gehören Marktbewertung, Datenanalyse, Prognose, Strategieformulierung, Wettbewerbsbeobachtung und das Verfassen von Berichten. Ankita ist versiert in der Abwicklung kompletter Projektzyklen – von der Angebotserstellung vor dem Verkauf und Kundengesprächen bis hin zur Bereitstellung umsetzbarer Erkenntnisse nach dem Verkauf. Sie ist versiert in der Leitung funktionsübergreifender Teams, der Strukturierung komplexer Forschungsmodule und der Ausrichtung von Lösungen an kundenspezifischen Geschäftszielen. Ihre ausgezeichneten Kommunikationsfähigkeiten, Führungsqualitäten und Präsentationsfähigkeiten haben es ihr ermöglicht, in einem schnelllebigen und sich entwickelnden Marktumfeld stets wertorientierte Ergebnisse zu liefern.
- Historische Analyse (2 Jahre), Basisjahr, Prognose (7 Jahre) mit CAGR
- PEST- und SWOT-Analyse
- Marktgröße Wert/Volumen – Global, Regional, Land
- Branchen- und Wettbewerbslandschaft
- Excel-Datensatz
Erfahrungsberichte
Der SCADA-Systemmarktbericht von Insight Partners ist umfassend und bietet wertvolle Einblicke in aktuelle Trends und Zukunftsprognosen. Das Team war durchweg hochprofessionell, reaktionsschnell und hilfsbereit. Wir sind sehr zufrieden und können die Dienstleistungen wärmstens empfehlen.
RAN KEDEM Partner, Reali Technologies LTDsIch habe einen Bericht über einen sehr spezifischen Softwaremarkt angefordert, und das Team hat ihn innerhalb weniger Tage erstellt. Die Informationen waren sehr relevant und gut präsentiert. Anschließend habe ich einige Änderungen und Ergänzungen zum Bericht angefordert. Das Team reagierte erneut sehr schnell, und ich erhielt den Abschlussbericht in weniger als einer Woche.
JEAN-HERVE JENN Vorsitzende, Future AnalyticaWir haben mit The Insight Partners für eine wichtige Marktstudie und Prognose zusammengearbeitet. Sie gaben uns klare Einblicke in Chancen und Risiken, die uns bei der Gestaltung unserer Pläne halfen. Ihre Recherchen waren benutzerfreundlich und basierten auf soliden Daten. Sie halfen uns, kluge und sichere Entscheidungen zu treffen. Wir können sie wärmstens empfehlen.
PIYUSH NAGPAL Sr. Vizepräsident, Fernlicht GlobalDie Insight Partners lieferten aufschlussreiche, gut strukturierte Marktforschung mit fundierter Fachkompetenz. Ihr Team war durchweg professionell und reaktionsschnell. Die benutzerfreundliche Website ermöglichte den Zugriff auf Branchenberichte. Wir empfehlen sie wärmstens für zuverlässige und hochwertige Forschungsdienstleistungen.
YUKIHIKO ADACHI Geschäftsführer, Deep Blue, LLC.Dies ist das erste Mal, dass ich einen Marktbericht von The Insight Partners erworben habe. Obwohl ich zunächst unsicher war, besuchte ich die Website und fühlte mich dann sicherer, das Risiko einzugehen und einen Marktbericht zu kaufen. Ich bin mit der Qualität des Berichts und dem Kundenservice rundum zufrieden. Ich hatte einige Fragen und Anmerkungen zum ersten Bericht, aber nach einigen E-Mail-Gesprächen mit dem Analysten bin ich überzeugt, dass ich einen Bericht habe, den ich als Input für unseren strategischen Planungsprozess verwenden kann. Vielen Dank, dass Sie sich die Zeit genommen und dies zu einer positiven Erfahrung gemacht haben. Ich werde Ihren Service auf jeden Fall weiterempfehlen und Sie werden meine erste Anlaufstelle sein, wenn wir weitere Marktdaten benötigen.
JOHN SUZUKI Präsident und Chief Executive Officer, Vorstandsmitglied, BK TechnologiesIch möchte mich für Ihre Unterstützung und die Professionalität bedanken, die Sie bei der Bearbeitung meiner Informationsanfrage zum IVD-Markt für Infektionskrankheiten in Nigeria gezeigt haben. Ich schätze Ihre Geduld, Ihre Beratung und die Tatsache, dass Sie bereit waren, einen Rabatt anzubieten, der uns schließlich den Abschluss eines Geschäfts ermöglichte. Ich freue mich darauf, The Insight Partners in Zukunft wieder zu beauftragen, dank des Eindrucks, den Sie bei dieser ersten Begegnung bei mir hinterlassen haben.
DR. CHIJIOKE ONYIA GESCHÄFTSFÜHRERIN, PineCrest Healthcare Ltd.Grund zum Kauf
- Fundierte Entscheidungsfindung
- Marktdynamik verstehen
- Wettbewerbsanalyse
- Kundeneinblicke
- Marktprognosen
- Risikominimierung
- Strategische Planung
- Investitionsbegründung
- Identifizierung neuer Märkte
- Verbesserung von Marketingstrategien
- Steigerung der Betriebseffizienz
- Anpassung an regulatorische Trends


Exklusive Berichtsrabatte freischalten
Jetzt anfragen


 Kostenlose Probe anfordern für - Markt für Diagrammsoftware