
Panoramica del mercato, crescita, tendenze, analisi, modellazione 3D del mercato (2021-2031)
Rapporto di analisi sulle dimensioni e le previsioni del mercato della mappatura e modellazione 3D (2021-2031), quota globale e regionale, tendenze e opportunità di crescita. Copertura: per modalità di distribuzione (cloud e on-premise), dimensioni dell'organizzazione (PMI e grandi imprese), componente (strumenti e servizi software), applicazione di mappatura 3D (ispezione e misurazione, ricostruzione di oggetti, proiezione e navigazione, reporting e virtualizzazione e altre applicazioni di mappatura 3D), applicazione di modellazione 3D (marketing di prodotto, animazione e film, giochi e progettazione, rendering architettonico e altre applicazioni di modellazione 3D) e verticale (vendita al dettaglio e beni di consumo, ingegneria e costruzioni, sanità e scienze della vita, trasporti e logistica, governo e difesa, energia e servizi di pubblica utilità, media e intrattenimento, produzione e altre verticali) e per area geografica.
- Stato : Dati rilasciati
- Codice del report : TIPTE100000786
- Categoria : Tecnologia, media e telecomunicazioni
- Numero di pagine : 150
- Formati di report disponibili :


- Data dell'ultimo aggiornamento : February 15, 2025

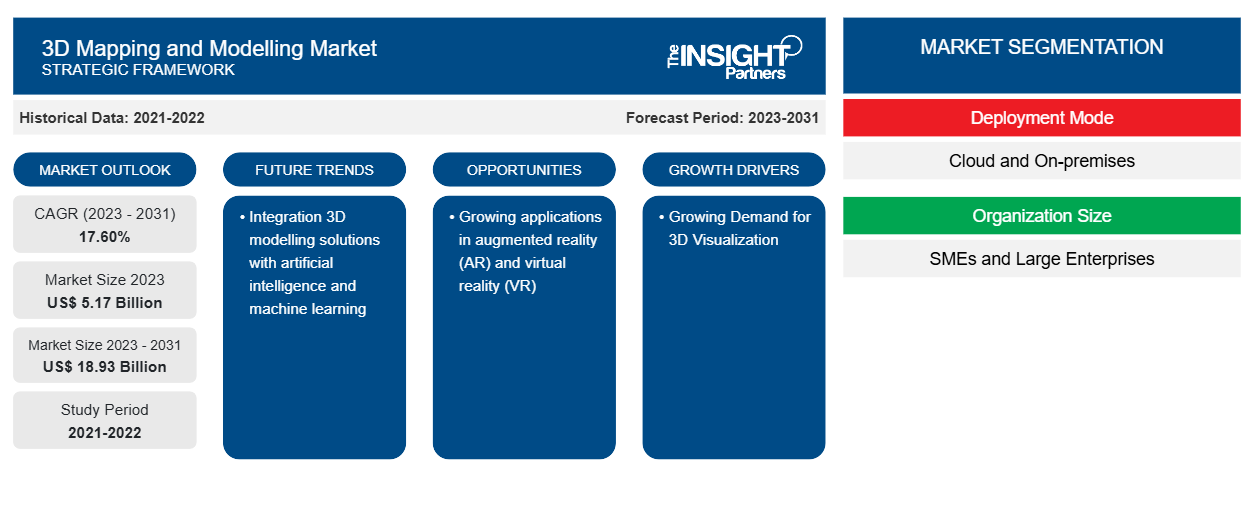
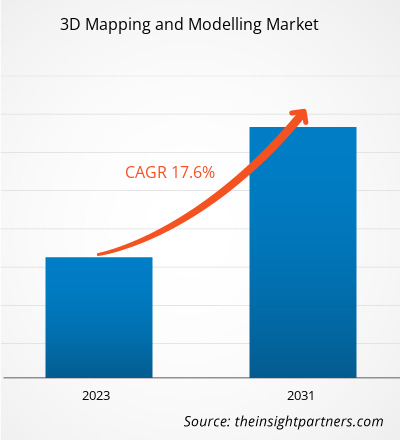
Si prevede che la dimensione del mercato della mappatura e della modellazione 3D raggiungerà i 18,93 miliardi di dollari entro il 2031, rispetto ai 5,17 miliardi di dollari del 2023. Si prevede che il mercato registrerà un CAGR del 17,60% nel periodo 2023-2031. È probabile che l'integrazione di soluzioni di modellazione 3D con intelligenza artificiale e apprendimento automatico rimanga una tendenza chiave nel mercato.
Analisi di mercato della mappatura e modellazione 3D
La crescente necessità di animazione 3D, gli sviluppi tecnici nelle apparecchiature di scansione 3D, l'impennata della domanda di contenuti 3D e un aumento dei dispositivi di visualizzazione 3D sono alcuni dei principali fattori trainanti del mercato mondiale della mappatura e della modellazione 3D. Inoltre, il crescente utilizzo e l'integrazione di tecnologie come l'intelligenza artificiale e l'apprendimento automatico nei software di mappatura e modellazione 3D per migliorare l'accuratezza dei contenuti 3D stanno alimentando l'espansione del mercato. Si prevede che tutte queste ragioni forniranno sufficienti possibilità di sviluppo per i partecipanti al mercato durante il periodo di previsione.
Panoramica del mercato della mappatura e della modellazione 3D
Le piattaforme di mappatura e modellazione 3D consentono agli utenti di creare modelli e mappe tridimensionali di base di elementi e posizioni. Queste tecnologie aiutano anche nella visualizzazione , nell'interrogazione, nell'analisi e nell'interpretazione di dati geografici/di posizione, consentendo agli utenti di cogliere i collegamenti, i modelli e le tendenze tra vari fattori al fine di risolvere le sfide aziendali del mondo reale. Aziende e individui in tutto il mondo utilizzano tecnologie di mappatura e modellazione 3D per migliorare le operazioni, aumentare l'efficienza e massimizzare l'utilizzo delle risorse identificando aree problematiche ed elementi che richiedono cambiamenti. Questi strumenti sono comunemente utilizzati in aziende incentrate sul territorio come ingegneria e costruzione, produzione, trasporti e logistica e molte altre per applicazioni di gestione dei servizi sul campo, gestione dei piani, gestione delle risorse e gestione dell'inventario. Gli strumenti 3D sono utilizzati anche per applicazioni di progettazione di edilizia/architettura e ingegneria civile. Lidar, sonar, radar e fotogrammetria sono alcune delle tecniche di mappatura 3D più comuni e la modellazione 3D può comprendere la modellazione wireframe, di superficie e solida.
Personalizza questo report in base alle tue esigenze
Riceverai la personalizzazione gratuita di qualsiasi report, comprese parti di questo report, o analisi a livello nazionale, pacchetto dati Excel, oltre a usufruire di grandi offerte e sconti per start-up e università
Mercato della mappatura e della modellazione 3D: approfondimenti strategici
-
Scopri le principali tendenze di mercato in questo rapporto.Questo campione GRATUITO includerà analisi di dati che spaziano dalle tendenze di mercato alle stime e alle previsioni.
Driver e opportunità di mercato per la mappatura e la modellazione 3D
La crescente domanda di visualizzazione 3D favorisce il mercato
C'è una crescente necessità di visualizzazione 3D in diversi settori. L'uso della tecnologia degli effetti visivi (VFX) nei film, l'uso di app mobili e giochi 3D e la tendenza crescente del marketing digitale stanno tutti contribuendo alla crescita del mercato della mappatura e della modellazione 3D. Ad esempio, il settore dei giochi utilizza la visualizzazione 3D per creare esperienze immersive utilizzando materiali di gioco, personaggi e luoghi 3D. I settori del marketing e della vendita al dettaglio utilizzano la visualizzazione 3D per la prototipazione, lo sviluppo di elementi visivi per campagne e il miglioramento delle esperienze dei consumatori. Inoltre, la visualizzazione 3D è essenziale nell'assistenza sanitaria per applicazioni tra cui imaging medico , pianificazione chirurgica e istruzione dei pazienti.VFX) in films, the usage of 3D mobile apps and gaming, and the rising trend of digital marketing are all contributing to the growth of the 3D mapping and modelling market. For instance, the gaming business uses 3D visualization to create immersive experiences using 3D game materials, characters, and locations. The marketing and retail industries employ 3D visualization for prototyping, developing visuals for campaigns, and improving consumer experiences. Moreover, 3D visualization is essential in healthcare for applications including
Crescenti applicazioni nella realtà aumentata (AR) e nella realtà virtuale (VR)
Le tecnologie di Realtà Aumentata (AR) e Realtà Virtuale (VR) si stanno espandendo rapidamente e vengono implementate in una varietà di settori. Queste tecnologie utilizzano modelli 3D per creare esperienze digitali immersive che cambiano il modo in cui gli utenti interagiscono con il mondo che li circonda. AR facilita il mondo reale incorporando componenti digitali come foto, video e testo in ambienti fisici. Consente la sovrapposizione di informazioni digitali su cose del mondo reale, migliorando la nostra percezione e conoscenza dell'ambiente. VR, d'altro canto, crea esperienze completamente virtuali trasferendo gli utenti in ambienti creati digitalmente. Sviluppa simulazioni immersive che possono essere utilizzate per l'insegnamento, l'intrattenimento e altri scopi.
Analisi della segmentazione del rapporto di mercato sulla mappatura e la modellazione 3D
I segmenti chiave che hanno contribuito alla derivazione dell'analisi di mercato della mappatura e della modellazione 3D sono la modalità di distribuzione, la dimensione dell'organizzazione, il componente, l'applicazione di mappatura 3D, l'applicazione di modellazione 3D e il settore verticale.
- In base alla modalità di distribuzione, il mercato è segmentato in cloud e on-premise. Il segmento on-premise ha dominato la quota di mercato nel 2023.
- In base alle dimensioni dell'organizzazione, il mercato è segmentato in PMI e grandi imprese. Il segmento delle grandi imprese deteneva la quota maggiore del mercato nel 2023.
- In base al componente, il mercato è segmentato in strumenti software e servizi. Il segmento degli strumenti software ha detenuto la quota maggiore del mercato nel 2023.
- In base all'applicazione di mappatura 3D, il mercato è segmentato in ispezione e misurazione, ricostruzione di oggetti, proiezione e navigazione, reporting e virtualizzazione e altre applicazioni di mappatura 3D. Il segmento di ispezione e misurazione ha detenuto la quota maggiore del mercato nel 2023.
- In base all'applicazione di modellazione 3D, il mercato è segmentato in marketing di prodotto, animazione e film, giochi e progettazione, rendering architettonico e altre applicazioni di modellazione 3D. Il segmento di marketing di prodotto ha detenuto la quota maggiore del mercato nel 2023.
- In base al verticale, il mercato è segmentato in vendita al dettaglio e beni di consumo, ingegneria e costruzioni, sanità e scienze della vita, trasporti e logistica, governo e difesa, energia e servizi di pubblica utilità, media e intrattenimento, produzione e altri verticali. Il segmento di ingegneria e costruzioni ha detenuto la quota maggiore del mercato nel 2023.
Analisi della quota di mercato della mappatura e della modellazione 3D per area geografica
L'ambito geografico del rapporto di mercato sulla mappatura e la modellazione 3D è suddiviso principalmente in cinque regioni: Nord America, Asia Pacifico, Europa, Medio Oriente e Africa, e Sud e Centro America.
Il Nord America ha dominato il mercato della mappatura e modellazione 3D nel 2023. Questa supremazia può essere attribuita allo sviluppo dell'ecosistema di aziende tecnologiche della regione. Edilizia, pianificazione urbana e auto senza conducente traggono tutti vantaggio dall'uso della tecnologia di mappatura e modellazione 3D. Inoltre, il Nord America ospita aziende chiave nella mappatura e modellazione 3D, tra cui Autodesk, Trimble, Inc. e Bentley Systems, tra le altre. L'esistenza di queste aziende, insieme alla loro esperienza e risorse, si aggiunge alla supremazia di mercato della regione.
Approfondimenti regionali sul mercato della mappatura e della modellazione 3D
Le tendenze regionali e i fattori che influenzano il mercato della mappatura e modellazione 3D durante il periodo di previsione sono stati ampiamente spiegati dagli analisti di Insight Partners. Questa sezione discute anche i segmenti e la geografia del mercato della mappatura e modellazione 3D in Nord America, Europa, Asia Pacifico, Medio Oriente e Africa e America meridionale e centrale.

- Ottieni i dati specifici regionali per il mercato della mappatura e della modellazione 3D
Ambito del rapporto di mercato sulla mappatura e modellazione 3D
| Attributo del report | Dettagli |
|---|---|
| Dimensioni del mercato nel 2023 | 5,17 miliardi di dollari USA |
| Dimensioni del mercato entro il 2031 | 18,93 miliardi di dollari USA |
| CAGR globale (2023-2031) | 17,60% |
| Dati storici | 2021-2022 |
| Periodo di previsione | 2023-2031 |
| Segmenti coperti |
Per modalità di distribuzione
|
| Regioni e Paesi coperti |
America del Nord
|
| Leader di mercato e profili aziendali chiave |
|
Densità degli attori del mercato: comprendere il suo impatto sulle dinamiche aziendali
Il mercato del 3D Mapping and Modelling Market sta crescendo rapidamente, spinto dalla crescente domanda degli utenti finali dovuta a fattori quali l'evoluzione delle preferenze dei consumatori, i progressi tecnologici e una maggiore consapevolezza dei vantaggi del prodotto. Con l'aumento della domanda, le aziende stanno ampliando le loro offerte, innovando per soddisfare le esigenze dei consumatori e capitalizzando sulle tendenze emergenti, il che alimenta ulteriormente la crescita del mercato.
La densità degli operatori di mercato si riferisce alla distribuzione di aziende o società che operano in un particolare mercato o settore. Indica quanti concorrenti (operatori di mercato) sono presenti in un dato spazio di mercato in relazione alle sue dimensioni o al valore di mercato totale.
Le principali aziende che operano nel mercato della mappatura e della modellazione 3D sono:
- Autodesk
- Saab AB
- Software d'oro
- Trimble
- Sistemi Bentley
- Alfabeto
Disclaimer : le aziende elencate sopra non sono classificate secondo un ordine particolare.
- Ottieni una panoramica dei principali attori del mercato della mappatura e della modellazione 3D
Notizie e sviluppi recenti del mercato della mappatura e modellazione 3D
Il mercato della mappatura e modellazione 3D viene valutato raccogliendo dati qualitativi e quantitativi post-ricerca primaria e secondaria, che includono importanti pubblicazioni aziendali, dati associativi e database. Di seguito sono elencati alcuni degli sviluppi nel mercato della mappatura e modellazione 3D:
- Autodesk ha annunciato il Progetto Bernini. Questo nuovo sforzo di ricerca offre il primo modello AI generativo sperimentale che genera rapidamente forme 3D superiori da una varietà di input, tra cui una singola immagine 2D, più immagini che mostrano diverse viste di un oggetto, nuvole di punti, voxel e testo. Il Progetto Bernini è destinato a creare modelli generativi che potrebbero essere utilizzati in diversi campi come architettura, progettazione di prodotti, intrattenimento e altro ancora per generare strutture 3D funzionali che possono essere utilizzate in applicazioni del mondo reale e allineate con la visione del progettista. (Fonte: Autodesk, comunicato stampa, maggio 2024)
- Trimble ha annunciato il sistema di scansione laser 3D Trimble X9, una nuova soluzione versatile di acquisizione della realtà per i professionisti del rilevamento, dell'edilizia e dell'ingegneria. L'X9 è basato sulle comprovate tecnologie di scansione laser di Trimble, progettate per migliorare le prestazioni in più ambienti sfruttando innovazioni come la tecnologia Trimble X-Drive per la calibrazione automatica degli strumenti, l'autolivellamento di livello di rilevamento e il puntatore laser per la georeferenziazione. (Fonte: Trimble, comunicato stampa, giugno 2023)
Copertura e risultati del rapporto di mercato sulla mappatura e la modellazione 3D
Il rapporto "Dimensioni e previsioni del mercato della mappatura e della modellazione 3D (2021-2031)" fornisce un'analisi dettagliata del mercato che copre le seguenti aree:
- Dimensioni e previsioni del mercato della mappatura e della modellazione 3D a livello globale, regionale e nazionale per tutti i segmenti di mercato chiave coperti dall'ambito
- Tendenze del mercato della mappatura e modellazione 3D e dinamiche di mercato come driver, vincoli e opportunità chiave
- Analisi dettagliata delle cinque forze PEST/Porter e SWOT
- Analisi di mercato della mappatura e della modellazione 3D che copre le principali tendenze di mercato, il quadro globale e regionale, i principali attori, le normative e i recenti sviluppi del mercato
- Analisi del panorama industriale e della concorrenza che copre la concentrazione del mercato, l'analisi della mappa di calore, i principali attori e gli sviluppi recenti per il mercato della mappatura e della modellazione 3D
- Profili aziendali dettagliati

Ankita è una dinamica professionista della ricerca di mercato e della consulenza con oltre 8 anni di esperienza nei settori della tecnologia, dei media, dell'ICT, dell'elettronica e dei semiconduttori. Ha guidato e portato a termine con successo oltre 100 incarichi di consulenza e ricerca per clienti globali come Microsoft, Oracle, NEC Corporation, SAP, KPMG ed Expeditors International. Le sue competenze principali includono la valutazione del mercato, l'analisi dei dati, le previsioni, la formulazione di strategie, l'intelligence competitiva e la redazione di report.
Ankita è esperta nella gestione di cicli di progetto completi, dalla progettazione di proposte pre-vendita e discussioni con i clienti fino alla fornitura di insight fruibili post-vendita. È esperta nella gestione di team interfunzionali, nella strutturazione di moduli di ricerca complessi e nell'allineamento delle soluzioni agli obiettivi aziendali specifici del cliente. Le sue eccellenti capacità di comunicazione, leadership e presentazione le hanno permesso di fornire costantemente risultati orientati al valore in contesti di mercato in rapida evoluzione.
- Analisi completa delle dimensioni e delle previsioni di mercato
- Analisi dettagliata della segmentazione
- Valutazione approfondita delle dinamiche di mercato
- Approfondimenti a livello regionale e nazionale
- Analisi del panorama competitivo e benchmarking aziendale
- Business intelligence strategica
Testimonianze
Il report di mercato sui sistemi SCADA di Insight Partners è completo, con preziosi spunti sulle tendenze attuali e sulle previsioni future. Il team si è dimostrato altamente professionale, reattivo e disponibile in ogni fase del progetto. Siamo molto soddisfatti e consigliamo vivamente i loro servizi.
RAN KEDEM Partner, Reali Technologies LTDsHo richiesto un report su un mercato software molto specifico e il team lo ha prodotto in pochi giorni. Le informazioni erano molto pertinenti e ben presentate. Ho quindi richiesto alcune modifiche e aggiunte al report. Il team è stato ancora una volta molto reattivo e ho ricevuto il report finale in meno di una settimana.
JEAN-HERVE JENN Presidente, Future AnalyticaAbbiamo collaborato con The Insight Partners per un importante studio di mercato e una previsione. Ci hanno fornito informazioni chiare su opportunità e rischi, che ci hanno aiutato a definire i nostri piani. La loro ricerca è stata facile da usare e basata su dati solidi. Ci ha aiutato a prendere decisioni intelligenti e consapevoli. Li consigliamo vivamente.
PIYUSH NAGPAL Vicepresidente senior, Abbaglianti globaliInsight Partners ha fornito ricerche di mercato approfondite e ben strutturate, con una solida competenza nel settore. Il loro team si è dimostrato professionale e reattivo in ogni fase. Il sito web intuitivo ha reso l'accesso ai report di settore semplice e immediato. Li consigliamo vivamente per servizi di ricerca affidabili e di alta qualità.
YUKIHIKO ADACHI Amministratore delegato, Deep Blue, LLC.Questa è la prima volta che acquisto un report di mercato da The Insight Partners. Sebbene inizialmente fossi indeciso, ho visitato il loro sito web e mi sono sentito più a mio agio nell'acquistare un report di mercato. Sono completamente soddisfatto della qualità del report e del servizio clienti. Avevo diverse domande e commenti sul report iniziale, ma dopo un paio di conversazioni via email con il loro analista credo di avere un report che posso utilizzare come input per il nostro processo di pianificazione strategica. Grazie mille per aver dedicato del tempo extra e aver reso questa esperienza positiva. Consiglierò sicuramente il vostro servizio ad altri e sarete la mia prima persona a cui rivolgermi quando avremo bisogno di ulteriori dati di mercato.
GIOVANNI SUZUKI Presidente e Amministratore Delegato, Consigliere di Amministrazione, Tecnologie BKDesidero esprimere la mia gratitudine per il supporto e la professionalità dimostrati nel rispondere alla mia richiesta di informazioni sul mercato dei dispositivi medici in vitro per malattie infettive in Nigeria. Apprezzo la vostra pazienza, la vostra guida e la vostra disponibilità a offrirmi uno sconto, che alla fine ci ha permesso di concludere l'affare. Non vedo l'ora di collaborare con The Insight Partners in futuro, grazie anche all'impressione che mi avete lasciato dopo questo primo incontro.
Dott. Chijioke AMMINISTRATORE DELEGATO DI ONYIA, PineCrest Healthcare Ltd.Motivo dell'acquisto
- Processo decisionale informato
- Comprensione delle dinamiche di mercato
- Analisi competitiva
- Analisi dei clienti
- Previsioni di mercato
- Mitigazione del rischio
- Pianificazione strategica
- Giustificazione degli investimenti
- Identificazione dei mercati emergenti
- Miglioramento delle strategie di marketing
- Aumento dell'efficienza operativa
- Allineamento alle tendenze normative


