Marktübersicht für 3D-Mapping und -Modellierung, Wachstum, Trends, Analyse, Forschungsbericht (2021-2031)
Historische Daten : 2021-2022 | Basisjahr : 2023 | Prognosezeitraum : 2023-2031Marktgröße und Prognose für 3D-Mapping und -Modellierung (2021 – 2031), Berichtsabdeckung für globale und regionale Anteile, Trends und Wachstumschancen: Nach Bereitstellungsmodus (Cloud und vor Ort), Unternehmensgröße (KMU und Großunternehmen), Komponente (Softwaretools und -dienste), 3D-Mapping-Anwendung (Inspektion und Messung, Objektrekonstruktion, Projektion und Navigation, Berichterstellung und Virtualisierung und andere 3D-Mapping-Anwendungen), 3D-Modellierungsanwendung (Produktmarketing, Animation und Filme, Spiele und Design, Architektur-Rendering und andere 3D-Modellierungsanwendungen) und Branche (Einzelhandel und Konsumgüter, Ingenieurwesen und Bauwesen, Gesundheitswesen und Biowissenschaften, Transport und Logistik, Regierung und Verteidigung, Energie und Versorgung, Medien und Unterhaltung, Fertigung und andere Branchen) sowie nach Geografie
- Status : Veröffentlichte Daten
- Berichtscode : TIPTE100000786
- Kategorie : Technologie, Medien und Telekommunikation
- Anzahl der Seiten : 150
- Verfügbare Berichtsformate :


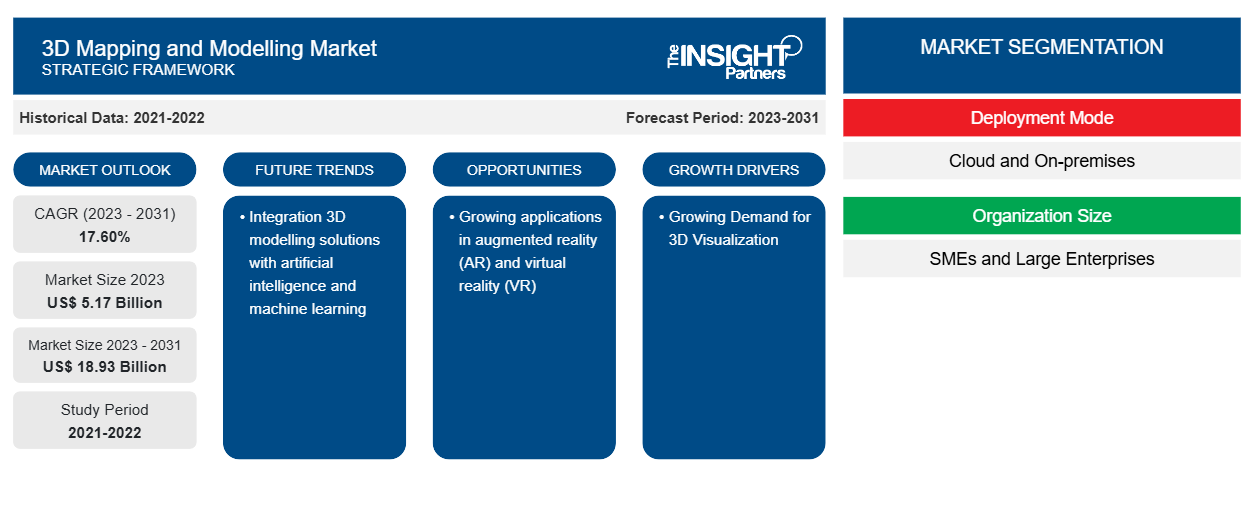
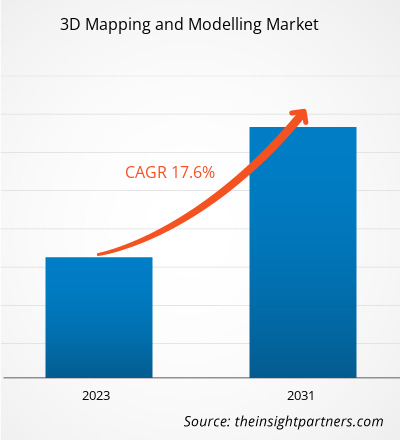
Der Markt für 3D-Mapping und -Modellierung soll von 5,17 Milliarden US-Dollar im Jahr 2023 auf 18,93 Milliarden US-Dollar im Jahr 2031 anwachsen. Der Markt wird zwischen 2023 und 2031 voraussichtlich eine durchschnittliche jährliche Wachstumsrate (CAGR) von 17,60 % verzeichnen. Die Integration von 3D-Modellierungslösungen mit künstlicher Intelligenz und maschinellem Lernen dürfte weiterhin ein wichtiger Trend auf dem Markt bleiben.
Marktanalyse für 3D-Mapping und -Modellierung
Der steigende Bedarf an 3D-Animationen, technische Entwicklungen bei 3D-Scangeräten, eine gestiegene Nachfrage nach 3D-Inhalten und eine Zunahme an 3D-Anzeigegeräten sind einige der Haupttreiber des weltweiten Marktes für 3D-Mapping und -Modellierung. Darüber hinaus treibt die zunehmende Nutzung und Integration von Technologien wie künstlicher Intelligenz und maschinellem Lernen in 3D-Mapping- und -Modellierungssoftware zur Verbesserung der Genauigkeit von 3D-Inhalten die Marktexpansion voran. All diese Gründe dürften den Marktteilnehmern im gesamten Prognosezeitraum ausreichende Entwicklungsmöglichkeiten bieten.
Marktübersicht für 3D-Mapping und -Modellierung
3D-Mapping- und Modellierungsplattformen ermöglichen es Benutzern, grundlegende dreidimensionale Modelle und Karten von Objekten und Standorten zu erstellen. Diese Technologien helfen auch bei der Visualisierung , Abfrage, Analyse und Interpretation von geografischen/Standortdaten, sodass Benutzer die Verbindungen, Muster und Trends zwischen verschiedenen Faktoren erkennen und so reale geschäftliche Herausforderungen lösen können. Unternehmen und Einzelpersonen auf der ganzen Welt nutzen 3D-Mapping- und Modellierungstechnologien, um Abläufe zu verbessern, die Effizienz zu steigern und die Ressourcennutzung zu maximieren, indem sie Problembereiche und Elemente identifizieren, die geändert werden müssen. Diese Tools werden häufig in landzentrierten Unternehmen wie Ingenieurwesen und Bauwesen, Fertigung, Transport und Logistik und vielen anderen für Außendienstmanagement, Flächenmanagement, Anlagenverwaltung und Bestandsverwaltungsanwendungen verwendet. 3D-Tools werden auch für Gebäude-/Architektur- und Tiefbau-Designanwendungen verwendet. Lidar, Sonar, Radar und Photogrammetrie sind einige der gängigsten 3D-Mapping-Techniken, und 3D-Modellierung kann Drahtgitter-, Oberflächen- und Volumenmodellierung umfassen.
Passen Sie diesen Bericht Ihren Anforderungen an
Sie erhalten kostenlos individuelle Anpassungen an jedem Bericht, einschließlich Teilen dieses Berichts oder einer Analyse auf Länderebene, eines Excel-Datenpakets sowie tolle Angebote und Rabatte für Start-ups und Universitäten.
Markt für 3D-Mapping und -Modellierung: Strategische Einblicke
-
Holen Sie sich die wichtigsten Markttrends aus diesem Bericht.Dieses KOSTENLOSE Beispiel umfasst eine Datenanalyse von Markttrends bis hin zu Schätzungen und Prognosen.
Markttreiber und Chancen für 3D-Mapping und -Modellierung
Wachsende Nachfrage nach 3D-Visualisierung begünstigt den Markt
In mehreren Branchen besteht ein wachsender Bedarf an 3D-Visualisierung. Der Einsatz von Visual Effects-Technologie (VFX) in Filmen, die Verwendung von 3D-Mobil-Apps und -Spielen sowie der steigende Trend zum digitalen Marketing tragen alle zum Wachstum des Marktes für 3D-Mapping und -Modellierung bei. Beispielsweise verwendet die Spielebranche 3D-Visualisierung, um mit 3D-Spielmaterialien, -Figuren und -Standorten immersive Erlebnisse zu schaffen. Die Marketing- und Einzelhandelsbranche setzt 3D-Visualisierung für Prototyping, die Entwicklung von Visuals für Kampagnen und die Verbesserung des Kundenerlebnisses ein. Darüber hinaus ist 3D-Visualisierung im Gesundheitswesen für Anwendungen wie medizinische Bildgebung , Operationsplanung und Patientenaufklärung unverzichtbar.VFX) in films, the usage of 3D mobile apps and gaming, and the rising trend of digital marketing are all contributing to the growth of the 3D mapping and modelling market. For instance, the gaming business uses 3D visualization to create immersive experiences using 3D game materials, characters, and locations. The marketing and retail industries employ 3D visualization for prototyping, developing visuals for campaigns, and improving consumer experiences. Moreover, 3D visualization is essential in healthcare for applications including
Zunehmende Anwendungen in Augmented Reality (AR) und Virtual Reality (VR)
Augmented Reality (AR) und Virtual Reality (VR)-Technologien breiten sich rasch aus und werden in zahlreichen Bereichen eingesetzt. Diese Technologien nutzen 3D-Modelle, um immersive digitale Erlebnisse zu schaffen, die die Art und Weise verändern, wie Benutzer mit der Welt um sie herum interagieren. AR unterstützt die reale Welt, indem digitale Komponenten wie Fotos, Videos und Text in die physische Umgebung integriert werden. Es ermöglicht die Überlagerung digitaler Informationen mit realen Dingen und verbessert so unsere Wahrnehmung und unser Wissen über die Umgebung. VR hingegen schafft vollständig virtuelle Erlebnisse, indem Benutzer in digital erstellte Umgebungen versetzt werden. Es entwickelt immersive Simulationen, die für Lehrzwecke, Unterhaltung und andere Zwecke genutzt werden können.
Segmentierungsanalyse des Marktberichts für 3D-Mapping und -Modellierung
Wichtige Segmente, die zur Ableitung der Marktanalyse für 3D-Mapping und -Modellierung beigetragen haben, sind Bereitstellungsmodus, Organisationsgröße, Komponente, 3D-Mapping-Anwendung, 3D-Modellierungsanwendung und Vertikale.
- Basierend auf dem Bereitstellungsmodus ist der Markt nach Cloud und On-Premises segmentiert. Das On-Premises-Segment dominierte den Marktanteil im Jahr 2023.
- Basierend auf der Unternehmensgröße ist der Markt in KMU und Großunternehmen segmentiert. Das Segment der Großunternehmen hatte im Jahr 2023 den größten Marktanteil.
- Basierend auf den Komponenten ist der Markt in Softwaretools und -dienste segmentiert. Das Segment Softwaretools hatte im Jahr 2023 den größten Marktanteil.
- Basierend auf 3D-Mapping-Anwendungen ist der Markt in Inspektion und Messung, Objektrekonstruktion, Projektion und Navigation, Reporting und Virtualisierung sowie andere 3D-Mapping-Anwendungen segmentiert. Das Segment Inspektion und Messung hatte im Jahr 2023 den größten Marktanteil.
- Basierend auf 3D-Modellierungsanwendungen ist der Markt in Produktmarketing, Animation und Filme, Gaming und Design, Architektur-Rendering und andere 3D-Modellierungsanwendungen segmentiert. Das Produktmarketingsegment hielt im Jahr 2023 den größten Marktanteil.
- Basierend auf der vertikalen Ebene ist der Markt in Einzelhandel und Konsumgüter, Ingenieurwesen und Bauwesen, Gesundheitswesen und Biowissenschaften, Transport und Logistik, Regierung und Verteidigung, Energie und Versorgungsunternehmen, Medien und Unterhaltung, Fertigung und andere vertikale Bereiche segmentiert. Das Segment Ingenieurwesen und Bauwesen hatte im Jahr 2023 den größten Marktanteil.
3D-Mapping und -Modellierung Marktanteilsanalyse nach Geografie
Der geografische Umfang des Marktberichts für 3D-Mapping und -Modellierung ist hauptsächlich in fünf Regionen unterteilt: Nordamerika, Asien-Pazifik, Europa, Naher Osten und Afrika sowie Süd- und Mittelamerika.
Nordamerika dominierte den Markt für 3D-Mapping und -Modellierung im Jahr 2023. Diese Dominanz ist auf das sich entwickelnde Ökosystem technologiegetriebener Unternehmen in der Region zurückzuführen. Bauwesen, Stadtplanung und selbstfahrende Autos profitieren alle vom Einsatz der 3D-Mapping- und -Modellierungstechnologie. Darüber hinaus ist Nordamerika die Heimat wichtiger Unternehmen im Bereich 3D-Mapping und -Modellierung, darunter Autodesk, Trimble, Inc. und Bentley Systems. Die Existenz dieser Unternehmen sowie ihre Erfahrung und Ressourcen tragen zur Marktüberlegenheit der Region bei.
Regionale Einblicke in den Markt für 3D-Mapping und -Modellierung
Die regionalen Trends und Faktoren, die den Markt für 3D-Mapping und -Modellierung im gesamten Prognosezeitraum beeinflussen, wurden von den Analysten von Insight Partners ausführlich erläutert. In diesem Abschnitt werden auch Marktsegmente und Geografien für 3D-Mapping und -Modellierung in Nordamerika, Europa, im asiatisch-pazifischen Raum, im Nahen Osten und Afrika sowie in Süd- und Mittelamerika erörtert.

- Holen Sie sich regionale Daten zum Markt für 3D-Mapping und -Modellierung
Umfang des Marktberichts zu 3D-Mapping und -Modellierung
| Berichtsattribut | Details |
|---|---|
| Marktgröße im Jahr 2023 | 5,17 Milliarden US-Dollar |
| Marktgröße bis 2031 | 18,93 Milliarden US-Dollar |
| Globale CAGR (2023 - 2031) | 17,60 % |
| Historische Daten | 2021-2022 |
| Prognosezeitraum | 2023–2031 |
| Abgedeckte Segmente |
Nach Bereitstellungsmodus
|
| Abgedeckte Regionen und Länder |
Nordamerika
|
| Marktführer und wichtige Unternehmensprofile |
|
Marktteilnehmerdichte: Der Einfluss auf die Geschäftsdynamik
Der Markt für 3D-Mapping und -Modellierung wächst rasant. Dies wird durch die steigende Nachfrage der Endnutzer aufgrund von Faktoren wie sich entwickelnden Verbraucherpräferenzen, technologischen Fortschritten und einem größeren Bewusstsein für die Vorteile des Produkts vorangetrieben. Mit der steigenden Nachfrage erweitern Unternehmen ihr Angebot, entwickeln Innovationen, um die Bedürfnisse der Verbraucher zu erfüllen, und nutzen neue Trends, was das Marktwachstum weiter ankurbelt.
Die Marktteilnehmerdichte bezieht sich auf die Verteilung der Firmen oder Unternehmen, die in einem bestimmten Markt oder einer bestimmten Branche tätig sind. Sie gibt an, wie viele Wettbewerber (Marktteilnehmer) in einem bestimmten Marktraum im Verhältnis zu seiner Größe oder seinem gesamten Marktwert präsent sind.
Die wichtigsten Unternehmen auf dem Markt für 3D-Mapping und -Modellierung sind:
- Über Autodesk
- Saab AB
- Golden Software
- Trimble
- Bentley Systeme
- Alphabet
Haftungsausschluss : Die oben aufgeführten Unternehmen sind nicht in einer bestimmten Reihenfolge aufgeführt.
- Erhalten Sie einen Überblick über die wichtigsten Akteure auf dem Markt für 3D-Mapping und -Modellierung
Marktnachrichten und aktuelle Entwicklungen im Bereich 3D-Mapping und -Modellierung
Der Markt für 3D-Mapping und -Modellierung wird durch die Erhebung qualitativer und quantitativer Daten nach Primär- und Sekundärforschung bewertet, die wichtige Unternehmensveröffentlichungen, Verbandsdaten und Datenbanken umfasst. Nachfolgend sind einige der Entwicklungen auf dem Markt für 3D-Mapping und -Modellierung aufgeführt:
- Autodesk hat das Projekt Bernini angekündigt. Dieses neue Forschungsprojekt bietet das erste experimentelle generative KI-Modell, das aus einer Vielzahl von Eingaben, darunter ein einzelnes 2D-Bild, mehrere Bilder mit unterschiedlichen Ansichten eines Objekts, Punktwolken, Voxel und Text, schnell überlegene 3D-Formen generiert. Das Projekt Bernini soll generative Modelle erstellen, die in verschiedenen Bereichen wie Architektur, Produktdesign, Unterhaltung und mehr eingesetzt werden können, um funktionale 3D-Strukturen zu generieren, die in realen Anwendungen verwendet werden können und der Vision des Designers entsprechen. (Quelle: Autodesk, Pressemitteilung, Mai 2024)
- Trimble hat das 3D-Laserscanning-System Trimble X9 angekündigt, eine neue, vielseitige Lösung zur Realitätserfassung für Vermessungs-, Bau- und Ingenieurfachleute. Das X9 basiert auf den bewährten Laserscanning-Technologien von Trimble und wurde entwickelt, um die Leistung in mehr Umgebungen zu verbessern und gleichzeitig Innovationen wie die Trimble X-Drive-Technologie zur automatischen Instrumentenkalibrierung, Selbstnivellierung in Vermessungsqualität und einen Laserpointer zur Georeferenzierung zu nutzen. (Quelle: Trimble, Pressemitteilung, Juni 2023)
Marktbericht zu 3D-Mapping und -Modellierung – Abdeckung und Ergebnisse
Der Bericht „Marktgröße und Prognose für 3D-Mapping und -Modellierung (2021–2031)“ bietet eine detaillierte Analyse des Marktes, die die folgenden Bereiche abdeckt:
- 3D-Mapping und Modellierung Marktgröße und Prognose auf globaler, regionaler und Länderebene für alle wichtigen Marktsegmente, die im Rahmen des Berichts abgedeckt sind
- Markttrends und Marktdynamiken für 3D-Mapping und -Modellierung wie Treiber, Einschränkungen und wichtige Chancen
- Detaillierte PEST/Porters Five Forces- und SWOT-Analyse
- Marktanalyse für 3D-Mapping und -Modellierung, die wichtige Markttrends, globale und regionale Rahmenbedingungen, wichtige Akteure, Vorschriften und aktuelle Marktentwicklungen umfasst
- Branchenlandschaft und Wettbewerbsanalyse, die die Marktkonzentration, Heatmap-Analyse, prominente Akteure und aktuelle Entwicklungen für den Markt für 3D-Mapping und -Modellierung umfasst
- Detaillierte Firmenprofile

Ankita ist eine dynamische Marktforschungs- und Beratungsexpertin mit über 8 Jahren Erfahrung in den Bereichen Technologie, Medien, IKT sowie Elektronik und Halbleiter. Sie hat über 100 Beratungs- und Forschungsaufträge für globale Kunden wie Microsoft, Oracle, NEC Corporation, SAP, KPMG und Expeditors International erfolgreich geleitet und durchgeführt. Zu ihren Kernkompetenzen gehören Marktbewertung, Datenanalyse, Prognose, Strategieformulierung, Wettbewerbsbeobachtung und das Verfassen von Berichten. Ankita ist versiert in der Abwicklung kompletter Projektzyklen – von der Angebotserstellung vor dem Verkauf und Kundengesprächen bis hin zur Bereitstellung umsetzbarer Erkenntnisse nach dem Verkauf. Sie ist versiert in der Leitung funktionsübergreifender Teams, der Strukturierung komplexer Forschungsmodule und der Ausrichtung von Lösungen an kundenspezifischen Geschäftszielen. Ihre ausgezeichneten Kommunikationsfähigkeiten, Führungsqualitäten und Präsentationsfähigkeiten haben es ihr ermöglicht, in einem schnelllebigen und sich entwickelnden Marktumfeld stets wertorientierte Ergebnisse zu liefern.
- Historische Analyse (2 Jahre), Basisjahr, Prognose (7 Jahre) mit CAGR
- PEST- und SWOT-Analyse
- Marktgröße Wert/Volumen – Global, Regional, Land
- Branchen- und Wettbewerbslandschaft
- Excel-Datensatz
Erfahrungsberichte
Der SCADA-Systemmarktbericht von Insight Partners ist umfassend und bietet wertvolle Einblicke in aktuelle Trends und Zukunftsprognosen. Das Team war durchweg hochprofessionell, reaktionsschnell und hilfsbereit. Wir sind sehr zufrieden und können die Dienstleistungen wärmstens empfehlen.
RAN KEDEM Partner, Reali Technologies LTDsIch habe einen Bericht über einen sehr spezifischen Softwaremarkt angefordert, und das Team hat ihn innerhalb weniger Tage erstellt. Die Informationen waren sehr relevant und gut präsentiert. Anschließend habe ich einige Änderungen und Ergänzungen zum Bericht angefordert. Das Team reagierte erneut sehr schnell, und ich erhielt den Abschlussbericht in weniger als einer Woche.
JEAN-HERVE JENN Vorsitzende, Future AnalyticaWir haben mit The Insight Partners für eine wichtige Marktstudie und Prognose zusammengearbeitet. Sie gaben uns klare Einblicke in Chancen und Risiken, die uns bei der Gestaltung unserer Pläne halfen. Ihre Recherchen waren benutzerfreundlich und basierten auf soliden Daten. Sie halfen uns, kluge und sichere Entscheidungen zu treffen. Wir können sie wärmstens empfehlen.
PIYUSH NAGPAL Sr. Vizepräsident, Fernlicht GlobalDie Insight Partners lieferten aufschlussreiche, gut strukturierte Marktforschung mit fundierter Fachkompetenz. Ihr Team war durchweg professionell und reaktionsschnell. Die benutzerfreundliche Website ermöglichte den Zugriff auf Branchenberichte. Wir empfehlen sie wärmstens für zuverlässige und hochwertige Forschungsdienstleistungen.
YUKIHIKO ADACHI Geschäftsführer, Deep Blue, LLC.Dies ist das erste Mal, dass ich einen Marktbericht von The Insight Partners erworben habe. Obwohl ich zunächst unsicher war, besuchte ich die Website und fühlte mich dann sicherer, das Risiko einzugehen und einen Marktbericht zu kaufen. Ich bin mit der Qualität des Berichts und dem Kundenservice rundum zufrieden. Ich hatte einige Fragen und Anmerkungen zum ersten Bericht, aber nach einigen E-Mail-Gesprächen mit dem Analysten bin ich überzeugt, dass ich einen Bericht habe, den ich als Input für unseren strategischen Planungsprozess verwenden kann. Vielen Dank, dass Sie sich die Zeit genommen und dies zu einer positiven Erfahrung gemacht haben. Ich werde Ihren Service auf jeden Fall weiterempfehlen und Sie werden meine erste Anlaufstelle sein, wenn wir weitere Marktdaten benötigen.
JOHN SUZUKI Präsident und Chief Executive Officer, Vorstandsmitglied, BK TechnologiesIch möchte mich für Ihre Unterstützung und die Professionalität bedanken, die Sie bei der Bearbeitung meiner Informationsanfrage zum IVD-Markt für Infektionskrankheiten in Nigeria gezeigt haben. Ich schätze Ihre Geduld, Ihre Beratung und die Tatsache, dass Sie bereit waren, einen Rabatt anzubieten, der uns schließlich den Abschluss eines Geschäfts ermöglichte. Ich freue mich darauf, The Insight Partners in Zukunft wieder zu beauftragen, dank des Eindrucks, den Sie bei dieser ersten Begegnung bei mir hinterlassen haben.
DR. CHIJIOKE ONYIA GESCHÄFTSFÜHRERIN, PineCrest Healthcare Ltd.Grund zum Kauf
- Fundierte Entscheidungsfindung
- Marktdynamik verstehen
- Wettbewerbsanalyse
- Kundeneinblicke
- Marktprognosen
- Risikominimierung
- Strategische Planung
- Investitionsbegründung
- Identifizierung neuer Märkte
- Verbesserung von Marketingstrategien
- Steigerung der Betriebseffizienz
- Anpassung an regulatorische Trends


Exklusive Berichtsrabatte freischalten
Jetzt anfragen


 Kostenlose Probe anfordern für - Markt für 3D-Mapping und -Modellierung