Crescita, tendenze e previsioni del mercato del carbone attivo entro il 2034
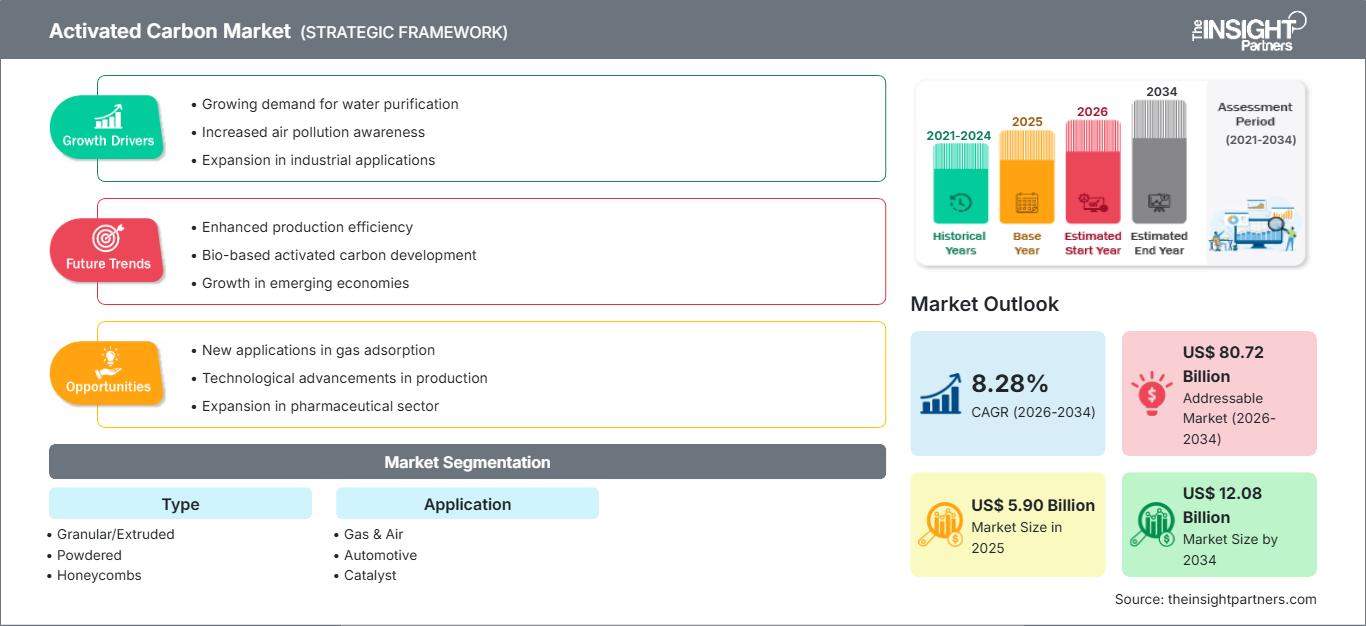
Dati storici : 2021-2024 | Anno base : 2025 | Periodo di previsione : 2026-2034Dimensioni e previsioni del mercato del carbone attivo (2021-2034), quota globale e regionale, trend e analisi delle opportunità di crescita. Copertura del rapporto: per tipologia (granulare/estruso, in polvere, a nido d'ape, impregnato e riattivato), applicazione (gas e aria, settore automobilistico, catalizzatori, prodotti chimici, alimenti e bevande, settore minerario, prodotti farmaceutici, trattamento delle acque e altri) e area geografica.
- Stato : Dati rilasciati
- Codice del report : TIPTE100000777
- Categoria : Prodotti chimici e materiali
- Numero di pagine : 150
- Formati di report disponibili :


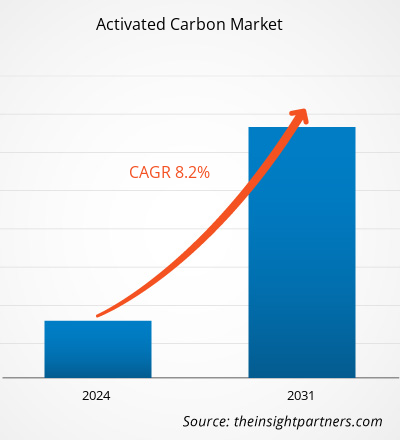
Si prevede che il mercato del carbone attivo raggiungerà un valore di 12,08 miliardi di dollari entro il 2034, rispetto ai 5,90 miliardi di dollari del 2025. Si prevede inoltre che il mercato registrerà un tasso di crescita annuo composto (CAGR) dell'8,28% nel periodo di previsione 2026-2034.
La crescente attenzione dei produttori allo sviluppo di carbone attivo da fonti biologiche e scarti agricoli, in risposta all'enfasi globale sullo sviluppo sostenibile e sull'economia circolare, è destinata a rimanere una delle principali tendenze del mercato del carbone attivo.
Analisi di mercato del carbone attivo
La crescente adozione del carbone attivo per il trattamento delle acque reflue sta alimentando la domanda di questo materiale. Negli ultimi due decenni, la domanda di trattamento delle acque reflue è aumentata a causa della tendenza al recupero dell'acqua dai processi di produzione di energia. I governi di Stati Uniti, Germania, Thailandia, Filippine, Cina e India hanno avviato programmi e iniziative a sostegno del trattamento delle acque reflue e dell'economia circolare attraverso normative statutarie o legislative. Secondo un rapporto dell'Agenzia per la Protezione Ambientale degli Stati Uniti (EPA) pubblicato nel 2022, negli impianti di depurazione statunitensi vengono trattati circa 128,7 miliardi di litri di acque reflue. Il rapporto rivela inoltre che il 20% delle famiglie statunitensi utilizza fosse settiche e sistemi per il trattamento locale delle acque reflue.
Panoramica del mercato del carbone attivo
Il carbone attivo viene prodotto in diverse forme per soddisfare specifiche applicazioni in vari settori industriali, come la purificazione dell'aria e dei gas, il trattamento delle acque reflue, l'industria chimica e quella alimentare e delle bevande, tra gli altri. Le forme disponibili di carbone attivo includono polvere, pellet, estrusi, granuli, struttura a nido d'ape, impregnato e riattivato. Il carbone attivo granulare è ampiamente utilizzato negli impianti di trattamento delle acque, mentre il carbone attivo in polvere è impiegato nell'industria alimentare e delle bevande per diverse applicazioni, come la purificazione e la raffinazione. L'elevata capacità di adsorbimento del carbone attivo lo rende una soluzione ideale per l'estrazione dell'oro dalla miscela oro-cianuro. Inoltre, il trattamento delle acque rappresenta uno dei principali settori di applicazione del carbone attivo. Il carbone attivo è anche ampiamente utilizzato per il trattamento dell'aria industriale in impianti petrolchimici, discariche, impianti di produzione e stabilimenti di lavorazione chimica per filtrare inquinanti pericolosi come i composti organici volatili.
Punti salienti della ricerca di mercato
- Il mercato globale del carbone attivo aveva un valore di 5,90 miliardi di dollari nel 2025.
- Si prevede che il valore annuo del mercato raggiungerà i 12,08 miliardi di dollari entro il 2034.
- Si prevede che il mercato totale indirizzabile (TAM) nel periodo 2026-2034 raggiungerà circa 80,72 miliardi di dollari USA.
- Si prevede che il mercato registrerà un CAGR dell'8,28% durante il periodo di previsione.
- Gli Stati Uniti rappresentano un mercato chiave, sostenuto dalla crescente domanda di purificazione dell'acqua, dalla maggiore consapevolezza dell'inquinamento atmosferico, dall'espansione delle applicazioni industriali e dalle dinamiche di settore in continua evoluzione.
- L'analisi di mercato copre Nord America, Europa, Asia-Pacifico, Sud e Centro America, Medio Oriente e Africa, con una valutazione della crescita per tutto il periodo di previsione.
- Opportunità di mercato come nuove applicazioni nell'adsorbimento di gas, progressi tecnologici nella produzione, espansione nel settore farmaceutico dovrebbero influenzare le dinamiche di mercato e il mercato indirizzabile
- Il rapporto delinea i profili dei partecipanti al settore, tra cui Osaka Gas Co Ltd, Haycarb PLC, Kureha Corp, Donau Chemie AG, Activated Carbon Technologies Pty Ltd, Albemarle Corp, CPL Activated Carbons, James Cumming and Sons Pty Ltd, Ingevity Corp, Norit Nederland BV., KURARAY CO LTD, JACOBI CARBONS GROUP, Evoqua Water Technologies LLC, Silcarbon Aktivkohle GmbH, Oxbow Activated Carbon LLC, Prominent Systems, Inc, ADA- ES, INC., analizzando al contempo le strategie competitive e gli sviluppi innovativi.
Personalizza questo report in base alle tue esigenze
Ottieni la PERSONALIZZAZIONE GRATUITAMercato del carbone attivo: spunti strategici
-
Scopri le principali tendenze di mercato di questo report.Questo campione GRATUITO includerà un'analisi dei dati, che spazierà dalle tendenze di mercato alle stime e alle previsioni.
Fattori trainanti e opportunità del mercato del carbone attivo
Aumento delle normative sulle emissioni di mercurio
Le emissioni di mercurio sono pericolose per l'ambiente e la salute umana e provengono dalle centrali elettriche a carbone. Molti paesi hanno stabilito normative sulle quantità di tossine rilasciate da queste centrali. Grazie alla Global Mercury Partnership, le normative e le politiche in diversi paesi sono state intensificate. Tecnologie di controllo avanzate, che includono hardware e software, vengono applicate per ridurre le emissioni di mercurio. Il carbone attivo è uno dei componenti hardware più importanti utilizzati in queste tecnologie per filtrare l'aria. Inoltre, è stato sviluppato anche il carbone attivo impregnato con l'aggiunta di altri materiali, come lo zolfo, per controllare efficacemente le emissioni di mercurio. Pertanto, la crescente domanda di purificazione dell'aria sta guidando la domanda di carbone attivo a livello mondiale.
Progresso tecnologico
Numerosi studi di ricerca sono stati condotti in tutto il mondo per progettare processi di produzione efficienti per il carbone attivo e sviluppare carbone attivo ad alte prestazioni. Gli scienziati si concentrano sullo sviluppo di tecnologie economiche, ottimizzate ed efficienti per la produzione di carbone attivo. Nel 2021, un team di ricerca della Central South University di Changsha, in Cina, con il supporto della National Natural Science Foundation of China, ha proposto un piano di ricerca per la preparazione in un'unica fase del carbone attivo a partire da materie prime a base di carbonio come carbone di bassa qualità e pellet ossidati.
Analisi di segmentazione del mercato del carbone attivo
I segmenti chiave che hanno contribuito alla realizzazione dell'analisi di mercato del carbone attivo sono la tipologia e l'applicazione.
- In base alla tipologia, il mercato del carbone attivo è segmentato in granulare/estruso, in polvere, a nido d'ape, impregnato e riattivato. Il segmento in polvere deteneva la quota di mercato maggiore nel 2023.
- In termini di applicazioni, il mercato è segmentato in gas e aria, automobilistico, catalizzatori, prodotti chimici, alimenti e bevande, miniere, prodotti farmaceutici, trattamento delle acque e altri. Il segmento del trattamento delle acque ha dominato il mercato nel 2023.
Analisi della quota di mercato del carbone attivo per area geografica
L'ambito geografico del rapporto sul mercato del carbone attivo è suddiviso principalmente in sei regioni: Nord America, Europa occidentale, Europa orientale, Asia Pacifico, Medio Oriente e Africa e America meridionale e centrale.
La regione Asia-Pacifico ha dominato il mercato del carbone attivo. Secondo l'European Chemical Industry Council, la quota della Cina nelle vendite globali di prodotti chimici è aumentata al 43,0% nel 2021, rispetto al 28,3% registrato nel 2011. L'aumento della domanda di vari prodotti chimici e il conseguente incremento della produzione dovrebbero stimolare la domanda di carbone attivo per la purificazione e la lavorazione chimica. Inoltre, la crescente realizzazione di impianti e attrezzature per il trattamento delle acque alimenta il mercato del carbone attivo. Si prevede che il Nord America registrerà il CAGR (tasso di crescita annuale composto) più elevato nei prossimi anni.
Notizie e recenti sviluppi sul mercato del carbone attivo.
Il mercato del carbone attivo viene valutato raccogliendo dati qualitativi e quantitativi a seguito di ricerche primarie e secondarie, che includono importanti pubblicazioni aziendali, dati di associazioni e database. Di seguito è riportato un elenco degli sviluppi nel mercato dei disturbi del linguaggio e della parola e delle relative strategie:
- Ingevity Corporation (NYSE: NGVT) ha ampliato la propria capacità produttiva di carbone attivo a seguito di importanti interventi di ottimizzazione e ammodernamento delle attrezzature, completati e verificati a fine dicembre presso il suo stabilimento di Zhuhai, in Cina. Gli interventi di ammodernamento hanno effettivamente aumentato la capacità produttiva di un ulteriore 15-20%, consentendo a Ingevity di soddisfare l'elevata domanda globale dei suoi prodotti di carbone attivo in pellet di alta qualità e ad alta capacità. (Fonte: Ingevity /Comunicato stampa/ 2021)
- Calgon Carbon Corporation ha annunciato oggi l'intenzione di ampliare la capacità produttiva del suo stabilimento di Pearlington, nel Mississippi, con l'aggiunta di una seconda linea di produzione di carbone attivo vergine. Si prevede che l'ampliamento, una volta completato, creerà 38 nuovi posti di lavoro. L'investimento stimato per la nuova linea di produzione sarà di 185 milioni di dollari. A lavori ultimati, la capacità produttiva di carbone attivo granulare vergine di Calgon Carbon supererà i 200 milioni di libbre all'anno. (Fonte: Calgon Carbon Corporation /Comunicato stampa/ 2020)
Ambito del rapporto sul mercato del carbone attivo
| Attributo del report | Dettagli |
|---|---|
| Dimensioni del mercato nel 2025 | 5,90 miliardi di dollari USA |
| Dimensioni del mercato entro il 2034 | 12,08 miliardi di dollari USA |
| Tasso di crescita annuo composto (CAGR) globale (2026-2034) | 8,28% |
| Dati storici | 2021-2024 |
| periodo di previsione | 2026-2034 |
| Segmenti trattati |
Per tipologia
|
| Regioni e paesi coperti |
America del Nord
|
| Leader di mercato e profili aziendali chiave |
|
Densità degli operatori nel mercato del carbone attivo: comprenderne l'impatto sulle dinamiche di business
Il mercato del carbone attivo è in rapida crescita, trainato dalla crescente domanda degli utenti finali, dovuta a fattori quali l'evoluzione delle preferenze dei consumatori, i progressi tecnologici e una maggiore consapevolezza dei benefici del prodotto. Con l'aumento della domanda, le aziende stanno ampliando la propria offerta, innovando per soddisfare le esigenze dei consumatori e sfruttando le tendenze emergenti, alimentando ulteriormente la crescita del mercato.
Copertura e risultati del rapporto sul mercato del carbone attivo
Il rapporto "Dimensioni e previsioni del mercato del carbone attivo (2021-2031)" fornisce un'analisi dettagliata del mercato, coprendo le seguenti aree:
- Dimensioni del mercato e previsioni a livello globale, regionale e nazionale per tutti i principali segmenti di mercato inclusi nell'ambito
- Dinamiche di mercato quali fattori trainanti, vincoli e opportunità chiave
- Principali tendenze future
- Analisi dettagliata delle cinque forze di Porter e analisi SWOT
- Analisi del mercato globale e regionale, con particolare attenzione alle principali tendenze, ai principali operatori, alle normative e ai recenti sviluppi del mercato.
- Analisi del panorama industriale e della concorrenza, con particolare attenzione alla concentrazione del mercato, all'analisi tramite mappa termica, ai principali operatori e agli sviluppi recenti.
- Profili aziendali dettagliati

- Analisi storica (2 anni), anno base, previsione (7 anni) con CAGR
- Analisi PEST e SWOT
- Valore/volume delle dimensioni del mercato - Globale, Regionale, Nazionale
- Industria e panorama competitivo
- Set di dati Excel
Testimonianze
Il report di mercato sui sistemi SCADA di Insight Partners è completo, con preziosi spunti sulle tendenze attuali e sulle previsioni future. Il team si è dimostrato altamente professionale, reattivo e disponibile in ogni fase del progetto. Siamo molto soddisfatti e consigliamo vivamente i loro servizi.
RAN KEDEM Partner, Reali Technologies LTDsHo richiesto un report su un mercato software molto specifico e il team lo ha prodotto in pochi giorni. Le informazioni erano molto pertinenti e ben presentate. Ho quindi richiesto alcune modifiche e aggiunte al report. Il team è stato ancora una volta molto reattivo e ho ricevuto il report finale in meno di una settimana.
JEAN-HERVE JENN Presidente, Future AnalyticaAbbiamo collaborato con The Insight Partners per un importante studio di mercato e una previsione. Ci hanno fornito informazioni chiare su opportunità e rischi, che ci hanno aiutato a definire i nostri piani. La loro ricerca è stata facile da usare e basata su dati solidi. Ci ha aiutato a prendere decisioni intelligenti e consapevoli. Li consigliamo vivamente.
PIYUSH NAGPAL Vicepresidente senior, Abbaglianti globaliInsight Partners ha fornito ricerche di mercato approfondite e ben strutturate, con una solida competenza nel settore. Il loro team si è dimostrato professionale e reattivo in ogni fase. Il sito web intuitivo ha reso l'accesso ai report di settore semplice e immediato. Li consigliamo vivamente per servizi di ricerca affidabili e di alta qualità.
YUKIHIKO ADACHI Amministratore delegato, Deep Blue, LLC.Questa è la prima volta che acquisto un report di mercato da The Insight Partners. Sebbene inizialmente fossi indeciso, ho visitato il loro sito web e mi sono sentito più a mio agio nell'acquistare un report di mercato. Sono completamente soddisfatto della qualità del report e del servizio clienti. Avevo diverse domande e commenti sul report iniziale, ma dopo un paio di conversazioni via email con il loro analista credo di avere un report che posso utilizzare come input per il nostro processo di pianificazione strategica. Grazie mille per aver dedicato del tempo extra e aver reso questa esperienza positiva. Consiglierò sicuramente il vostro servizio ad altri e sarete la mia prima persona a cui rivolgermi quando avremo bisogno di ulteriori dati di mercato.
GIOVANNI SUZUKI Presidente e Amministratore Delegato, Consigliere di Amministrazione, Tecnologie BKDesidero esprimere la mia gratitudine per il supporto e la professionalità dimostrati nel rispondere alla mia richiesta di informazioni sul mercato dei dispositivi medici in vitro per malattie infettive in Nigeria. Apprezzo la vostra pazienza, la vostra guida e la vostra disponibilità a offrirmi uno sconto, che alla fine ci ha permesso di concludere l'affare. Non vedo l'ora di collaborare con The Insight Partners in futuro, grazie anche all'impressione che mi avete lasciato dopo questo primo incontro.
Dott. Chijioke AMMINISTRATORE DELEGATO DI ONYIA, PineCrest Healthcare Ltd.Motivo dell'acquisto
- Processo decisionale informato
- Comprensione delle dinamiche di mercato
- Analisi competitiva
- Analisi dei clienti
- Previsioni di mercato
- Mitigazione del rischio
- Pianificazione strategica
- Giustificazione degli investimenti
- Identificazione dei mercati emergenti
- Miglioramento delle strategie di marketing
- Aumento dell'efficienza operativa
- Allineamento alle tendenze normative


Sblocca sconti esclusivi sui report
Richiedi ora


 Ottieni un campione gratuito per - Mercato del carbone attivo