
Activated Carbon Market Growth, Trends & Forecast by 2034
Coverage: By Type (Granular/Extruded, Powdered, Honeycombs, Impregnated, and Reactivated), Application (Gas & Air, Automotive, Catalyst, Chemicals, Food & Beverage, Mining, Pharmaceuticals, Water Treatment, and Others), and Geography
- Status : Data Released
- Report Code : TIPTE100000777
- Category : Chemicals and Materials
- No. of Pages : 150
- Available Report Formats :


- Last update date : April 09, 2026

2025 Market Size
US$ 5.90 Bn
Base year value
2034 Forecast
US$ 12.08 Bn
Projected by 2034
CAGR 2026-2034
8.28 %
Growth rate
Addressable Market
US$ 80.72 Bn
(2026-2034)
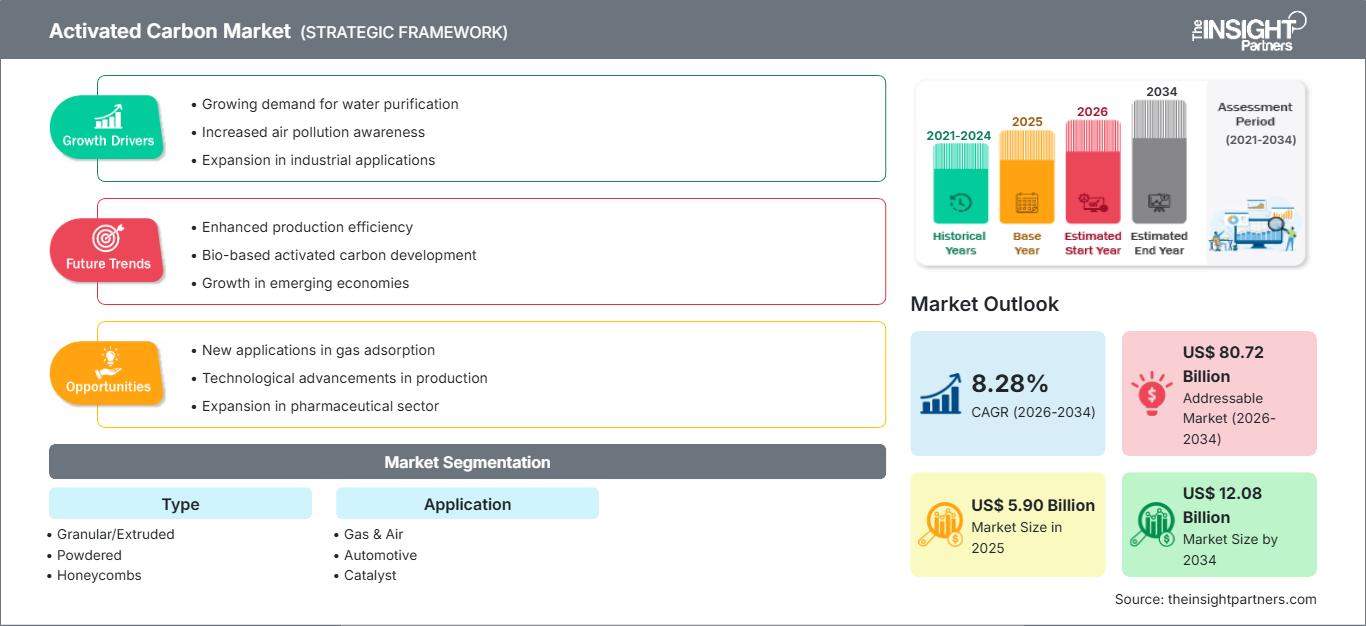
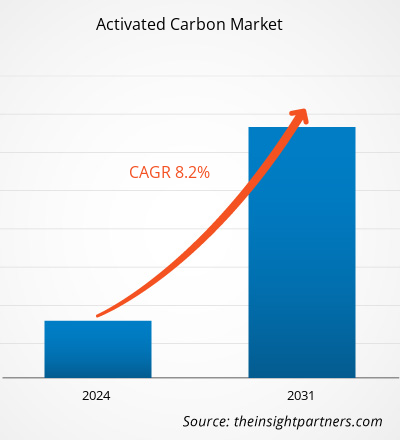
Activated Carbon market size is expected to reach US$ 12.08 Billion by 2034 from US$ 5.90 Billion in 2025. The market is anticipated to register a CAGR of 8.28% during the forecast period 2026–2034.
The growing focus of manufacturers on developing activated carbon from biological sources andagro-wastes, in response to the global focus on sustainable development and circular economies, is likely to remain key activated carbon market trends.
Activated Carbon Market Analysis
The rising adoption of activated carbon for wastewater treatment is fuelling the demand for activated carbon. Over the past two decades, the demand for wastewater treatment has increased due to the trend of recovering water from energy generation processes. Governments of the US, Germany, Thailand, the Philippines, China, and India have commenced programs and initiatives to support wastewater treatment and circular economy through statutory or legislative authorities. According to the US Environmental Protection Agency report published in 2022, ~128.7 billion liters of wastewater is processed in wastewater treatment plants in the US. The report also reveals that 20% of US households use septic tanks and systems for local wastewater treatment.
Activated Carbon Market Overview
Activated carbon is manufactured in distinct forms to serve specific applications of various end use industries such as air & gas purification, wastewater treatment, chemicals, and food & beverages, among others. The available forms of activated carbon include powder, pellets, extrudates, granules, honeycomb-structure, impregnated, and reactivated. Granular form of activated carbon is widely used in water treatment plants, whereas powdered activated carbon is utilized in the food & beverage industry for various applications such as purification and refining. The high adsorptive capacities of activated carbon make it a suitable option for the extraction of gold from the gold-cyanide mixture. Further, the water treatment is one of the major application segments for the activated carbon. Activated carbon is also highly used for industrial air treatment in petrochemical plants, landfill sites, manufacturing operations, and chemical processing facilities to filter hazardous pollutants such as volatile organic compounds.
Market Research Highlights
- Global market for Activated Carbon was valued at US$ 5.90 Billion in 2025
- Annual market size is expected to reach US$ 12.08 Billion by 2034
- Total addressable market (TAM) during 2026-2034 is projected to reach approximately US$ 80.72 Billion
- Market is anticipated to register a CAGR of 8.28% during the forecast period
- The United States represents a key market, supported by Growing demand for water purification, Increased air pollution awareness, Expansion in industrial applications, as well as evolving industry dynamics
- Market analysis covers North America, Europe, Asia-Pacific, South and Central America, Middle East and Africa, with growth evaluated across the forecast period
- Market opportunities such as New applications in gas adsorption, Technological advancements in production, Expansion in pharmaceutical sector are expected to influence market dynamics and addressable market
- Report profiles industry participants, including Osaka Gas Co Ltd, Haycarb PLC, Kureha Corp, Donau Chemie AG, Activated Carbon Technologies Pty Ltd, Albemarle Corp, CPL Activated Carbons, James Cumming and Sons Pty Ltd, Ingevity Corp, Norit Nederland BV., KURARAY CO LTD, JACOBI CARBONS GROUP, Evoqua Water Technologies LLC, Silcarbon Aktivkohle GmbH, Oxbow Activated Carbon LLC, Prominent Systems, Inc, ADA- ES, INC., while analyzing competitive strategies and innovation developments
-
Source: The Insight Partners' analysis based on proprietary research, government publications, company annual reports, investor presentations, industry databases, and expert interviews.
● REPORT CUSTOMIZATION
Tailor This Report To Align With Your Specific Business Requirements
This report can be customized to align precisely with your business objectives, scope, and target markets. Customization options include tailored segmentation, geography, competitive analysis, and strategic insights to support informed decision-making.
Customize This Report →WHAT YOU CAN ADJUST
- ● Segmentations
- ● Geography
- ● Competitive Analysis
- ● Language Preferences
Activated Carbon Market: Strategic Insights
-
Get Top Key Market Trends of this report.This FREE sample will include data analysis, ranging from market trends to estimates and forecasts.
Activated Carbon Market Drivers and Opportunities
Increasing Regulations on Mercury Emissions
Mercury emissions are hazardous to the environment & human health and are released from coal-fired power plants. Many countries have set regulations on the amounts of toxins released from these power plants. Owing to the Global Mercury Partnership, regulations and policies in different countries have been intensified. Advanced control technologies, including hardware and software, are applied to reduce mercury emissions. Activated carbon is one of the most prominent parts of hardware used in these technologies to filter air. Moreover, impregnated activated carbon has also been developed by the addition of other materials, such as sulfur, to control mercury emissions efficiently. Therefore, the growing demand for air purification is driving the demand for activated carbon in the world.
Technological Advancement
Several research studies have been conducted worldwide to engineer efficient production processes for activated carbon and develop high-performance activated carbon. Scientists are focused on developing cost-effective, optimized, and efficient technologies to produce activated carbon. In 2021, a research team from Central South University, Changsha, China, with the support of the National Natural Science Foundation of China, proposed a research plan for the one-step preparation of activated carbon from carbon-based feedstocks such as low-grade coal and oxidized pellets.
Activated Carbon Market Report Segmentation Analysis
Key segments that contributed to the derivation of the activated carbon market analysis are type and application.
- Based on type, the activated carbon market is segmented into granular/extruded, powdered, honeycombs, impregnated, and reactivated. The powdered segment held a larger market share in 2023.
- In terms of application, the market is segmented into gas & air, automotive, catalyst, chemicals, food & beverage, mining, pharmaceuticals, water treatment, and others. The water treatment segment dominated the market in 2023.
Activated Carbon Market Share Analysis by Geography
The geographic scope of the activated carbon market report is mainly divided into six regions: North America, Western Europe, Eastern Europe, Asia Pacific, Middle East & Africa, and South & Central America.
Asia Pacific has dominated the activated carbon market. According to the European Chemical Industry Council, China's share of global chemicals market sales increased to 43.0% in 2021, up from 28.3% reported in 2011. An increase in the requirement for various chemicals and a subsequent rise in production is expected to boost the demand for activated carbon for chemical purification and processing. Moreover, the increasing establishment of water treatment facilities and equipment drives the activated carbon market. North America is anticipated to grow with the highest CAGR in the coming years.
Activated Carbon Market News and Recent Developments
The activated carbon market is evaluated by gathering qualitative and quantitative data post primary and secondary research, which includes important corporate publications, association data, and databases. The following is a list of developments in the market for speech and language disorders and strategies:
- Ingevity Corporation (NYSE: NGVT) has expanded its activated carbon production capacity following significant debottlenecking and equipment upgrades completed and verified in late December at its facility in Zhuhai, China. The plant upgrades have effectively increased its capacity by an additional 15% to 20%, helping Ingevity meet the high global demand for its premium, high-capacity pelletized carbon products, (Source: Ingevity /Press Release/ 2021)
- Calgon Carbon Corporation today announced that it intends to expand capacity at its Pearlington, Mississippi plant by adding a second virgin activated carbon production line. The expansion is expected to add 38 jobs at the plant when complete. The estimated investment in the additional production line will be $185 million. When completed, Calgon Carbon’s virgin granular activated carbon capacity will exceed 200 million pounds per year. (Source: Calgon Carbon Corporation /Press Release/ 2020)
Activated Carbon Market Report Scope
| Report Attribute | Details |
|---|---|
| Market size in 2025 | US$ 5.90 Billion |
| Market Size by 2034 | US$ 12.08 Billion |
| Global CAGR (2026 - 2034) | 8.28% |
| Historical Data | 2021-2024 |
| Forecast period | 2026-2034 |
| Segments Covered |
By Type
|
| Regions and Countries Covered |
North America
|
| Market leaders and key company profiles |
|
Activated Carbon Market Players Density: Understanding Its Impact on Business Dynamics
The Activated Carbon Market is growing rapidly, driven by increasing end-user demand due to factors such as evolving consumer preferences, technological advancements, and greater awareness of the product's benefits. As demand rises, businesses are expanding their offerings, innovating to meet consumer needs, and capitalizing on emerging trends, which further fuels market growth.
Activated Carbon Market Report Coverage and Deliverables
The “Activated Carbon Market Size and Forecast (2021–2031)” report provides a detailed analysis of the market covering below areas:
- Market size and forecast at global, regional, and country levels for all the key market segments covered under the scope
- Market dynamics such as drivers, restraints, and key opportunities
- Key future trends
- Detailed Porter’s Five Forces and SWOT analysis
- Global and regional market analysis covering key market trends, major players, regulations, and recent market developments
- Industry landscape and competition analysis covering market concentration, heat map analysis, prominent players, and recent developments
- Detailed company profiles

- Comprehensive Market Sizing and Forecast Analysis
- Detailed Segmentation Analysis
- In-Depth Market Dynamics Assessment
- Regional and Country-Level Insights
- Competitive Landscape and Company Benchmarking
- Strategic Business Intelligence
Recent Reports
Testimonials
The Insight Partners' SCADA System Market report is comprehensive, with valuable insights on current trends and future forecasts. The team was highly professional, responsive, and supportive throughout. We are very satisfied and highly recommend their services.
RAN KEDEM Partner, Reali Technologies LTDsI requested a report on a very specific software market and the team produced the report in a few days. The information was very relevant and well presented. I then requested some changes and additions to the report. The team was again very responsive and I got the final report in less than a week.
JEAN-HERVE JENN Chairman, Future AnalyticaWe worked with The Insight Partners for an important market study and forecast. They gave us clear insights into opportunities and risks, which helped shape our plans. Their research was easy to use and based on solid data. It helped us make smart, confident decisions. We highly recommend them.
PIYUSH NAGPAL Sr. Vice President, High Beam GlobalThe Insight Partners delivered insightful, well-structured market research with strong domain expertise. Their team was professional and responsive throughout. The user-friendly website made accessing industry reports seamless. We highly recommend them for reliable, high-quality research services
YUKIHIKO ADACHI CEO, Deep Blue, LLC.This is the first time I have purchased a market report from The Insight Partners.While I was unsure at first, I visited their web site and felt more comfortable to take the risk and purchase a market report.I am completely satisfied with the quality of the report and customer service. I had several questions and comments with the initial report, but after a couple of dialogs over email with their analyst I believe I have a report that I can use as input to our strategic planning process.Thank you so much for taking the extra time and making this a positive experience.I will definitely recommend your service to others and you will be my first call when we need further market data.
JOHN SUZUKI President and Chief Executive Officer, Board Director, BK TechnologiesI wish to appreciate your support and the professionalism you displayed in the course of attending to my request for information regarding to infectious disease IVD market in Nigeria. I appreciate your patience, your guidance, and the fact that you were willing to offer a discount, which eventually made it possible for us to close a deal. I look forward to engaging The Insight Partners in the future, all thanks to the impression you have created in me as a result of this first encounter.
DR CHIJIOKE ONYIA MANAGING DIRECTOR, PineCrest Healthcare Ltd.Reason to Buy
- Informed Decision-Making
- Understanding Market Dynamics
- Competitive Analysis
- Identifying Emerging Markets
- Customer Insights
- Market Forecasts
- Risk Mitigation
- Boosting Operational Efficiency
- Strategic Planning
- Investment Justification
- Tracking Industry Innovations
- Aligning with Regulatory Trends


