Crescita, dimensione, quota, tendenze, analisi dei principali attori del mercato Tomografia computerizzata a fascio conico fino al 2028
Previsioni di mercato della tomografia computerizzata a fascio conico fino al 2028 - Impatto del COVID-19 e analisi globale per tipo (in piedi, seduti e supini), applicazione (odontoiatria, otorinolaringoiatria, cancro al seno, ortopedia, base cranica e altri) e utente finale (ospedali e cliniche, centri diagnostici e altri)
- Stato : Edito
- Codice del report : TIPRE00002889
- Categoria : Scienze della vita
- Numero di pagine : 199
- Formati di report disponibili :


- Data dell'ultimo aggiornamento : June 13, 2024


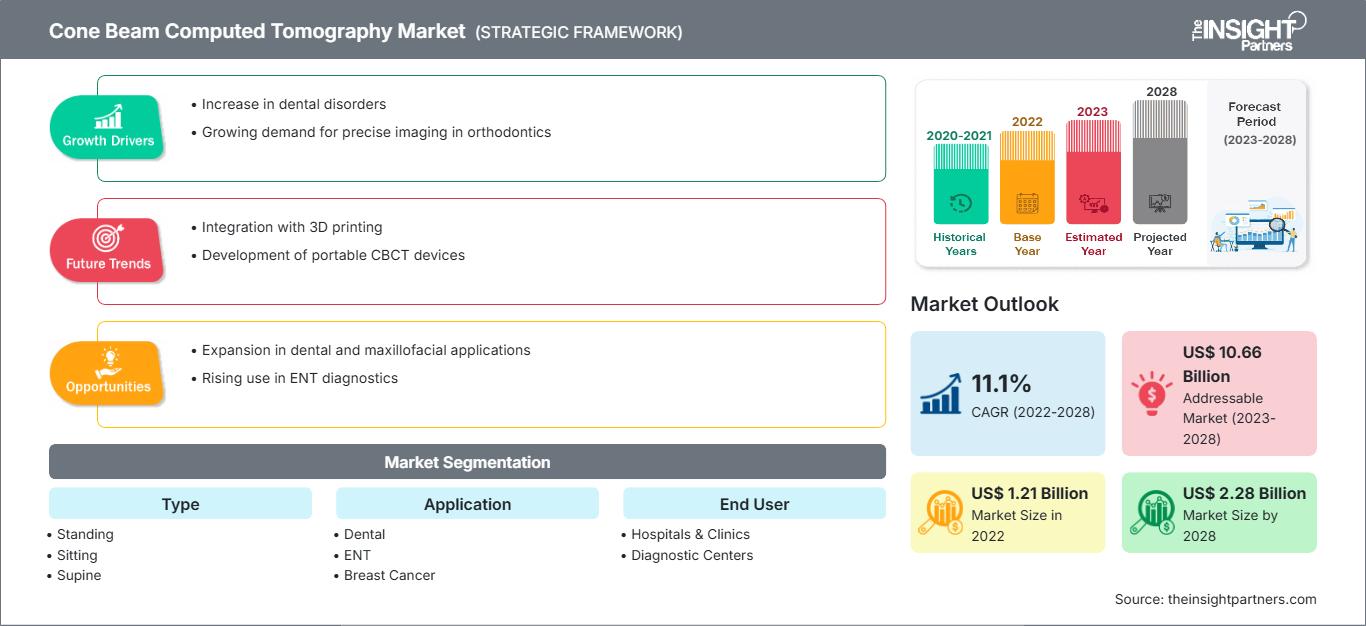
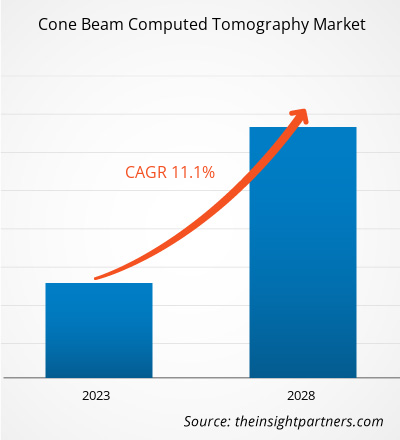
Si prevede che il mercato della tomografia computerizzata a fascio conico raggiungerà i 2.278,41 milioni di dollari entro il 2028, rispetto ai 1.214,51 milioni di dollari del 2022; si stima una crescita a un CAGR dell'11,1% dal 2022 al 2028.
La tomografia computerizzata a fascio conico è una variante del tradizionale sistema di tomografia computerizzata (TC). I sistemi di tomografia computerizzata a fascio conico utilizzati dai professionisti odontoiatrici ruotano attorno al paziente, acquisendo dati tramite un fascio di raggi X a forma di cono. Questi dati vengono utilizzati per ricostruire un'immagine tridimensionale della regione dentale (denti); orale e maxillo-facciale (bocca, mandibola e collo); e di orecchie, naso e gola.
Il mercato della tomografia computerizzata a fascio conico è segmentato in base a tipologia, applicazione, utente finale e area geografica. In base alla distribuzione geografica, il mercato è ampiamente segmentato in Nord America, Europa, Asia-Pacifico, Medio Oriente e Africa e America meridionale e centrale. Il rapporto offre approfondimenti e analisi approfondite del mercato, evidenziando le tendenze, i progressi tecnologici e le dinamiche di mercato. Offre inoltre un'analisi del panorama competitivo dei principali attori del mercato a livello mondiale.
Personalizza questo rapporto in base alle tue esigenze
Potrai personalizzare gratuitamente qualsiasi rapporto, comprese parti di questo rapporto, o analisi a livello di paese, pacchetto dati Excel, oltre a usufruire di grandi offerte e sconti per start-up e università
Mercato della tomografia computerizzata a fascio conico: Approfondimenti strategici
-
Ottieni le principali tendenze chiave del mercato di questo rapporto.Questo campione GRATUITO includerà l'analisi dei dati, che vanno dalle tendenze di mercato alle stime e alle previsioni.
Approfondimenti di mercato
L'integrazione di strumenti software nei dispositivi CBCT stimola la crescita del mercato
Integrando strumenti software nei sistemi CBCT, gli utenti possono automatizzare e standardizzare procedure diagnostiche complesse, migliorare l'esperienza del paziente e i risultati diagnostici e ridurre i costi delle cure, migliorando al contempo la funzionalità dei sistemi CBCT. Analizzare e interpretare i dati delle scansioni CBCT può essere impegnativo, anche per i professionisti clinici esperti. I sistemi software sono stati sviluppati per offrire a laboratori odontotecnici, dentisti, implantologi e chirurghi la massima flessibilità e precisione. L'integrazione software con la CBCT aiuterebbe i medici ad ampliare l'ambito diagnostico e a migliorare la visibilità delle strutture anatomiche sottostanti dei pazienti durante la pianificazione del trattamento. L'integrazione di sistemi di archiviazione e comunicazione di immagini (PACS) con i sistemi CBCT consente di acquisire e modificare le immagini della telecamera, condividerle tramite il cloud e fornire una pianificazione efficiente del trattamento. PACS è una tecnologia di imaging medico utilizzata principalmente per l'archiviazione e la trasmissione sicura di immagini elettroniche digitali. Consente ai medici di diverse sedi di esaminare gli stessi dati contemporaneamente. Le aziende sanitarie digitali stanno investendo nello sviluppo di software per i sistemi CBCT. Pertanto, l'integrazione dei dispositivi CBCT con strumenti software per semplificare l'analisi, l'interpretazione e l'archiviazione dei dati sta contribuendo alla crescita del mercato della tomografia computerizzata a fascio conico.
Progressi tecnologici e ricerca e sviluppo per introdurre nuove tendenze nel mercato CBCT
I progressi tecnologici, in particolare nei sistemi di imaging digitale, hanno portato a miglioramenti nelle procedure diagnostiche e chirurgiche. Ciò può essere attribuito alla capacità dei sistemi di imaging avanzati di fornire informazioni dettagliate agli operatori sanitari riducendo al contempo l'esposizione dei pazienti alle radiazioni. Grazie alle tecniche CBCT, i dentisti hanno acquisito la capacità di raccogliere più dati con dosi di radiazioni inferiori. In precedenza, i medici si affidavano all'imaging bidimensionale per la diagnosi e la pianificazione del trattamento. Tuttavia, la tecnologia 2D richiede spesso esposizioni multiple. Pertanto, la scansione 3D ha guadagnato maggiore popolarità nella diagnostica.
Di seguito sono menzionati alcuni dei progressi relativi al mercato della CBCT:
- A marzo 2019, Planmeca Oy ha introdotto un Planmeca Viso G5 avanzato nella sua famiglia Planmeca Viso, che offre un'elevata qualità delle immagini CBCT.
- A dicembre 2021, RaySearch Laboratories AB ha introdotto nuove funzionalità in Ray Station 11B per flussi di lavoro adattivi, brachiterapia e radioterapia con ioni. Ray Station 11B funziona con una maggiore precisione nel calcolo della dose sulle immagini giornaliere per la terapia fotonica. Le CBCT giornaliere forniscono una migliore rappresentazione dell'anatomia del paziente al momento del trattamento rispetto a qualsiasi TC convenzionale, che viene eseguita nelle prime fasi del processo e utilizzata per pianificare il trattamento completo.
- Ad aprile 2022, Carestream Dental ha lanciato la Neo Edition della famiglia CS 8200 3D, che ha reso la scansione CBCT estremamente intuitiva. La Neo Edition è una versione evoluta del CS 8200 3D, dotata di un modulo Scan Ceph opzionale che garantisce facilità d'uso, contribuisce a una migliore esperienza clinica e porta a risultati più soddisfacenti. I medici che già utilizzano il CS 8200 3D possono facilmente passare alla nuova Neo Edition.
- A giugno 2022, Xoran Technologies ha ottenuto un brevetto per un sistema modulare di tomografia computerizzata a fascio conico.
Pertanto, è probabile che tali progressi tecnologici da parte di diversi operatori del mercato introducano nuove tendenze nel mercato della tomografia computerizzata a fascio conico nei prossimi anni.
Approfondimenti per l'utente finale
In base all'utente finale, il mercato della tomografia computerizzata a fascio conico è suddiviso in ospedali e cliniche, centri diagnostici e altri. Gli ospedali e le cliniche Il segmento delle cliniche ha detenuto la quota di mercato maggiore nel 2021 e si prevede che il segmento dei centri diagnostici registrerà il CAGR più elevato durante il periodo di previsione. I laboratori diagnostici sono dotati di strutture di imaging a servizio completo che forniscono ai pazienti servizi di screening e diagnostica completi e di altissima qualità. I centri diagnostici dispongono di tutte le moderne modalità di imaging, come TAC, ecografia, radiografia e mammografia. I radiologi in loco in queste strutture forniscono ai pazienti un esame completo, seguito dalla consegna dei referti entro poche ore. I progressi nelle tecnologie di imaging, che portano a risultati rapidi e accurati in tempi di consegna ridotti, e un'impennata della domanda di diagnosi precoce delle malattie sono i fattori che favoriscono la crescita del mercato della tomografia computerizzata a fascio conico per il segmento dei laboratori diagnostici.
Lanci di prodotti, fusioni e acquisizioni sono le strategie ampiamente adottate dagli operatori del mercato globale della tomografia computerizzata a fascio conico. Di seguito sono elencati alcuni dei recenti sviluppi di prodotto chiave:
- A maggio 2021, PreXion Corporation ha lanciato l'ultimo modello, PreXion 3D Explorer PRO. Questa versione del dispositivo è dotata di un braccio radiografico cefalometrico integrato.
- A febbraio 2021, Brainlab ha ricevuto l'autorizzazione della FDA per il robot di imaging mobile Loop-X e il sistema chirurgico robotico Cirq. In seguito all'approvazione del marchio CE, Brainlab ha ricevuto anche l'autorizzazione della FDA per il lancio di questi prodotti sul mercato statunitense. Cirq è un modulo di allineamento robotico per procedure spinali e Loop-X è il primo dispositivo di imaging intraoperatorio completamente robotico.
- A novembre 2022, Canon ha rafforzato la sua attività medica con la fondazione di Canon Healthcare USA, INC. Rafforzando la sua presenza nell'influente mercato medico americano, Canon mira ad accelerare la crescita della sua attività medica.
Nella regione Asia-Pacifico, la pandemia di COVID-19 ha colpito gravemente Cina e India. Questi paesi ospitano già molti pazienti affetti da patologie croniche. Gli operatori sanitari di questi paesi hanno annullato le procedure elettive per contrastare la pandemia. Inoltre, i pazienti e i loro familiari hanno evitato di recarsi in ospedale per proteggersi dalle infezioni, optando invece per la consulenza online. Ciò ha comportato un drastico calo delle procedure diagnostiche eseguite per patologie croniche. D'altro canto, l'aumento dei casi di COVID-19 ha innescato la domanda di radiografie e sistemi di tomografia computerizzata a fascio conico, utilizzati per monitorare la diffusione dell'infezione nei polmoni. L'imaging CBCT viene utilizzato quotidianamente nella radioterapia toracica per verificare i cambiamenti nel posizionamento e nell'anatomia del paziente prima del trattamento, attraverso una valutazione qualitativa dell'aspetto polmonare da parte dei tecnici di radiologia. In considerazione di ciò, diversi operatori del mercato dell'area Asia-Pacifico hanno lanciato prodotti nuovi e innovativi per semplificare le procedure diagnostiche complessive. Pertanto, la pandemia di COVID-19 ha avuto un impatto moderatamente positivo sul mercato della tomografia computerizzata a fascio conico.
Approfondimenti regionali sul mercato della tomografia computerizzata a fascio conico
Le tendenze regionali e i fattori che influenzano il mercato della tomografia computerizzata a fascio conico durante il periodo di previsione sono stati ampiamente spiegati dagli analisti di The Insight Partners. Questa sezione illustra anche i segmenti e la distribuzione geografica del mercato della tomografia computerizzata a fascio conico in Nord America, Europa, Asia-Pacifico, Medio Oriente e Africa, America meridionale e centrale.
Ambito del rapporto di mercato sulla tomografia computerizzata a fascio conico
| Attributo del rapporto | Dettagli |
|---|---|
| Dimensioni del mercato in 2022 | US$ 1.21 Billion |
| Dimensioni del mercato per 2028 | US$ 2.28 Billion |
| CAGR globale (2022 - 2028) | 11.1% |
| Dati storici | 2020-2021 |
| Periodo di previsione | 2023-2028 |
| Segmenti coperti |
By Tipo
|
| Regioni e paesi coperti |
Nord America
|
| Leader di mercato e profili aziendali chiave |
|
Densità degli operatori del mercato della tomografia computerizzata a fascio conico: comprendere il suo impatto sulle dinamiche aziendali
Il mercato della tomografia computerizzata a fascio conico è in rapida crescita, trainato dalla crescente domanda degli utenti finali, dovuta a fattori quali l'evoluzione delle preferenze dei consumatori, i progressi tecnologici e una maggiore consapevolezza dei vantaggi del prodotto. Con l'aumento della domanda, le aziende stanno ampliando la propria offerta, innovando per soddisfare le esigenze dei consumatori e sfruttando le tendenze emergenti, alimentando ulteriormente la crescita del mercato.
- Ottieni il Mercato della tomografia computerizzata a fascio conico Panoramica dei principali attori chiave
Tomografia computerizzata a fascio conico - Segmentazione del mercato
In base al posizionamento del paziente, il mercato della tomografia computerizzata a fascio conico è segmentato in posizione eretta, seduta e supina. Per applicazione, il mercato è segmentato in odontoiatria, otorinolaringoiatria, cancro al seno, base cranica, ortopedia e altri. In termini di utente finale, il mercato della tomografia computerizzata a fascio conico è suddiviso in ospedali e cliniche, centri diagnostici e altri. In base all'area geografica, il mercato è segmentato in Nord America (Stati Uniti, Canada e Messico), Europa (Francia, Germania, Regno Unito, Spagna, Italia e resto d'Europa), Asia-Pacifico (Cina, India, Giappone, Australia, Corea del Sud e resto dell'APAC), Medio Oriente e Africa (Arabia Saudita, Emirati Arabi Uniti, Sudafrica e resto dell'area MEA) e Sud e Africa (Arabia Saudita, Emirati Arabi Uniti, Sudafrica e resto dell'area MEA). America Centrale (Brasile, Argentina e resto dell'America meridionale e centrale)
Profili aziendali
- Dentsply Sirona Inc
- Newtom
- Carestream Dental LLC
- Fussen Group
- PreXion
- Brainlab AG
- IDETEC MEDICAL IMAGING
- Vatech Co., Ltd
- Planmeca Oy
- Canon Medical Systems

Mrinal è un'analista di ricerca esperta con oltre 8 anni di esperienza nella consulenza e nell'intelligence di mercato nel settore delle scienze biologiche. Grazie a una mentalità strategica e a un costante impegno verso l'eccellenza, ha maturato una profonda competenza nelle previsioni farmaceutiche, nella valutazione delle opportunità di mercato e nello sviluppo di benchmark di settore. Il suo lavoro è incentrato sulla fornitura di insight fruibili che consentono ai clienti di prendere decisioni strategiche consapevoli.
Il punto di forza di Mrinal risiede nella capacità di tradurre complessi set di dati quantitativi in business intelligence significative. Il suo acume analitico è fondamentale per definire strategie di go-to-market (GTM) e individuare opportunità di crescita nei settori farmaceutico e dei dispositivi medici. In qualità di consulente di fiducia, si concentra costantemente sulla semplificazione dei processi di flusso di lavoro e sulla definizione di best practice, promuovendo così l'innovazione e l'efficienza operativa per i suoi clienti.
- Analisi completa delle dimensioni e delle previsioni di mercato
- Analisi dettagliata della segmentazione
- Valutazione approfondita delle dinamiche di mercato
- Approfondimenti a livello regionale e nazionale
- Analisi del panorama competitivo e benchmarking aziendale
- Business intelligence strategica
Testimonianze
Il report di mercato sui sistemi SCADA di Insight Partners è completo, con preziosi spunti sulle tendenze attuali e sulle previsioni future. Il team si è dimostrato altamente professionale, reattivo e disponibile in ogni fase del progetto. Siamo molto soddisfatti e consigliamo vivamente i loro servizi.
RAN KEDEM Partner, Reali Technologies LTDsHo richiesto un report su un mercato software molto specifico e il team lo ha prodotto in pochi giorni. Le informazioni erano molto pertinenti e ben presentate. Ho quindi richiesto alcune modifiche e aggiunte al report. Il team è stato ancora una volta molto reattivo e ho ricevuto il report finale in meno di una settimana.
JEAN-HERVE JENN Presidente, Future AnalyticaAbbiamo collaborato con The Insight Partners per un importante studio di mercato e una previsione. Ci hanno fornito informazioni chiare su opportunità e rischi, che ci hanno aiutato a definire i nostri piani. La loro ricerca è stata facile da usare e basata su dati solidi. Ci ha aiutato a prendere decisioni intelligenti e consapevoli. Li consigliamo vivamente.
PIYUSH NAGPAL Vicepresidente senior, Abbaglianti globaliInsight Partners ha fornito ricerche di mercato approfondite e ben strutturate, con una solida competenza nel settore. Il loro team si è dimostrato professionale e reattivo in ogni fase. Il sito web intuitivo ha reso l'accesso ai report di settore semplice e immediato. Li consigliamo vivamente per servizi di ricerca affidabili e di alta qualità.
YUKIHIKO ADACHI Amministratore delegato, Deep Blue, LLC.Questa è la prima volta che acquisto un report di mercato da The Insight Partners. Sebbene inizialmente fossi indeciso, ho visitato il loro sito web e mi sono sentito più a mio agio nell'acquistare un report di mercato. Sono completamente soddisfatto della qualità del report e del servizio clienti. Avevo diverse domande e commenti sul report iniziale, ma dopo un paio di conversazioni via email con il loro analista credo di avere un report che posso utilizzare come input per il nostro processo di pianificazione strategica. Grazie mille per aver dedicato del tempo extra e aver reso questa esperienza positiva. Consiglierò sicuramente il vostro servizio ad altri e sarete la mia prima persona a cui rivolgermi quando avremo bisogno di ulteriori dati di mercato.
GIOVANNI SUZUKI Presidente e Amministratore Delegato, Consigliere di Amministrazione, Tecnologie BKDesidero esprimere la mia gratitudine per il supporto e la professionalità dimostrati nel rispondere alla mia richiesta di informazioni sul mercato dei dispositivi medici in vitro per malattie infettive in Nigeria. Apprezzo la vostra pazienza, la vostra guida e la vostra disponibilità a offrirmi uno sconto, che alla fine ci ha permesso di concludere l'affare. Non vedo l'ora di collaborare con The Insight Partners in futuro, grazie anche all'impressione che mi avete lasciato dopo questo primo incontro.
Dott. Chijioke AMMINISTRATORE DELEGATO DI ONYIA, PineCrest Healthcare Ltd.Motivo dell'acquisto
- Processo decisionale informato
- Comprensione delle dinamiche di mercato
- Analisi competitiva
- Analisi dei clienti
- Previsioni di mercato
- Mitigazione del rischio
- Pianificazione strategica
- Giustificazione degli investimenti
- Identificazione dei mercati emergenti
- Miglioramento delle strategie di marketing
- Aumento dell'efficienza operativa
- Allineamento alle tendenze normative


