フレーバーシロップの市場シェア、需要、成長(2034年まで)
過去データ : 2021-2024 | 基準年 : 2025 | 予測期間 : 2026-2034フレーバーシロップ市場規模と予測(2021年~2034年)、世界および地域別シェア、トレンド、成長機会分析レポートの対象範囲:フレーバー別(フルーツ、チョコレート、バニラ、ハーブと調味料、その他)、フレーバータイプ別(甘味、塩味・風味、酸味、ミント)、用途別(飲料、乳製品・冷凍デザート、菓子、ベーカリー、その他)、地域別
- ステータス : 公開されたデータ
- レポートコード : TIPRE00005895
- カテゴリー : 食品と飲料
- ページ数 : 150
- 利用可能なレポート形式 :


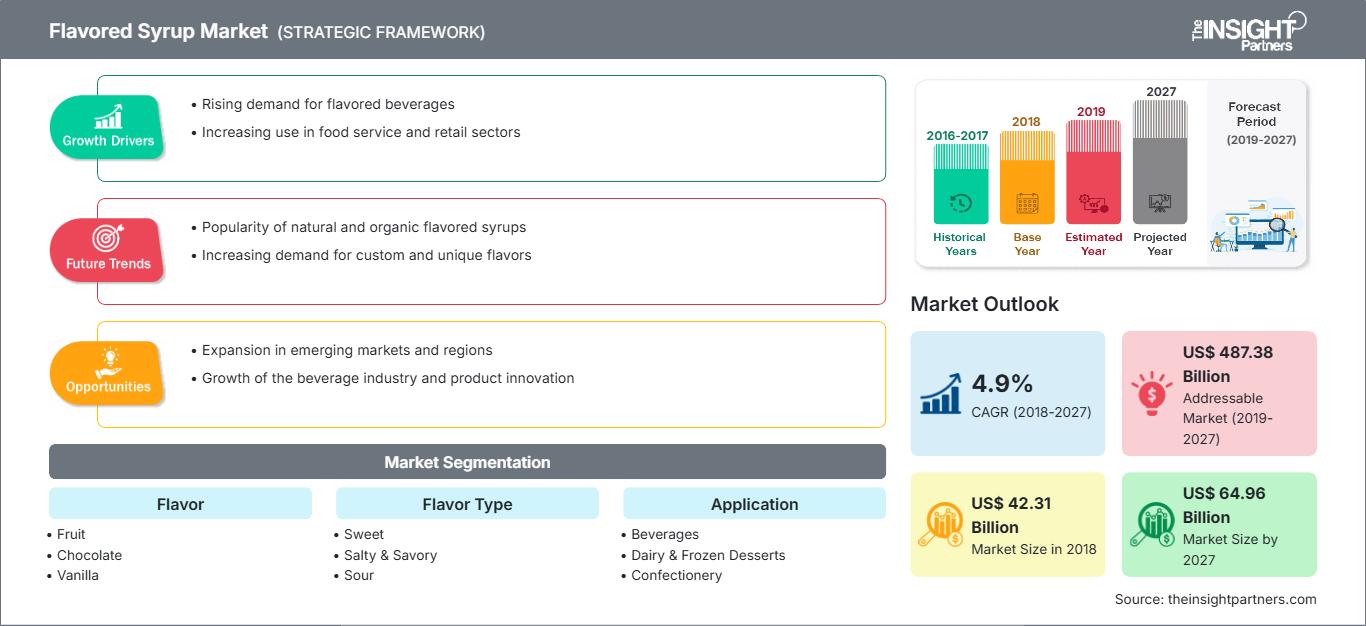
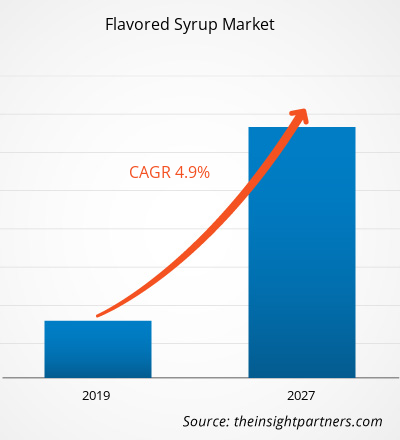
世界のフレーバーシロップ市場規模は、2025年の559億6000万米ドルから2034年には893億9000万米ドルに達すると予測されています。市場は、2026年から2034年の予測期間中に年平均成長率(CAGR)5.30%を記録すると予想されています。
市場の主要な動向としては、グルメ飲料体験に対する世界的な注目度の高まり、低糖質および天然甘味料に対する消費者の需要増加、そしてプレミアムで職人技によるフレーバープロファイルへの大きなシフトが挙げられます。さらに、家庭でのミクソロジーの人気上昇、新興国における組織化されたカフェチェーンの拡大、そして特製ベーカリーや機能性乳製品といった高付加価値分野におけるフレーバーシロップの採用増加も、市場の追い風になると予想されます。
フレーバーシロップ市場分析
フレーバーシロップ市場の分析によると、消費者が単なる甘味以上のものを求めるようになり、体験型消費への大きな転換が見られます。調達動向を見ると、大量生産される清涼飲料水に使用される合成シロップと、本物のフルーツピューレや植物蒸留液を使用した成長著しい天然配合シロップとの間で、乖離が拡大しています。電解質やアダプトゲンなどの機能性添加物を組み込むことで、従来のシロップを健康志向の成分へと変える戦略的な機会が生まれています。また、この分析では、市場拡大がデジタルアクセスとますます密接に結びついており、eコマースプラットフォームによって小規模生産者が世界中の顧客にリーチできるようになっていることも指摘しています。現在では、小規模農家からの調達、非遺伝子組み換え認証、カーボンニュートラル生産を強調するブランディングによって競争上の差別化が際立っており、プレミアムブランドは混雑した市場でより高い価格を設定できるようになっています。
フレーバーシロップ市場の概要
フレーバーシロップは、シンプルなパンケーキのトッピングから、世界の料理や飲料のイノベーションに欠かせないツールへと進化しました。フレーバーシロップは、甘味と辛味の組み合わせ、花の香りのインフュージョン、ハニー味噌やバジルライムのような甘味と塩味の組み合わせなど、複雑なフレーバープロファイルを特徴としています。多国籍食品大手と独立系クラフトブランドの両方がこの市場で競い合い、人工保存料を使用せずに風味の完全性を維持するために高度な抽出技術を使用しています。ミレニアル世代とZ世代の間で自宅でのバリスタ体験への需要が高まっていることから、プロ仕様のシロップポンプシステムとサンプラーセットの小売での採用が加速しています。北米はソーダとコーヒーの文化が深く根付いているため、収益のリーダーであり続けていますが、アジア太平洋地域は、パンダン、ウベ、カルダモンなどの伝統的なフレーバーと現代的な西洋スタイルのデザートやドリンクのハイブリッド化によって急速に発展しています。
米国市場は、成熟したコーヒー文化と、外出先での飲料消費頻度の高さが特徴です。季節ごとのフレーバートレンドや、業務用シロップの家庭での普及が需要を牽引しています。外食産業においては、消費者は天然エキスや無糖製品をますます重視するようになっています。
お客様のご要望に合わせてこのレポートをカスタマイズしてください
無料カスタマイズフレーバーシロップ市場:戦略的洞察
-
本レポートの主要市場トレンドをご覧ください。この無料サンプルには、市場動向から予測、見通しまで、幅広いデータ分析が含まれています。
フレーバーシロップ市場の推進要因と機会
市場の推進要因:
- スペシャルティコーヒーと紅茶文化の成長:世界的なカフェチェーンの普及と、カスタマイズされたラテやアイスティーへの需要の高まりは、シロップ業界にとって重要な推進力となっている。
- 家庭料理における利便性への需要の高まり:消費者は、レストラン品質のドリンクやデザートを自宅で再現するために、プロ仕様のシロップをますます利用するようになり、小売売上を押し上げている。
- 無糖・天然成分配合の革新:健康意識の高まりに伴い、天然由来のゼロカロリー甘味料を使用したシロップの開発が進み、消費者層が拡大している。
市場機会:
- ノンアルコール飲料分野への進出:洗練されたモクテルの人気上昇は、複雑で風味豊かでハーブを注入したシロップにとって大きなビジネスチャンスとなる。
- アジア太平洋地域の新たな小売市場における成長:グローバルメーカーとアジアの流通業者との戦略的パートナーシップは、欧米型の食習慣が広まっている中国やインドの高収益セグメントへのアクセスを容易にする可能性がある。
- 機能性成分への多角化:生産者にとって、アダプトゲンや免疫力向上成分をシロップベースに組み込むことで、健康志向の顧客層をターゲットにする機会が拡大している。
フレーバーシロップ市場レポートのセグメンテーション分析
フレーバーシロップ市場の市場シェアは、その構造、成長可能性、および新たなトレンドをより明確に理解するために、さまざまなセグメントにわたって分析されます。以下は、ほとんどの業界レポートで使用されている標準的なセグメンテーション手法です。
フレーバー別:
- フルーツ:最も主要なフレーバーカテゴリーであり、清涼飲料水、炭酸飲料、フルーツを使ったデザートなどに広く用いられている。
- チョコレート:乳製品やベーカリー製品の定番であり、ミルクシェイクやトッピングとして安定した需要を維持している。
- バニラ:非常に汎用性が高く、コーヒーや製菓用途において依然としてトップセラーのフレーバーです。
- ハーブと調味料:ラベンダー、バジル、スパイシーな風味など、グルメなミクソロジーのトレンドに合致する、急速に成長しているニッチ市場。
フレーバータイプ別:
- 甘味:販売量で最大のセグメントであり、伝統的な飲料およびデザート市場に対応している。
- 塩味と旨味:塩キャラメル風味や料理用グレーズに用いられる、新たなトレンド。
- 酸味:菓子業界やカクテル業界で、風味のバランスを整えるために人気がある。
- ミント:チョコレート、紅茶、季節限定飲料に欠かせない風味。
申請方法:
- 飲料:コーヒー、紅茶、カクテル、ソフトドリンクなど、主要な用途分野。
- 乳製品および冷凍デザート:アイスクリーム、ヨーグルト、フレーバーミルクなどに広く使用され、風味を高めます。
- 製菓:キャンディーやチョコレートのフィリングやコーティングに不可欠です。
- 製パン:ケーキ、ペストリー、手作りパンの水分保持と風味の浸透に利用されます。
地域別:
- 北米
- ヨーロッパ
- アジア太平洋地域
- 南米および中央アメリカ
- 中東およびアフリカ
フレーバーシロップ市場レポートの範囲
| レポート属性 | 詳細 |
|---|---|
| 2025年の市場規模 | 559億6000万米ドル |
| 2034年までの市場規模 | 893億9000万米ドル |
| 世界の年間平均成長率(2026年~2034年) | 5.3% |
| 履歴データ | 2021年~2024年 |
| 予測期間 | 2026年~2034年 |
| 対象分野 |
フレーバー別
|
| 対象地域および国 |
北米
|
| 市場リーダーと主要企業の概要 |
|
フレーバーシロップ市場のプレーヤー密度:ビジネスダイナミクスへの影響を理解する
フレーバーシロップ市場は、消費者の嗜好の変化、技術革新、製品の利点に対する認識の高まりといった要因によるエンドユーザー需要の増加を背景に、急速に成長しています。需要の高まりに伴い、企業は製品ラインナップを拡充し、消費者のニーズに応えるべく革新を進め、新たなトレンドを活用することで、市場の成長をさらに加速させています。
フレーバーシロップ市場の地域別シェア分析
アジア太平洋地域は今後数年間で最も急速な成長が見込まれる。南米、中米、中東、アフリカの新興市場にも、高級飲料原料や職人技による食品メーカーにとって、事業拡大のための未開拓の機会が数多く存在する。
フレーバーシロップ市場は、一般的な甘味料から世界的な高付加価値の料理用調味料へと、大きな変革期を迎えています。この成長を牽引しているのは、カフェ文化の隆盛、家庭での自家製カクテル作りのブーム、そしてグルメ飲料の急速な拡大です。以下に、地域別の市場シェアとトレンドの概要を示します。
1. 北アメリカ
- 市場シェア:米国とカナダにおける深く根付いたコーヒー文化と、すぐに食べられる(RTE)スナック菓子の高い消費量を背景に、世界最大のシェアを占めている。
-
主な推進要因:
- 朝食用シリアルやスナック菓子など、日常の食事において、フルーツやメープル風味のシロップが広く使用されるようになった。
- 高級食料品チェーン店やプロのバリスタが集まる店舗において、プレミアムシロップや職人技が光るシロップを主流化する。
- 業界大手企業の存在感が強く、無糖およびケトジェニックダイエット対応のシロップ製品が早期に採用された。
- トレンド:家庭用バリスタキットの小売販売規模の拡大と、健康志向のミレニアル世代にアピールするための専門認証(例:非遺伝子組み換え、オーガニック)の導入の成功。
2. ヨーロッパ
- 市場シェア:特にフランス、イタリア、イギリスにおいて、洗練されたカクテルと料理のシーンを特徴とする主要プレーヤー。
-
主な推進要因:
- クラフトバーやレストランでは、植物由来や花由来のシロップ(例:エルダーフラワー、ラベンダー)に対する需要が高い。
- 厳格な規制枠組みと、合成添加物よりも天然抽出物を好む消費者の傾向の高まり。
- 高品質で伝統的なシロップブランドのための、確立された加工インフラ。
- トレンド:地域ごとの砂糖削減イニシアチブに対応するため、クリーンラベル製品への戦略的なシフトや、アガベやステビアなどの代替甘味料の使用が進んでいる。
3. アジア太平洋地域
- 市場シェア:最も急速に成長している地域であり、急速な都市化と可処分所得の増加により、中国とインドが主な牽引役となっている。
-
主な推進要因:
- 国際的なコーヒーチェーンの大規模な拡大と、地元におけるバブルティーやスペシャルティドリンク市場の活況。
- ライフスタイルの変化により、欧米風の高級乳製品を使ったスナックやデザートを好む傾向が強まっている。
- 政府による食品加工産業の成長支援は、拡大する中間層のニーズを満たすためのものである。
- トレンド:高級シロップの消費者直販(D2C)においてeコマースへの依存度が高まっていること、そしてパンダン、ゆず、カルダモンといった地域特有のフレーバーが導入されていること。
4. 南米および中央アメリカ
- 市場シェア:ブラジルやアルゼンチンなどの国々で、職人技による産業が成長している新興市場。
-
主な推進要因:
- 家庭での製菓やデザート作りに用いる、グルメ食品添加物への意識向上。
- 小売チャネルの近代化、非公式市場から多様なシロップを取り揃えた組織化された大型スーパーマーケットへの移行。
- 高所得の都市部層の間で、地中海料理や国際的な飲料トレンドへの関心が高まっている。
- トレンド:小規模な地元ブランドの成長と、世界的な商品ブランドとの差別化を図るためのエキゾチックなトロピカルフルーツシロップの導入。
5. 中東とアフリカ
- 市場シェア:甘味のある伝統的な飲み物に深い文化的ルーツを持つ発展途上市場であり、現在は正式な商業生産へと移行しつつある。
-
主な推進要因:
- 高温乾燥地帯では、常温保存可能な濃縮液やUHT処理対応の香料に対する需要が高い。
- 観光・ホスピタリティ分野への戦略的な投資(例:ドバイ、リヤド)が、高級モクテルやカフェ用食材の需要を牽引している。
- 食品サービス施設の近代化を図り、グローバルなメニューオプションを取り入れる。
- トレンド:外食産業における高度な冷蔵・供給技術の導入と、高栄養価で機能性に優れたシロップへの注目。
市場密度の高さと競争の激しさ
ハーシー社、ケリーグループ、モナン、トラーニといった老舗大手企業の存在により、競争は激化している。テート&ライル、ダヴィンチグルメ、メゾンルーティンといった地域特化型企業やニッチ市場を専門とする企業も、多様化し急速に拡大する市場環境に貢献している。
このような競争環境は、ベンダーに以下の方法で差別化を図るよう促します。
- 高級化と機能性ブランド化:健康志向の消費者を惹きつけるため、天然、オーガニック、非遺伝子組み換えといった特徴を強調することで、シロップを単なる甘味料以上のものとして位置づける。
- 用途範囲の拡大:製品は現在、コーヒーフレーバーにとどまらず、風味豊かなグレーズ、植物由来のノンアルコールカクテルベース、ビタミンやアダプトゲンを配合した機能性シロップなども提供している。
- サプライチェーン管理:生産者は、原材料となる植物の調達から環境に配慮した瓶詰めまで、ライフサイクル全体を管理し、透明性を確保し、倫理的なクリーンラベル基準を満たします。
- 先進的な加工技術:フレーバー抽出と安定化における新しい手法により、長期保存期間中も味を損なうことなく、高濃度のシロップを製造することが可能になります。
機会と戦略的動き
- 戦略的パートナーシップ:アジア太平洋地域および北米市場における、カスタマイズされた職人技による飲料体験に対する高まる需要を取り込むため、高級カフェチェーンやeコマースプラットフォームと提携する。
- 健康とウェルネスとの整合性:環境意識の高い消費者層や糖尿病患者に配慮した消費者層にアピールするため、持続可能な調達方法や羅漢果やアロースなどの代替甘味料を取り入れる。
フレーバーシロップ市場で事業を展開する主要企業は以下のとおりです。
- アーチャー・ダニエルズ・ミッドランド社
- ASRグループ
- シーダーベール・メープルシロップ社
- ケリーグループ
- クラフト・ハインツ社
- モナン株式会社
- センシエント テクノロジーズ株式会社
- 小さな手で食べる食品
- サニースカイプロダクツLLC
- ハーシー社
免責事項:上記に掲載されている企業は、特定の順序でランク付けされているわけではありません。
フレーバーシロップ市場のニュースと最新動向
- 2025年7月、サニースカイプロダクツは、シナボン®コールドブリュー、シナボン®ホットチョコレート、シナボン®フレーバーシロップの発売により、シナボン®飲料ラインナップを拡充することを発表しました。この贅沢な3つの新商品は、シナボン®シナモンロールの象徴的な風味を、コンビニエンスストア経営者にとってさらに魅力的な飲料体験へと昇華させます。
- 2025年3月、高級フレーバーソリューションのリーディングカンパニーであるモナン・アメリカズは、最新のイノベーションである「ゆずパイナップルシロップ」を発表しました。このシロップは、ポルトガルのチャンクーダにあるモナン・フランス所有の74エーカーのゆず農園で栽培された果実から抽出したフレーバーを使用しています。ゆずパイナップルシロップは、柑橘類特有の酸味とフローラルな香りに、甘酸っぱいパイナップルの風味を融合させた、カクテル、紅茶、そして様々な料理を格上げするプレミアムなトロピカルフレーバーです。
フレーバーシロップ市場レポートの対象範囲と成果物
フレーバーシロップ市場規模と予測(2021年~2034年)レポートでは、以下の分野を網羅した市場の詳細な分析を提供しています。
- フレーバーシロップ市場の規模と予測(グローバル、地域、国レベル)を、調査範囲に含まれるすべての主要市場セグメントについて分析します。
- フレーバーシロップ市場の動向、および推進要因、阻害要因、主要な機会などの市場ダイナミクス
- 詳細なPEST分析とSWOT分析
- フレーバーシロップ市場の分析:主要な市場動向、世界および地域的な枠組み、主要企業、規制、および最近の市場動向を網羅
- フレーバーシロップ市場における市場集中度、ヒートマップ分析、主要企業、および最近の動向を網羅した業界概況および競争分析。
- 詳細な企業プロフィール

- 過去2年間の分析、基準年、CAGRによる予測(7年間)
- PEST分析とSWOT分析
- 市場規模価値/数量 - 世界、地域、国
- 業界と競争環境
- Excel データセット
お客様の声
Insight PartnersのSCADAシステム市場レポートは包括的で、現在のトレンドと将来の予測に関する貴重な洞察が含まれています。チームは終始、非常にプロフェッショナルで、対応が早く、サポートも充実していました。私たちは彼らのサービスに非常に満足しており、強くお勧めします。
ラン・ケデム パートナー, レアリテクノロジーズ株式会社非常に特殊なソフトウェア市場に関するレポートを依頼したところ、チームは数日でレポートを作成してくれました。情報は非常に関連性が高く、分かりやすくまとめられていました。その後、レポートにいくつか修正と追加を依頼しましたが、チームは非常に迅速に対応し、1週間も経たないうちに最終レポートを受け取ることができました。
ジャン=エルヴェ・ジェン 会長, フューチャー・アナリティカ重要な市場調査と予測のために、The Insight Partnersと協力しました。彼らは機会とリスクに関する明確な洞察を提供し、私たちの計画策定に役立ちました。彼らの調査は使いやすく、確かなデータに基づいており、賢明で自信に満ちた意思決定に役立ちました。彼らを強くお勧めします。
ピユーシュ・ナグパル 上級副社長, ハイビームグローバルInsight Partnersは、深い専門知識に基づき、洞察力に富み、構造化された市場調査を提供しました。チームは終始プロフェッショナルで、対応力も抜群でした。ユーザーフレンドリーなウェブサイトにより、業界レポートへのアクセスもスムーズでした。信頼性の高い高品質な調査サービスをお探しなら、Insight Partnersを強くお勧めします。
安達幸彦 最高経営責任者(CEO), ディープブルーLLC。The Insight Partnersから市場レポートを購入するのは今回が初めてです。最初は不安でしたが、ウェブサイトを見て、リスクを負ってでも購入してみようという気持ちになりました。レポートの品質とカスタマーサービスには大変満足しています。最初のレポートにはいくつか質問やコメントがありましたが、アナリストとメールで何度かやり取りした結果、戦略策定プロセスへのインプットとして活用できるレポートが完成しました。貴重なお時間を割いていただき、貴重な体験をさせていただき、誠にありがとうございました。他の方にもぜひお勧めしたいですし、今後さらに市場データが必要になった際には、まずThe Insight Partnersにご連絡させていただきます。
ジョン・スズキ 社長兼最高経営責任者、取締役, BKテクノロジーズナイジェリアの感染症IVD市場に関する情報提供依頼に対し、ご対応いただいた際、ご尽力とプロフェッショナルな姿勢に深く感謝申し上げます。忍耐強く、的確なアドバイスをいただき、また、最終的に取引成立に至った割引のご提供にも深く感謝申し上げます。今回の最初の出会いで得た強い印象のおかげで、今後もThe Insight Partnersとの連携を心待ちにしております。
チジオケ博士 オニア マネージングディレクター, パインクレストヘルスケア株式会社購入理由
- 情報に基づいた意思決定
- 市場動向の理解
- 競合分析
- 顧客インサイト
- 市場予測
- リスク軽減
- 戦略計画
- 投資の正当性
- 新興市場の特定
- マーケティング戦略の強化
- 業務効率の向上
- 規制動向への対応


 無料サンプルを入手 - フレーバーシロップ市場