灌漑自動化市場の需要、動向、および2034年までの予測
過去データ : 2021-2024 | 基準年 : 2025 | 予測期間 : 2026-2034灌漑自動化市場規模と予測(2021年~2034年)、世界および地域別シェア、トレンド、成長機会分析レポートの対象範囲:自動化タイプ別(時間ベースシステム、水量ベースシステム、リアルタイムフィードバックシステム、コンピュータベース灌漑制御システム)、灌漑タイプ別(点滴灌漑、スプリンクラー灌漑、表面灌漑)、コンポーネント別(コントローラー、センサー、バルブ、スプリンクラー、その他)、システム別(自動および半自動)、エンドユーザー別(農業および非農業)、地域別
- ステータス : 公開されたデータ
- レポートコード : TIPRE00011988
- カテゴリー : エレクトロニクスおよび半導体
- ページ数 : 150
- 利用可能なレポート形式 :


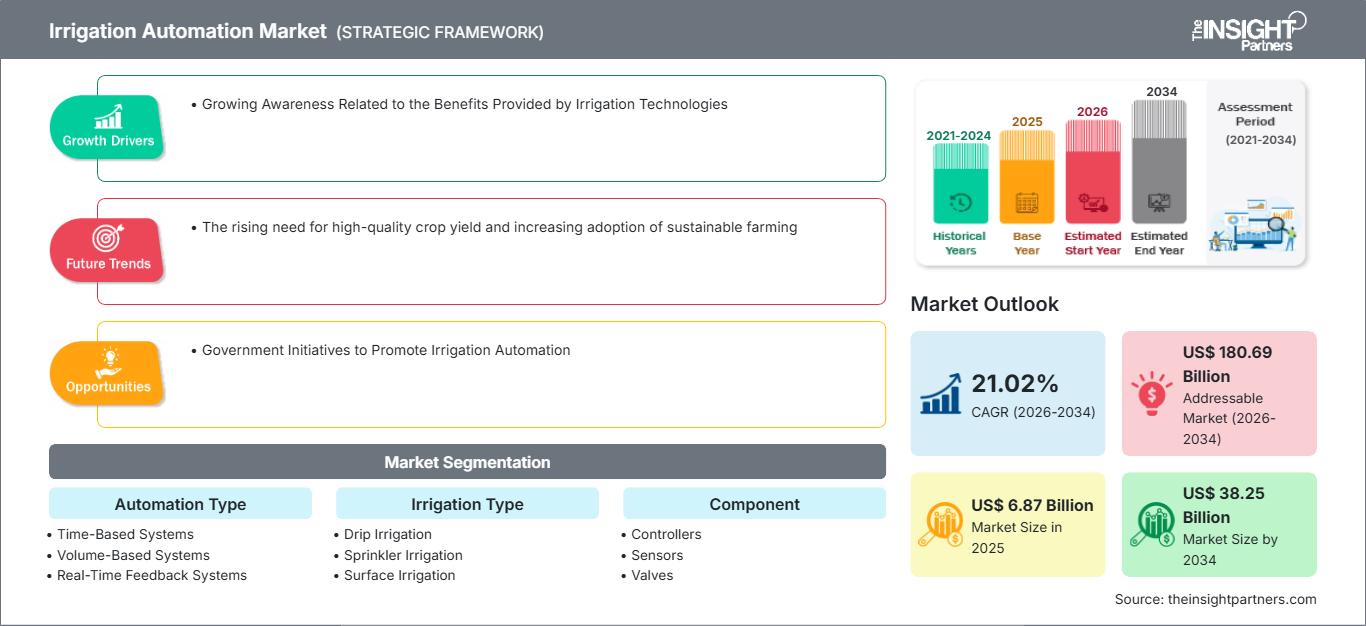
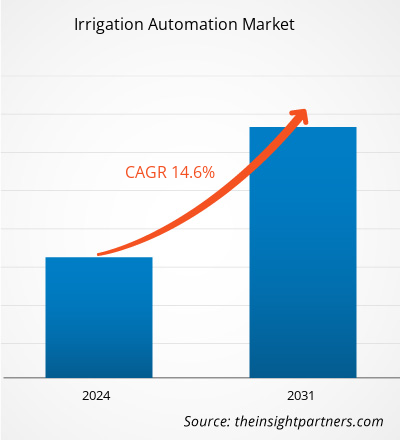
灌漑自動化市場規模は、2025年の68億7000万米ドルから2034年には382億5000万米ドルに達すると予測されています。また、2026年から2034年の予測期間において、年平均成長率(CAGR)は21.02%になると見込まれています。
灌漑自動化市場分析
灌漑自動化市場は、灌漑技術がもたらすメリットへの認識の高まりと、精密農業機器・技術の普及に伴い、急速に成長しています。スマート農業技術への需要の高まりを背景に、市場は着実に拡大しています。さらに、技術革新と灌漑自動化を推進する政府の取り組みが、市場成長のための魅力的な機会を提供しています。
灌漑自動化市場の概要
灌漑自動化とは、様々な灌漑システムを操作し、灌漑区画からの水の流れを調整するために、機器や装置を用いる技術です。灌漑自動化には、センサー、バルブ、コントローラー、スプリンクラーなど、多数のハードウェアを組み合わせることで、農業用途と非農業用途の両方に利用できる自動化システムを構築します。灌漑自動化によって得られる時間短縮、コスト効率の向上、資源の最適化といった大きなメリットが、市場の成長を牽引しています。
市場調査のハイライト
- 灌漑自動化の世界市場規模は、2025年には68億7000万米ドルと評価された。
- 年間市場規模は2034年までに382億5000万米ドルに達すると予測されている。
- 2026年から2034年までの潜在市場規模(TAM)は、約1,806億9,000万米ドルに達すると予測されています。
- 市場は予測期間中に年平均成長率(CAGR)21.02%を記録すると予想されている。
- 米国は、灌漑技術がもたらす利点に対する認識の高まりや、業界の動向の変化に支えられ、重要な市場となっている。
- 市場分析は、北米、ヨーロッパ、アジア太平洋、南米、中米、中東、アフリカを対象とし、予測期間全体にわたる成長を評価しています。
- 灌漑自動化を促進する政府イニシアチブなどの市場機会は、市場のダイナミクスと対象市場に影響を与えることが期待されます。
- 本レポートでは、Galcon Ltd.、Hunter Industries Inc.、Irritec SpA、Jain Irrigation Systems Ltd.、Lindsay Corporation、Nelson Irrigation Corporation、Rubicon Water、The Toro Company、Valmont Industries, Inc.、WaterBit, Inc.などの業界参加企業を紹介するとともに、各社の競争戦略とイノベーションの動向を分析しています。
お客様のご要望に合わせてこのレポートをカスタマイズしてください
無料カスタマイズ灌漑自動化市場:戦略的洞察
-
本レポートの主要市場トレンドをご覧ください。この無料サンプルには、市場動向から予測、見通しまで、幅広いデータ分析が含まれています。
灌漑自動化市場の推進要因と機会
灌漑技術がもたらすメリットに対する認識の高まりが市場を牽引している
農家は、高い労働コストと電気代に関連する自動灌漑技術への関心を高めています。灌漑技術は、節水、プロセスの自動化、コスト削減など、利用者に大きなメリットをもたらし、市場を牽引しています。これらのメリットは農家の意識を高め、灌漑技術の導入を促進しています。これらの技術は、農家が日々の電力使用量を削減し、灌漑に費やす時間と労力を減らすのに役立ちます。さらに、自動化によって農家は農作業の回数を減らすことができ、結果として労働コストを削減できます。自動灌漑システムを導入することで、正確な水量と灌漑時間を決定することにより、農業の精度が向上します。この精度により、農家の作物損失が減り、総生産性が向上します。
灌漑自動化を促進するための政府主導の取り組み ― 灌漑自動化市場における機会
発展途上国の農家の大多数は、時間のかかる従来型の灌漑システム(表面灌漑)を採用しています。そのため、各国政府は灌漑の自動化を促進するための積極的な取り組みを進めており、これが市場における新たな機会の創出につながると期待されています。インド、中国、ブラジル、米国、フランス、その他のアフリカ諸国など、多くの発展途上国政府は、灌漑システムの効率化を図るため、点滴灌漑システムやスプリンクラーシステムの購入に対する補助金を提供しています。さらに、スプリンクラー灌漑システムや点滴灌漑システムの使用を奨励する厳格な政策は、農家が農場灌漑装置(スプリンクラーや点滴灌漑システム)の取得や再設置など、技術的に高度なシステムを農場に導入するのに役立っています。これらの要因が、予測期間中の市場における大きな成長機会を生み出しています。
灌漑自動化市場レポートのセグメンテーション分析
灌漑自動化市場分析の算出に貢献した主要なセグメントは、自動化の種類、灌漑の種類、コンポーネント、システム、およびエンドユーザーである。
- 自動化の種類に基づくと、市場は時間ベースシステム、量ベースシステム、リアルタイムフィードバックシステム、およびコンピュータベースの灌漑制御システムに分類されます。2023年には、時間ベースシステムセグメントが最大の市場シェアを占めました。
- 灌漑方式に基づいて、市場は点滴灌漑、スプリンクラー灌漑、表面灌漑に分類される。2023年には点滴灌漑セグメントが最大の市場シェアを占めた。
- 構成要素別に見ると、市場はコントローラー、センサー、バルブ、スプリンクラー、その他に分類される。2023年にはコントローラー分野が最大の市場シェアを占めた。
- システムの種類に基づくと、灌漑自動化市場は自動式と半自動式に分けられる。2023年には自動式セグメントがより大きな市場シェアを占めた。
- 用途別に見ると、市場は農業分野と非農業分野に分類される。2023年においては、農業分野がより大きな市場シェアを占めた。
灌漑自動化市場の地域別シェア分析
灌漑自動化市場レポートの地理的範囲は、主に北米、アジア太平洋、ヨーロッパ、中東・アフリカ、南米/中南米の5つの地域に分けられます。
収益面では、広大な農地と政府の支援体制により、アジア太平洋地域が灌漑自動化市場で最大のシェアを占めています。気候変動の急速な変化と廃棄物削減の必要性の高まりを背景に、市場は近い将来拡大すると予想されています。さらに、技術革新と高度な灌漑システムの開発も、予測期間中の市場成長を後押ししています。
灌漑自動化市場レポートの範囲
| レポート属性 | 詳細 |
|---|---|
| 2025年の市場規模 | 68億7000万米ドル |
| 2034年までの市場規模 | 382億5000万米ドル |
| 世界の年間平均成長率(2026年~2034年) | 21.02% |
| 履歴データ | 2021年~2024年 |
| 予測期間 | 2026年~2034年 |
| 対象分野 |
自動化タイプ別
|
| 対象地域および国 |
北米
|
| 市場リーダーと主要企業の概要 |
|
灌漑自動化市場のプレーヤー密度:ビジネスダイナミクスへの影響を理解する
灌漑自動化市場は、消費者の嗜好の変化、技術革新、製品の利点に対する認識の高まりといった要因によるエンドユーザー需要の増加を背景に、急速に成長しています。需要の高まりに伴い、企業は製品ラインナップを拡充し、消費者のニーズに応えるべく革新を進め、新たなトレンドを活用することで、市場の成長をさらに加速させています。
灌漑自動化市場のニュースと最新動向
灌漑自動化市場は、主要な企業出版物、業界団体のデータ、データベースなど、一次調査および二次調査後の定性的データと定量的データを収集することによって評価されます。以下は、灌漑自動化市場における動向と戦略の一覧です。
- 2024年3月、ルビコン・ウォーターはウズベキスタンとタジキスタンの国境地帯における最新プロジェクトを発表しました。スイス協力事務所とブルー・ピース・イニシアティブの支援を受けたこの革新的なプロジェクトは、国境を越えた配水と計測に焦点を当て、国境を越えた水管理における協力関係の促進を目指しています。灌漑用水管理の改善に加え、ルビコンの技術は地下水管理、涵養プログラム、環境流量イニシアチブにおいてますます重要な役割を果たしており、重要な水資源と生態系の保全に貢献しています。(出典:ルビコン・ウォーター、プレスリリース、2024年)
灌漑自動化市場レポートの対象範囲と成果物
「灌漑自動化市場規模と予測(2021年~2031年)」レポートでは、以下の分野を網羅した市場の詳細な分析を提供しています。
- 調査範囲に含まれるすべての主要市場セグメントについて、世界、地域、国レベルでの市場規模と予測
- 市場の動向(推進要因、阻害要因、主要な機会など)
- 将来の主要トレンド
- 詳細なPEST分析/ポーターの5つの力分析およびSWOT分析
- 主要な市場動向、主要企業、規制、および最近の市場動向を網羅した、グローバルおよび地域市場の分析。
- 市場集中度、ヒートマップ分析、主要企業、最近の動向などを網羅した業界概況および競争分析
- 詳細な企業プロフィール

Naveenは、カスタム、シンジケート、コンサルティングの各プロジェクトにおいて9年以上の実績を持つ、経験豊富な市場調査およびコンサルティングのプロフェッショナルです。現在はアソシエイトバイスプレジデントを務め、プロジェクトバリューチェーン全体にわたるステークホルダー管理を成功させ、100件以上の調査レポートと30件以上のコンサルティング案件を執筆しています。産業および政府機関のプロジェクトに幅広く携わり、クライアントの成功とデータに基づく意思決定に大きく貢献しています。
Naveenは、カルナータカ州VTUで電子通信工学の学位を取得し、マニパル大学でマーケティング&オペレーションズのMBAを取得しています。IEEEの会員として9年間活動し、会議や技術シンポジウムへの参加、セクションレベルおよび地域レベルでのボランティア活動に積極的に取り組んでいます。現職以前は、IndustryARCでアソシエイト戦略コンサルタント、Hewlett Packard(HP Global)で産業用サーバーコンサルタントを務めていました。
- 過去2年間の分析、基準年、CAGRによる予測(7年間)
- PEST分析とSWOT分析
- 市場規模価値/数量 - 世界、地域、国
- 業界と競争環境
- Excel データセット
お客様の声
Insight PartnersのSCADAシステム市場レポートは包括的で、現在のトレンドと将来の予測に関する貴重な洞察が含まれています。チームは終始、非常にプロフェッショナルで、対応が早く、サポートも充実していました。私たちは彼らのサービスに非常に満足しており、強くお勧めします。
ラン・ケデム パートナー, レアリテクノロジーズ株式会社非常に特殊なソフトウェア市場に関するレポートを依頼したところ、チームは数日でレポートを作成してくれました。情報は非常に関連性が高く、分かりやすくまとめられていました。その後、レポートにいくつか修正と追加を依頼しましたが、チームは非常に迅速に対応し、1週間も経たないうちに最終レポートを受け取ることができました。
ジャン=エルヴェ・ジェン 会長, フューチャー・アナリティカ重要な市場調査と予測のために、The Insight Partnersと協力しました。彼らは機会とリスクに関する明確な洞察を提供し、私たちの計画策定に役立ちました。彼らの調査は使いやすく、確かなデータに基づいており、賢明で自信に満ちた意思決定に役立ちました。彼らを強くお勧めします。
ピユーシュ・ナグパル 上級副社長, ハイビームグローバルInsight Partnersは、深い専門知識に基づき、洞察力に富み、構造化された市場調査を提供しました。チームは終始プロフェッショナルで、対応力も抜群でした。ユーザーフレンドリーなウェブサイトにより、業界レポートへのアクセスもスムーズでした。信頼性の高い高品質な調査サービスをお探しなら、Insight Partnersを強くお勧めします。
安達幸彦 最高経営責任者(CEO), ディープブルーLLC。The Insight Partnersから市場レポートを購入するのは今回が初めてです。最初は不安でしたが、ウェブサイトを見て、リスクを負ってでも購入してみようという気持ちになりました。レポートの品質とカスタマーサービスには大変満足しています。最初のレポートにはいくつか質問やコメントがありましたが、アナリストとメールで何度かやり取りした結果、戦略策定プロセスへのインプットとして活用できるレポートが完成しました。貴重なお時間を割いていただき、貴重な体験をさせていただき、誠にありがとうございました。他の方にもぜひお勧めしたいですし、今後さらに市場データが必要になった際には、まずThe Insight Partnersにご連絡させていただきます。
ジョン・スズキ 社長兼最高経営責任者、取締役, BKテクノロジーズナイジェリアの感染症IVD市場に関する情報提供依頼に対し、ご対応いただいた際、ご尽力とプロフェッショナルな姿勢に深く感謝申し上げます。忍耐強く、的確なアドバイスをいただき、また、最終的に取引成立に至った割引のご提供にも深く感謝申し上げます。今回の最初の出会いで得た強い印象のおかげで、今後もThe Insight Partnersとの連携を心待ちにしております。
チジオケ博士 オニア マネージングディレクター, パインクレストヘルスケア株式会社購入理由
- 情報に基づいた意思決定
- 市場動向の理解
- 競合分析
- 顧客インサイト
- 市場予測
- リスク軽減
- 戦略計画
- 投資の正当性
- 新興市場の特定
- マーケティング戦略の強化
- 業務効率の向上
- 規制動向への対応


 無料サンプルを入手 - 灌漑自動化市場