定量的構造活性相関 (QSAR) 市場 - 2031 年の成長予測、統計、事実
過去データ : 2021-2022 | 基準年 : 2023 | 予測期間 : 2023-2031定量的構造活性相関(QSAR)市場規模と予測(2021年 - 2031年)、世界および地域別シェア、トレンド、成長機会分析レポートの対象範囲:アプリケーション別(創薬、分子モデリング、化学スクリーニング、規制および意思決定、その他のアプリケーション)、業界別(医薬品、化粧品、環境、食品および飲料)、および地域
- ステータス : 公開されたデータ
- レポートコード : TIPRE00018665
- カテゴリー : テクノロジー、メディア、通信
- ページ数 : 150
- 利用可能なレポート形式 :


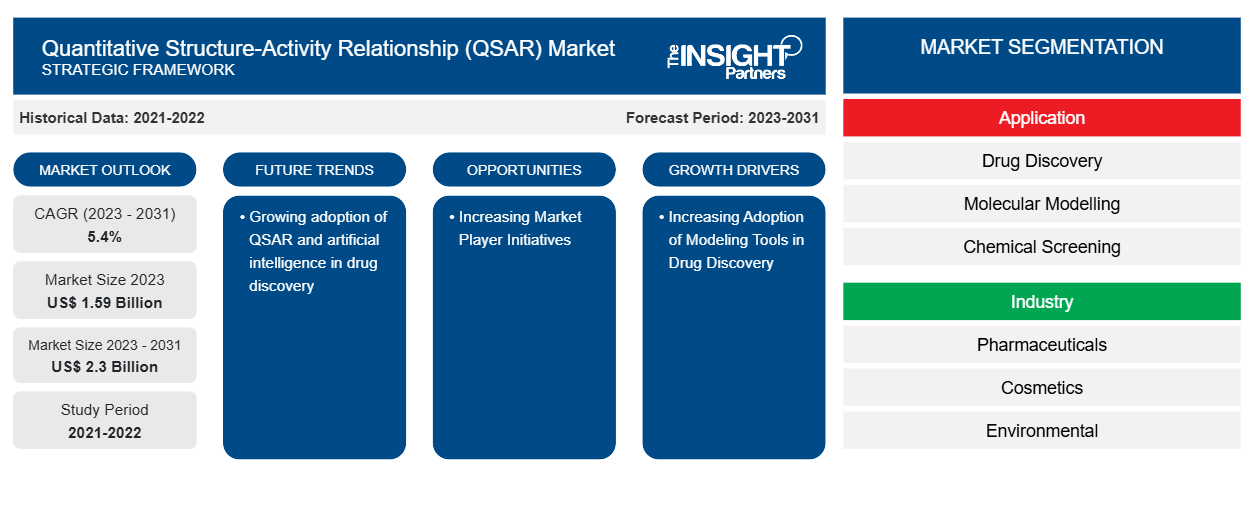
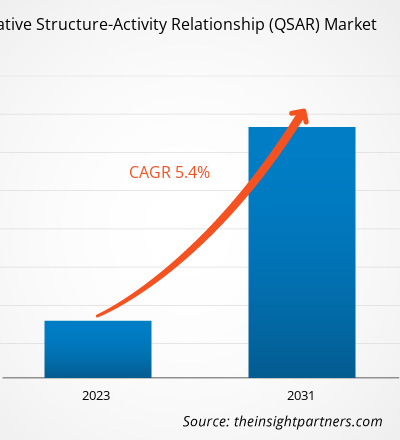
定量的構造活性相関(QSAR)市場規模は、2023年の15億4,000万米ドルから2031年には23億米ドルに達すると予測されています。市場は2023年から2031年にかけて5.4%のCAGRを記録すると予想されています。
医薬品の発見における QSAR と人工知能の採用の増加は、今後も定量的構造活性相関 (QSAR) 市場の重要なトレンドであり続けると思われます。
定量的構造活性相関(QSAR)市場分析
定量的構造活性相関 (QSAR) は、生物学的活性と化合物の構造特性の関係を明らかにするための計算または数学的モデリング手法です。統計的手法を使用して化学構造と活性を相関させようとします。QSAR モデルは、未テストの化学物質の作用の予測など、さまざまな目的に役立ちます。さらに、in silico 手法として目的の生物学的活性を優先順位付けするのに役立ち、in vivo 実験でテストする候補化学物質の数を減らします。市場の成長を牽引している主な要因は、創薬におけるモデリング ツールの採用の増加と、創薬の経済的負担の増加です。ただし、新興国でのこの手法の採用率が低いことが、市場の成長を妨げています。
定量的構造活性相関(概要
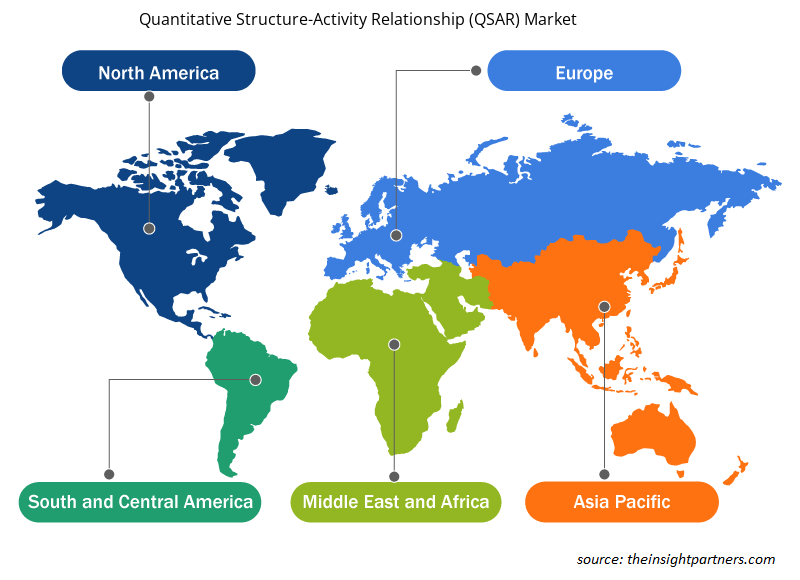
北米は定量的構造活性相関()の最大の市場であり、米国が最大の市場シェアを占め、カナダがそれに続きます。これは、研究開発活動の増加、新興企業の増加、希少疾患や不治の病などをターゲットにした新規で革新的な医薬品候補の開発に対する投資の増加に起因しています。この地域の市場需要は、医療インフラへの政府投資、慢性疾患の蔓延の増加、ビッグデータと健康ITツールの採用の増加などの他の要因により、予測期間中に大幅な成長が見込まれます。
要件に合わせてレポートをカスタマイズする
このレポートの一部、国レベルの分析、Excelデータパックなど、あらゆるレポートを無料でカスタマイズできます。また、スタートアップや大学向けのお得なオファーや割引もご利用いただけます。
定量的構造活性相関(QSAR)市場:戦略的洞察
-
このレポートの主要な市場動向を入手してください。この無料サンプルには、市場動向から見積もりや予測に至るまでのデータ分析が含まれます。
定量的構造活性相関 (QSAR) 市場の推進要因と機会
創薬におけるモデリングツールの採用増加
定量的構造活性相関は、化合物の構造特性と生物学的活性との関係を明らかにするために使用される計算モデリング法です。治療への応用が期待される新薬の発見と開発は複雑で、費用がかかり、時間のかかる事業であるため、QSAR などのさまざまな計算手法が採用され、新薬発見の効率が高められています。ヒットの特定からリードの最適化まで、リガンドや構造ベースの仮想スクリーニングなどの手法は、さまざまな製薬会社で広く使用されています。モデリングの助けを借りて、既存のデータを活用して製品の安全性と有効性に関する洞察を得ることができます。計算方法の効率性により、FDA と EMA は効率的な医薬品開発を実現するために薬物モデリングを取り入れています。
市場プレーヤーの取り組みの増加 - 定量的構造活性相関 (QSAR) 市場における機会
医薬品の発見と開発に携わる企業は、発見のタイムラインを早め、製品の品質を向上させるために、さまざまなビジネス戦略を採用しています。この市場のいくつかのプレーヤーは、革新的なバイオテクノロジー企業、学術界、製薬会社とのコラボレーションに注力し、それぞれのインシリコベースのサービスポートフォリオを強化し、業界での競争力を維持しています。大多数の製薬会社はモデリングソフトウェアの採用によって恩恵を受けており、予測期間中に定量的構造活性相関(QSAR)市場の成長を促進すると予想されています。たとえば、SchrodingerとAgios Pharmaceuticals, Inc.のコラボレーションにより、計算プラットフォームの助けを借りて、FDA承認の治療法が2つ生まれました。
定量的構造活性相関(QSAR)市場レポートのセグメンテーション分析
定量的構造活性相関 (QSAR) 市場分析の導出に貢献した主要なセグメントは、疾患と画像診断法です。
- アプリケーションに基づいて、定量的構造活性相関(QSAR)市場は、創薬、分子モデリング、化学スクリーニング、規制および意思決定、その他のアプリケーションに分類されます。創薬セグメントは、2023年に大きな市場シェアを占めました。
- 業界別に見ると、定量的構造活性相関(QSAR)市場は、医薬品、化粧品、環境、食品、飲料に分類されます。2023年には医薬品セグメントが市場で最大のシェアを占めました。
定量的構造活性相関(QSAR)市場シェア分析(地域別)
定量的構造活性相関 (QSAR) 市場レポートの地理的範囲は、主に北米、アジア太平洋、ヨーロッパ、中東およびアフリカ、南米/中南米の 5 つの地域に分かれています。
北米は定量的構造活性相関(QSAR)市場を支配してきました。米国はQSARの最大の市場です。この市場の成長は、主に、創薬におけるAIの急速な統合、個別化医療への好みの高まり、新しい治療用途に対する高い研究開発費、および米国における主要な市場プレーヤーの存在によって推進されています。さらに、医薬品開発における製薬会社と人工知能技術会社のコラボレーションとパートナーシップの増加が、市場の成長をさらに後押ししています。さらに、製薬業界における人工知能技術に対する認識の高まりは、市場にさまざまな成長の機会をもたらすでしょう。
定量的構造活性相関(QSAR)市場ニュースと最近の動向
定量的構造活性相関 (QSAR) 市場は、重要な企業出版物、関連データ、データベースを含む一次および二次調査後の定性的および定量的データを収集することによって評価されます。以下は、音声および言語障害および戦略の市場における動向のリストです。
- Cresset は、化学構成要素と創薬サービスの大手プロバイダーである Enamine と提携し、創薬の初期プロセスのための革新的な新ソリューションを開発しました。(出典: Cresset、プレスリリース、2024 年)。
- ロイヤル・フリー・ロンドンNHS財団トラストは、ディープマインド・テクノロジーズ(Google)と5年間の提携を結び、急性腎障害の治療法の発見に同社が協力してくれることを期待している。英国の10万ゲノムプロジェクトと呼ばれる国際プロジェクトでは、AIと国民保健サービスにおける珍しい病気の患者のデータを使用している。ロシュ、メルク、バイオジェンもこの取り組みのパートナーである。(出典:ディープマインド・テクノロジーズ、プレスリリース、2020年)。
定量的構造活性相関 (QSAR) 市場の地域別洞察
予測期間を通じて定量的構造活性相関 (QSAR) 市場に影響を与える地域的傾向と要因は、Insight Partners のアナリストによって徹底的に説明されています。このセクションでは、北米、ヨーロッパ、アジア太平洋、中東およびアフリカ、南米および中米にわたる定量的構造活性相関 (QSAR) 市場のセグメントと地理についても説明します。
- 定量的構造活性相関(QSAR)市場の地域別データを入手
定量的構造活性相関(QSAR)市場レポートの範囲
| レポート属性 | 詳細 |
|---|---|
| 2023年の市場規模 | 15億9千万米ドル |
| 2031年までの市場規模 | 23億米ドル |
| 世界のCAGR(2023年~2031年) | 5.4% |
| 履歴データ | 2021-2022 |
| 予測期間 | 2023-2031 |
| 対象セグメント |
アプリケーション別
|
| 対象地域と国 |
北米
|
| 市場リーダーと主要企業プロフィール |
|
定量的構造活性相関(QSAR)市場のプレーヤー密度:ビジネスダイナミクスへの影響を理解する
定量的構造活性相関 (QSAR) 市場は、消費者の嗜好の変化、技術の進歩、製品の利点に対する認識の高まりなどの要因により、エンドユーザーの需要が高まり、急速に成長しています。需要が高まるにつれて、企業は提供品を拡大し、消費者のニーズを満たすために革新し、新たなトレンドを活用し、市場の成長をさらに促進しています。
市場プレーヤー密度とは、特定の市場または業界内で活動している企業または会社の分布を指します。これは、特定の市場スペースに、その市場規模または総市場価値に対してどれだけの競合相手 (市場プレーヤー) が存在するかを示します。
定量的構造活性相関 (QSAR) 市場で事業を展開している主要企業は次のとおりです。
- プロトQSAR SL
- インターテックグループ
- ダッソー・システムズ SE
- ビブラ毒物学アドバイス&コンサルティング株式会社
- ラボラトリー・コーポレーション・オブ・アメリカ・ホールディングス
- レイサムバイオファームグループ
免責事項:上記の企業は、特定の順序でランク付けされていません。
- 定量的構造活性相関(QSAR)市場のトップキープレーヤーの概要を入手
定量的構造活性相関(QSAR)市場レポートの対象範囲と成果物
「定量的構造活性相関(QSAR)市場規模と予測(2023〜2031年)」レポートでは、以下の分野をカバーする市場の詳細な分析を提供しています。
- 対象範囲に含まれるすべての主要市場セグメントの世界、地域、国レベルでの市場規模と予測
- 市場の動向(推進要因、制約、主要な機会など)
- 今後の主な動向
- 詳細なPEST/ポーターの5つの力とSWOT分析
- 主要な市場動向、主要プレーヤー、規制、最近の市場動向を網羅した世界および地域の市場分析
- 市場集中、ヒートマップ分析、主要プレーヤー、最近の動向を網羅した業界の状況と競争分析
- 詳細な企業プロフィール

アンキタは、テクノロジー、メディア、ICT、エレクトロニクス・半導体の各分野で8年以上の経験を持つ、ダイナミックな市場調査およびコンサルティングのプロフェッショナルです。Microsoft、Oracle、NEC、SAP、KPMG、Expeditors Internationalといったグローバルクライアントに対し、100件以上のコンサルティングおよび調査案件を主導・遂行してきました。彼女のコアコンピテンシーは、市場評価、データ分析、予測、戦略策定、競合情報、レポート作成です。
アンキタは、販売前の提案書作成やクライアントとの協議から、販売後の実用的なインサイトの提供まで、プロジェクトサイクル全体を巧みに管理することに長けています。彼女は、部門横断的なチームの管理、複雑な調査モジュールの構築、そしてクライアント固有のビジネス目標に合わせたソリューションの調整に長けています。優れたコミュニケーション能力、リーダーシップ、そしてプレゼンテーション能力により、急速に変化する市場環境において、常に価値主導の成果を生み出しています。
- 過去2年間の分析、基準年、CAGRによる予測(7年間)
- PEST分析とSWOT分析
- 市場規模価値/数量 - 世界、地域、国
- 業界と競争環境
- Excel データセット
お客様の声
Insight PartnersのSCADAシステム市場レポートは包括的で、現在のトレンドと将来の予測に関する貴重な洞察が含まれています。チームは終始、非常にプロフェッショナルで、対応が早く、サポートも充実していました。私たちは彼らのサービスに非常に満足しており、強くお勧めします。
ラン・ケデム パートナー, レアリテクノロジーズ株式会社非常に特殊なソフトウェア市場に関するレポートを依頼したところ、チームは数日でレポートを作成してくれました。情報は非常に関連性が高く、分かりやすくまとめられていました。その後、レポートにいくつか修正と追加を依頼しましたが、チームは非常に迅速に対応し、1週間も経たないうちに最終レポートを受け取ることができました。
ジャン=エルヴェ・ジェン 会長, フューチャー・アナリティカ重要な市場調査と予測のために、The Insight Partnersと協力しました。彼らは機会とリスクに関する明確な洞察を提供し、私たちの計画策定に役立ちました。彼らの調査は使いやすく、確かなデータに基づいており、賢明で自信に満ちた意思決定に役立ちました。彼らを強くお勧めします。
ピユーシュ・ナグパル 上級副社長, ハイビームグローバルInsight Partnersは、深い専門知識に基づき、洞察力に富み、構造化された市場調査を提供しました。チームは終始プロフェッショナルで、対応力も抜群でした。ユーザーフレンドリーなウェブサイトにより、業界レポートへのアクセスもスムーズでした。信頼性の高い高品質な調査サービスをお探しなら、Insight Partnersを強くお勧めします。
安達幸彦 最高経営責任者(CEO), ディープブルーLLC。The Insight Partnersから市場レポートを購入するのは今回が初めてです。最初は不安でしたが、ウェブサイトを見て、リスクを負ってでも購入してみようという気持ちになりました。レポートの品質とカスタマーサービスには大変満足しています。最初のレポートにはいくつか質問やコメントがありましたが、アナリストとメールで何度かやり取りした結果、戦略策定プロセスへのインプットとして活用できるレポートが完成しました。貴重なお時間を割いていただき、貴重な体験をさせていただき、誠にありがとうございました。他の方にもぜひお勧めしたいですし、今後さらに市場データが必要になった際には、まずThe Insight Partnersにご連絡させていただきます。
ジョン・スズキ 社長兼最高経営責任者、取締役, BKテクノロジーズナイジェリアの感染症IVD市場に関する情報提供依頼に対し、ご対応いただいた際、ご尽力とプロフェッショナルな姿勢に深く感謝申し上げます。忍耐強く、的確なアドバイスをいただき、また、最終的に取引成立に至った割引のご提供にも深く感謝申し上げます。今回の最初の出会いで得た強い印象のおかげで、今後もThe Insight Partnersとの連携を心待ちにしております。
チジオケ博士 オニア マネージングディレクター, パインクレストヘルスケア株式会社購入理由
- 情報に基づいた意思決定
- 市場動向の理解
- 競合分析
- 顧客インサイト
- 市場予測
- リスク軽減
- 戦略計画
- 投資の正当性
- 新興市場の特定
- マーケティング戦略の強化
- 業務効率の向上
- 規制動向への対応


 無料サンプルを入手 - 定量的構造活性相関(QSAR)市場