ウェアラブルセンサー市場戦略、トッププレーヤー、成長機会、分析、2031年までの予測
過去データ : 2021-2022 | 基準年 : 2023 | 予測期間 : 2024-2031ウェアラブルセンサー市場の規模と予測(2021年 - 2031年)、世界および地域のシェア、トレンド、成長機会分析レポートの対象範囲:センサータイプ(加速度計、ジャイロスコープ、モーションセンサー、画像センサー、圧力および力センサー、タッチセンサー、位置センサーなど)、アプリケーション(スマートリストウェア、スマートグラス、スマートボディウェア、スマートフットウェアなど)、垂直(コンシューマーエレクトロニクス、ヘルスケア、産業およびエンタープライズ)、および地理
- ステータス : 公開されたデータ
- レポートコード : TIPRE00002908
- カテゴリー : エレクトロニクスおよび半導体
- ページ数 : 150
- 利用可能なレポート形式 :


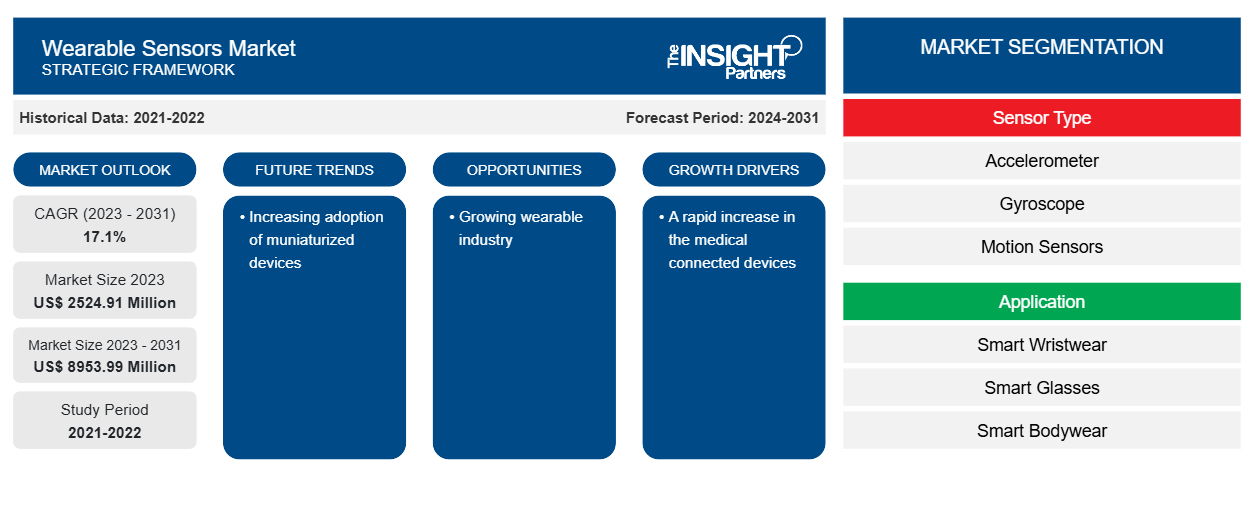
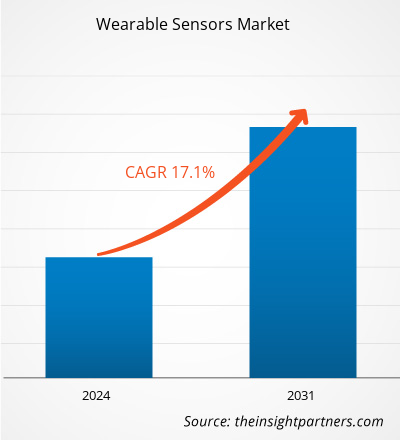
ウェアラブルセンサーの市場規模は、2023年の25億2,491万米ドルから2031年には89億5,399万米ドルに達すると予測されています。市場は2023年から2031年の間に17.1%のCAGRを記録すると予想されています。小型デバイスの採用増加は、引き続き市場の重要なトレンドとなると思われます。
ウェアラブルセンサー市場分析
コネクテッドデバイスやスマートフォンの利用が急増し、性能が向上した低電力、軽量、小型のセンサーに対するニーズが高まっていることが、小型化のトレンドを確立する要因となっています。微細加工とナノテクノロジー 技術の進歩により、小型化プロセスが加速し、スマートファブリックの出現が定着し、スマートセンサーのコスト効率が向上しています。将来的には、アボットラボラトリーズが 2022年1月にグルコースモニタリングシステムであるLibre 3システムを披露しました。このように、ウェアラブルデバイスの需要の高まりが、世界のウェアラブルセンサー市場を牽引しています。
ウェアラブルセンサー市場の概要
ウェアラブルセンサーとは、個人のヘルスケアを目的として、人の皮膚や衣服に直接貼り付けて生体信号を収集するセンサーです。MNPの柔軟な薄膜を適切な基板上に堆積し、温度や圧力を制御して健康信号として利用します。IoT(Internet of Things)技術の導入により、あらゆるものがインターネットにつながるようになり、ウェアラブルデバイスからデータを収集し、人工知能(AI)で解析する仕組みづくりが進んでいます。すでにアイウェア、腕時計、リストバンドなどのウェアラブルデバイスはありますが、最近ではシャツなど毎日着用できるものや、薄膜やエラストマーなどを用いた高感度、多機能、軽量のフレキシブルデバイスの開発が進んでいます。
要件に合わせてレポートをカスタマイズする
このレポートの一部、国レベルの分析、Excelデータパックなど、あらゆるレポートを無料でカスタマイズできます。また、スタートアップや大学向けのお得なオファーや割引もご利用いただけます。
ウェアラブルセンサー市場:戦略的洞察
-
このレポートの主要な市場動向を入手してください。この無料サンプルには、市場動向から見積もりや予測に至るまでのデータ分析が含まれます。
ウェアラブルセンサー市場の推進要因と機会
医療関連機器の急増
デジタルヘルスケアは、ヘルスケアとテクノロジーをつなぐ概念を含む広範な概念です。患者を遠隔で監視する場合、接続された医療機器は重要な要素です。これらの機器は、患者と医療提供者を医療情報でシームレスに接続することで、ヘルスケア業界を真に変革しています。ここ10年ほど、技術の進歩により、患者と医療提供者がコミュニケーションギャップを縮めることができるデジタルヘルスケア機器が登場してきました。接続されたBPなどのスマートフォンアプリは、酸素レベルを監視し、重要なデータを追跡して生成します。接続された機器のほとんどには、リアルタイム監視や高解像度 画像など、さまざまな機能が備わっています。これは、患者の健康の改善に貢献します。デジタルヘルス技術により、患者は世界のどこからでもケアを受けることができます。ウェアラブルセンサーはこのような機器で広く使用されており、ウェアラブルセンサーの市場成長を後押ししています。
成長するウェアラブル産業
スマート モバイル デバイスとモノのインターネット (IoT) は、ユーザーに多くのメリットをもたらし、市場に新たな機会を生み出すため、ウェアラブルの開発を促進してきました。健康的なライフスタイルをサポートする消費者向けウェアラブルから、患者のバイタル サインを管理する医療用ウェアラブルまで、センシング コンポーネントはこれらのウェアラブル テクノロジーを実現し、ユーザーに生産性、安全感、健康促進効果をもたらします。ウェアラブル業界が成長を続けるにつれ、ウェアラブルの適切な長期機能性には、よりコンパクトで正確かつ信頼性の高いセンシング テクノロジーの必要性が高まっています。
ウェアラブルセンサー市場レポートのセグメンテーション分析
ウェアラブル センサー市場分析の導出に貢献した主要なセグメントは、センサーの種類、アプリケーション、垂直です。
- センサーの種類に基づいて、ウェアラブルセンサー市場は、加速度計、ジャイロスコープ、モーションセンサー、画像センサー、圧力および力センサー、タッチセンサー、位置センサー、その他に分類されます。カスタマイズされたセグメントは、2023年に大きな市場シェアを占めました。
- 用途別に見ると、市場はスマートリストウェア、スマートグラス、スマートボディウェア、スマートフットウェアなどに分類されます。
- 垂直別に見ると、市場は民生用電子機器、ヘルスケア、産業およびエンタープライズに分類されます。
ウェアラブルセンサーの地域別市場シェア分析
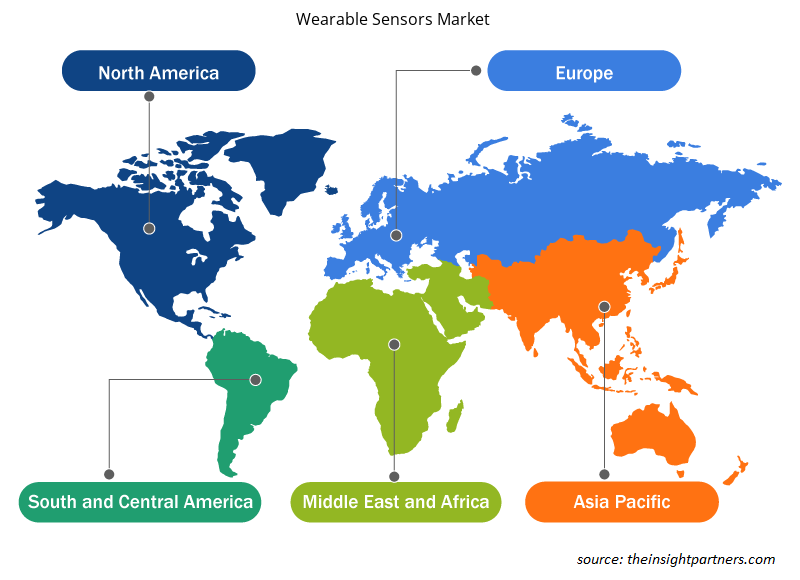
ウェアラブル センサー市場レポートの地理的範囲は、主に北米、アジア太平洋、ヨーロッパ、中東およびアフリカ、南米および中米の 5 つの地域に分かれています。
ウェアラブルセンサー市場は北米が優勢です。GSM協会によると、北米のスマートフォン普及率は2021年に約81%になると予測されています。同協会はまた、約3億2,900万人がモバイルサービスに加入していると述べています。モバイルは経済に貢献し続けており、2021年にはモバイルサービスとテクノロジーが北米のGDPの4.2%を生み出しました。この高い普及率は、インターネットアクセスの普及、高度な通信インフラ、高い生活水準など、さまざまな要因に起因しています。そのため、この地域ではウェアラブルセンサーの需要が高まっています。
ウェアラブルセンサー市場の地域別分析
予測期間を通じてウェアラブル センサー市場に影響を与える地域的な傾向と要因は、Insight Partners のアナリストによって徹底的に説明されています。このセクションでは、北米、ヨーロッパ、アジア太平洋、中東、アフリカ、南米、中米にわたるウェアラブル センサー市場のセグメントと地理についても説明します。
- ウェアラブルセンサー市場の地域別データを入手
ウェアラブルセンサー市場レポートの範囲
| レポート属性 | 詳細 |
|---|---|
| 2023年の市場規模 | 25億2,491万米ドル |
| 2031年までの市場規模 | 89億5,399万米ドル |
| 世界のCAGR(2023年~2031年) | 17.1% |
| 履歴データ | 2021-2022 |
| 予測期間 | 2024-2031 |
| 対象セグメント |
センサータイプ別
|
| 対象地域と国 |
北米
|
| 市場リーダーと主要企業プロフィール |
|
ウェアラブルセンサー市場のプレーヤー密度:ビジネスダイナミクスへの影響を理解する
ウェアラブル センサー市場は、消費者の嗜好の変化、技術の進歩、製品の利点に対する認識の高まりなどの要因により、エンド ユーザーの需要が高まり、急速に成長しています。需要が高まるにつれて、企業は提供内容を拡大し、消費者のニーズを満たすために革新を起こし、新たなトレンドを活用し、市場の成長をさらに促進しています。
市場プレーヤー密度とは、特定の市場または業界内で活動している企業または会社の分布を指します。これは、特定の市場スペースに、その市場規模または総市場価値に対してどれだけの競合相手 (市場プレーヤー) が存在するかを示します。
ウェアラブルセンサー市場で事業を展開している主要企業は次のとおりです。
- テキサス・インスツルメンツ株式会社
- NXPセミコンダクターズ
- アナログ・デバイセズ
- STマイクロエレクトロニクス
- インフィニオンテクノロジーズAG
- センシリオンAG
免責事項:上記の企業は、特定の順序でランク付けされていません。
- ウェアラブルセンサー市場のトップキープレーヤーの概要を入手
ウェアラブルセンサー市場のニュースと最近の動向
ウェアラブル センサー市場は、主要な企業出版物、協会データ、データベースなどの一次調査と二次調査後の定性的および定量的データを収集することによって評価されます。ウェアラブル センサー市場におけるいくつかの開発を以下に示します。
- Signify は、最近開通した Ahmed Hamdy 2 トンネルに LED 照明を設置すると発表しました。Signify は、国際規格に適合した最新の照明システムを使用して、照明のリモート制御を可能にしながら、最大 70% のエネルギー節約を実現します。(出典: Signify、プレスリリース、2021 年 10 月)
- タングスラムグループは12月にスペインの「トレスポンツトンネル」の照明工事契約を締結した。このプロジェクトは、ブダペストを拠点とする同社が2020年にスペインで受注した6件目のトンネル照明契約となり、コロナウイルスのパンデミックによる経済的困難を考慮すると大きな成果である。(出典:タングスラムグループ、プレスリリース、2022年9月)
ウェアラブルセンサー市場レポートの対象範囲と成果物
「ウェアラブルセンサー市場規模と予測(2021〜2031年)」レポートでは、以下の分野をカバーする市場の詳細な分析を提供しています。
- ウェアラブルセンサー市場の規模と予測(世界、地域、国レベルで)
- ウェアラブルセンサー市場の動向、推進要因、制約、主要な機会などの市場動向
- 詳細なPEST/ポーターの5つの力とSWOT分析
- ウェアラブルセンサー市場分析では、主要な市場動向、世界および地域の枠組み、主要プレーヤー、規制、最近の市場動向を取り上げています。
- ウェアラブルセンサー市場の市場集中、ヒートマップ分析、主要プレーヤー、最近の動向を網羅した業界展望と競争分析
- 詳細な企業プロフィール

Naveenは、カスタム、シンジケート、コンサルティングの各プロジェクトにおいて9年以上の実績を持つ、経験豊富な市場調査およびコンサルティングのプロフェッショナルです。現在はアソシエイトバイスプレジデントを務め、プロジェクトバリューチェーン全体にわたるステークホルダー管理を成功させ、100件以上の調査レポートと30件以上のコンサルティング案件を執筆しています。産業および政府機関のプロジェクトに幅広く携わり、クライアントの成功とデータに基づく意思決定に大きく貢献しています。
Naveenは、カルナータカ州VTUで電子通信工学の学位を取得し、マニパル大学でマーケティング&オペレーションズのMBAを取得しています。IEEEの会員として9年間活動し、会議や技術シンポジウムへの参加、セクションレベルおよび地域レベルでのボランティア活動に積極的に取り組んでいます。現職以前は、IndustryARCでアソシエイト戦略コンサルタント、Hewlett Packard(HP Global)で産業用サーバーコンサルタントを務めていました。
- 過去2年間の分析、基準年、CAGRによる予測(7年間)
- PEST分析とSWOT分析
- 市場規模価値/数量 - 世界、地域、国
- 業界と競争環境
- Excel データセット
お客様の声
Insight PartnersのSCADAシステム市場レポートは包括的で、現在のトレンドと将来の予測に関する貴重な洞察が含まれています。チームは終始、非常にプロフェッショナルで、対応が早く、サポートも充実していました。私たちは彼らのサービスに非常に満足しており、強くお勧めします。
ラン・ケデム パートナー, レアリテクノロジーズ株式会社非常に特殊なソフトウェア市場に関するレポートを依頼したところ、チームは数日でレポートを作成してくれました。情報は非常に関連性が高く、分かりやすくまとめられていました。その後、レポートにいくつか修正と追加を依頼しましたが、チームは非常に迅速に対応し、1週間も経たないうちに最終レポートを受け取ることができました。
ジャン=エルヴェ・ジェン 会長, フューチャー・アナリティカ重要な市場調査と予測のために、The Insight Partnersと協力しました。彼らは機会とリスクに関する明確な洞察を提供し、私たちの計画策定に役立ちました。彼らの調査は使いやすく、確かなデータに基づいており、賢明で自信に満ちた意思決定に役立ちました。彼らを強くお勧めします。
ピユーシュ・ナグパル 上級副社長, ハイビームグローバルInsight Partnersは、深い専門知識に基づき、洞察力に富み、構造化された市場調査を提供しました。チームは終始プロフェッショナルで、対応力も抜群でした。ユーザーフレンドリーなウェブサイトにより、業界レポートへのアクセスもスムーズでした。信頼性の高い高品質な調査サービスをお探しなら、Insight Partnersを強くお勧めします。
安達幸彦 最高経営責任者(CEO), ディープブルーLLC。The Insight Partnersから市場レポートを購入するのは今回が初めてです。最初は不安でしたが、ウェブサイトを見て、リスクを負ってでも購入してみようという気持ちになりました。レポートの品質とカスタマーサービスには大変満足しています。最初のレポートにはいくつか質問やコメントがありましたが、アナリストとメールで何度かやり取りした結果、戦略策定プロセスへのインプットとして活用できるレポートが完成しました。貴重なお時間を割いていただき、貴重な体験をさせていただき、誠にありがとうございました。他の方にもぜひお勧めしたいですし、今後さらに市場データが必要になった際には、まずThe Insight Partnersにご連絡させていただきます。
ジョン・スズキ 社長兼最高経営責任者、取締役, BKテクノロジーズナイジェリアの感染症IVD市場に関する情報提供依頼に対し、ご対応いただいた際、ご尽力とプロフェッショナルな姿勢に深く感謝申し上げます。忍耐強く、的確なアドバイスをいただき、また、最終的に取引成立に至った割引のご提供にも深く感謝申し上げます。今回の最初の出会いで得た強い印象のおかげで、今後もThe Insight Partnersとの連携を心待ちにしております。
チジオケ博士 オニア マネージングディレクター, パインクレストヘルスケア株式会社購入理由
- 情報に基づいた意思決定
- 市場動向の理解
- 競合分析
- 顧客インサイト
- 市場予測
- リスク軽減
- 戦略計画
- 投資の正当性
- 新興市場の特定
- マーケティング戦略の強化
- 業務効率の向上
- 規制動向への対応


 無料サンプルを入手 - ウェアラブルセンサー市場