영양바 시장 규모, 점유율 및 2034년까지의 전망
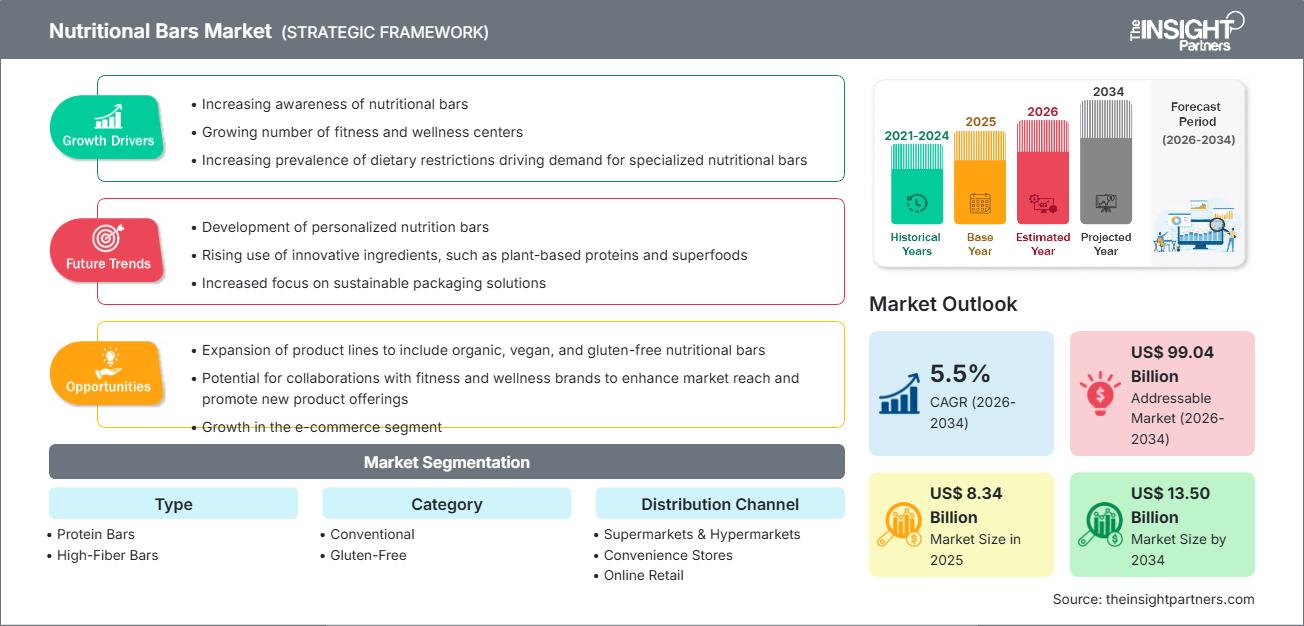
이전 데이터 : 2021-2024 | 기준 연도 : 2025 | 예측 기간 : 2026-2034영양바 시장 규모 및 전망(2021년~2034년), 글로벌 및 지역별 점유율, 트렌드 및 성장 기회 분석 보고서 내용: 유형별(단백질바, 고섬유질바, 기타), 카테고리별(일반 및 글루텐프리), 유통 채널별(슈퍼마켓 및 대형마트, 편의점, 온라인 소매, 기타)
- 상태 : 데이터 공개
- 보고서 코드 : TIPRE00022477
- 범주 : 음식 및 음료
- 페이지 수 : 150
- 사용 가능한 보고서 형식 :


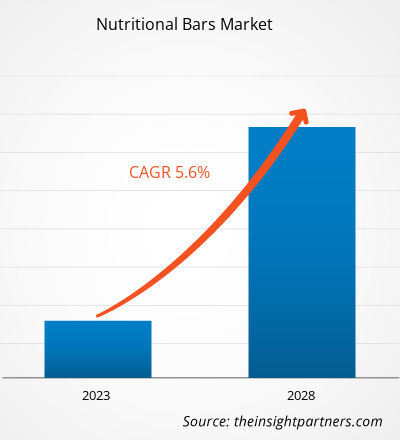
전 세계 영양바 시장 규모는 2025년 83억 4천만 달러에서 2034년 135억 달러에 이를 것으로 전망됩니다. 2026년부터 2034년까지 연평균 성장률(CAGR)은 5.5%에 달할 것으로 예상됩니다. 주요 시장 동향으로는 단백질 강화 및 기능성 스낵에 대한 전 세계적인 관심 증가, 고섬유질 식단의 신진대사 개선 효과에 대한 소비자 인식 제고, 그리고 클린 라벨 및 식물성 원료 제품에 대한 수요 증가 등이 있습니다. 또한, 케토 및 팔레오 다이어트의 인기 상승, 신흥 경제국의 피트니스 및 웰니스 소매 채널 확대, 그리고 임상 영양 및 스포츠 퍼포먼스와 같은 고부가가치 건강 분야에서 영양바의 활용도 증가도 시장 성장에 기여할 것으로 기대됩니다.
영양바 시장 분석
영양바 시장 분석에 따르면 소비자들이 주요 영양소 균형과 투명한 원료 사용을 중시함에 따라 고부가가치 기능성 스낵으로의 전환이 나타나고 있습니다. 조달 동향은 시장이 대량 생산되는 기존 단백질 바와 고성장 잠재력을 지닌 알레르기 유발 성분 미함유 및 글루텐 프리 틈새 시장으로 분화되고 있음을 보여줍니다. 특히, 저혈당 지수와 고품질 지방 공급원을 통해 기존의 고당도 스낵 대비 확실한 경쟁 우위를 확보할 수 있는 특수 식사 대용 바 및 케토 다이어트용 바 시장에서 전략적 기회가 창출되고 있습니다. 또한, 시장 확장은 식물성 단백질 특유의 향을 가리는 혁신적인 향료 개발과 "프레시 바" 형태를 위한 효율적인 온도 관리 공급망 구축에 달려 있다고 분석은 지적합니다. 이제 경쟁력 차별화는 스토리텔링 기반의 브랜딩, 비유전자변형(Non-GMO) 원료 사용, 지속 가능한 포장, 투명한 공급망을 강조하는 데 달려 있습니다. 이러한 접근 방식은 건강에 민감한 소비자들이 넘쳐나는 시장에서 제조업체가 프리미엄 가격을 책정하는 데 도움이 됩니다.
영양바 시장 개요
영양바는 틈새 시장의 운동 보조 식품에서 주류 라이프스타일 제품으로 진화했습니다. 현재 영양바는 기능성 식이섬유 바, 두뇌 건강 증진 성분(노트로픽)을 함유한 바, 소아용 영양바 등 다양한 형태로 출시되고 있습니다. 글로벌 식품 기업과 D2C 스타트업 모두 유청, 완두콩, 귀뚜라미 등 다양한 단백질 원료를 사용하여 이 시장에서 경쟁하고 있습니다. 북미와 유럽에서 건강에 관심 있는 소비자들이 간편한 식사 대용 제품을 찾는 수요가 증가하면서, 영양바는 휴대하기 편리한 웰빙 솔루션으로 인기를 얻고 있습니다. 북미는 탄탄한 피트니스 문화 덕분에 매출 면에서 선두를 달리고 있으며, 아시아 태평양 지역은 원료 혁신과 소매 유통망 확대를 통해 성장하고 있습니다. 미국 시장은 건강에 관심 있는 밀레니얼 세대와 기능성 스낵의 폭넓은 보급에 힘입어 가장 발달된 시장입니다. 브랜드 간 경쟁이 심화되면서 더욱 다양한 맛을 선보이고 있으며, 콜라겐, 중쇄지방산(MCT) 오일, 고대 곡물과 같은 슈퍼푸드를 첨가하는 제품들도 늘어나고 있습니다.
이 보고서를 귀하의 요구사항에 맞게 맞춤 설정하십시오.
무료 맞춤 제작 서비스를 받으세요영양바 시장: 전략적 분석
-
이 보고서에서 주요 시장 동향을 확인하세요.이 무료 샘플에는 시장 동향부터 추정치 및 예측에 이르기까지 다양한 데이터 분석이 포함됩니다.
영양바 시장 동인 및 기회
시장 동인:
- 이동 중에도 간편하게 섭취할 수 있는 기능성 영양식에 대한 수요 증가: 도시인들의 바쁜 생활 방식 때문에 휴대하기 편리하고 영양이 풍부한 바 형태의 제품이 전통적인 식사를 대체하는 선호도가 높아지면서 모든 연령대에서 판매량이 증가하고 있습니다.
- 피트니스 및 보디빌딩의 대중화: 헬스장 회원권 증가와 홈 피트니스 트렌드 확산으로 단백질 함량이 높은 제품에 대한 수요가 지속적으로 높았으며, 소비자들은 고성능 제품으로 눈을 돌리고 있습니다.
- 전자상거래 및 구독 모델의 급속한 확장: 온라인 소매업은 틈새 브랜드에게 매장 진열 공간의 장벽을 없앴습니다. 이는 특히 북미와 유럽에서 비건, 무두소이 등 특수 목적의 에너지바가 빠르게 보급되는 현상에서 두드러지게 나타납니다.
시장 기회:
- 임상 및 노인 영양 분야로의 확장: 운동 기구를 넘어, 영양 바는 노인과 질병 회복 중인 사람들을 위해 특별히 제조된 비타민과 미네랄을 전달하는 중요한 수단으로서 상당한 가능성을 제공합니다.
- 아시아 태평양 및 중동/아프리카 신흥 시장의 성장: 서구 브랜드와 중국, 인도, 아랍에미리트의 현지 유통업체 간의 전략적 파트너십 구축은 프리미엄 스낵이 사회적 지위를 나타내는 고마진 시장 진출을 용이하게 할 수 있습니다.
- 지속 가능하고 재활용 가능한 원료로의 다각화: 생산자들은 재활용 원료와 플라스틱이 없는 퇴비화 가능한 포장재를 사용하여 환경을 중시하는 Z세대 소비자를 공략할 수 있는 기회를 확대하고 있습니다.
영양바 시장 보고서 세분화 분석
영양바 시장 점유율은 시장 구조, 성장 잠재력 및 새로운 트렌드를 보다 명확하게 이해할 수 있도록 다양한 부문에 걸쳐 분석됩니다. 아래는 대부분의 산업 보고서에서 사용되는 표준 시장 세분화 방식입니다.
유형별:
- 단백질 바: 운동선수와 포만감 및 근육 회복 솔루션을 찾는 소비자들이 주도하는 주요 시장 부문입니다.
- 고섬유질 바: 소화 건강, 체중 관리 및 꾸준한 에너지 공급에 중점을 둔 빠르게 성장하는 틈새 시장입니다.
카테고리별:
- 글루텐프리: 전 세계적인 알레르기 유발 물질 제거 트렌드에 발맞춰 빠르게 성장하는 시장으로, 셀리악병이나 글루텐 민감증이 있는 소비자들이 점점 더 선호하고 있습니다.
- 기존 방식: 대량 생산을 주도하는 주요 방식으로, 대중 시장 스낵 부문에서 확립된 공급망과 비용 효율성의 이점을 누립니다.
유통 채널별:
- 슈퍼마켓 및 대형마트: 가정용품 구매의 주요 유통 채널로 남아 있으며, "건강 및 웰빙" 코너의 확대로 혜택을 보고 있습니다.
- 온라인 소매: 가장 빠르게 성장하는 채널로, D2C 브랜드가 전 세계 고객에게 도달하고 구독 기반 대량 구매를 제공할 수 있도록 합니다.
- 편의점: 도시 및 교통 중심지에서 즉흥적인 구매나 간단한 물품 구매를 위한 중요한 접점을 제공합니다.
지리학별:
- 북아메리카
- 유럽
- 아시아 태평양
- 남미 및 중앙아메리카
- 중동 및 아프리카
영양바 시장 지역별 분석
주요 지역별로 영양바 시장에 영향을 미치는 지역별 트렌드를 분석했습니다.
영양바 시장 보고서 범위
| 보고서 속성 | 세부 |
|---|---|
| 2025년 시장 규모 | 83억 4천만 달러 |
| 2034년 시장 규모 | 135억 달러 |
| 글로벌 연평균 성장률(2026년~2034년) | 5.5% |
| 역사적 데이터 | 2021-2024 |
| 예측 기간 | 2026-2034 |
| 포함되는 부문 |
유형별로
|
| 대상 지역 및 국가 |
북아메리카
|
| 시장 선도 기업 및 주요 기업 프로필 |
|
영양바 시장 참여자 밀도: 비즈니스 역학에 미치는 영향 이해
영양바 시장은 소비자 선호도 변화, 기술 발전, 제품 효능에 대한 인식 제고 등 여러 요인으로 최종 사용자 수요가 증가하면서 빠르게 성장하고 있습니다. 수요 증가에 따라 기업들은 제품군을 확장하고, 소비자 요구를 충족하기 위한 혁신을 추진하며, 새로운 트렌드를 활용하여 시장 성장을 더욱 촉진하고 있습니다.
지역별 영양바 시장 점유율 분석
현재 북미가 시장을 선도하고 있으며, 아시아 태평양 지역은 향후 몇 년 동안 가장 빠른 성장세를 보일 것으로 예상됩니다. 중동 및 아프리카의 신흥 시장 또한 프리미엄 기능성 스낵 제조업체가 시장 점유율을 확대할 수 있는 잠재력이 풍부합니다.
1. 북미
- 시장 점유율: 깊이 뿌리내린 간식 문화와 예방적 건강에 대한 높은 관심에 힘입어 전 세계에서 가장 큰 시장 점유율을 차지하고 있습니다.
-
주요 동인:
- 소비자들이 체중 관리와 신진대사 건강 증진을 위해 고단백 저당 식단을 선호하는 경향이 증가하고 있다.
- 제너럴 밀스와 심플리 굿 푸즈와 같은 시장 선도 기업들의 강력한 입지는 탄탄한 유통 및 마케팅 네트워크를 제공합니다.
- 식물성 콜라겐과 어댑토젠 같은 혁신적인 성분을 조기에 도입하여 단순한 포만감을 넘어 "웰빙"을 추구했습니다.
- 트렌드: 케토 인증 제품의 규모 확대와 냉장 보관되는 "신선한" 바 형태의 제품이 성공적으로 도입되어 식료품점 가장자리에서 쇼핑하는 "자연식품" 소비자의 취향을 사로잡고 있습니다.
2. 유럽
- 시장 점유율: 엄격한 라벨링 규정과 유기농 및 비유전자변형 영양 간식에 대한 높은 수요에 힘입어 상당한 시장 점유율을 차지하고 있습니다.
-
주요 동인:
- 영국과 독일을 중심으로 비건 및 채식주의 생활 방식에 대한 인식이 높아지면서 식물성 단백질 바의 판매량이 급증하고 있습니다.
- 탄탄한 피트니스 인프라와 사이클링, 하이킹과 같은 야외 지구력 스포츠의 오랜 전통.
- 식품 안전과 투명성을 강조함으로써 현지에서 생산된 "클린 라벨" 브랜드에 대한 소비자 신뢰를 높였습니다.
- 동향: 환경 목표를 달성하기 위해 설탕 감축 기술과 잠두, 루핀과 같은 지속 가능한 유럽산 단백질 공급원 사용으로 전략적 전환이 이루어지고 있습니다.
3. 아시아 태평양
- 시장 점유율: 가장 빠르게 성장하는 지역으로, 중국과 일본이 '이너 뷰티' 및 기능성 스낵의 도입을 주도하고 있습니다.
-
주요 동인:
- 급격한 도시화와 편리함과 건강을 제공하는 서구화된 라이프스타일 제품을 추구하는 중산층의 증가.
- 정부 지원 보건 사업(특히 중국과 인도에서)은 당뇨병과 비만과 같은 생활습관병의 증가에 대처하기 위한 것입니다.
- 헬스장 및 요가 스튜디오 회원권 증가로 휴대가 간편한 운동 후 단백질 보충제에 대한 수요가 급증하는 피트니스 문화가 빠르게 성장하고 있습니다.
- 트렌드: 티몰, JD.com과 같은 전자상거래 플랫폼에 대한 의존도가 높고, 말차, 인삼, 구기자 등의 전통 지역 재료를 서구화된 바 형태에 접목하는 경향이 두드러진다.
4. 남미 및 중앙아메리카
- 시장 점유율: 브라질이 상당한 지역 시장 점유율을 차지하는 신흥 시장입니다.
-
주요 동인:
- 도시화가 가속화되고 생활 속도가 빨라짐에 따라 대도시의 직장인들에게는 이동 중에 간편하게 먹을 수 있는 간식이 필수품이 되었습니다.
- 스포츠 및 국가 차원의 운동 경기 참여 증가로 에너지 및 단백질 함량이 높은 에너지바에 대한 수요가 증가하고 있습니다.
- 고소득층 사이에서 지중해식 식단에 대한 선호도가 높아지고 있으며, 열대 과일과 천연 감미료로 만든 에너지바를 선호하는 경향이 나타나고 있다.
- 트렌드: "농장에서 식탁까지"를 지향하는 부티크 브랜드의 성장과 아사이, 둘세 데 레체와 같은 지역 특색을 살린 맛을 도입하여 해외 수입품과 경쟁하는 추세.
5. 중동 및 아프리카
- 시장 점유율: GCC 국가(사우디아라비아, 아랍에미리트)에서 상당한 성장세를 보이는 개발 도상 시장입니다.
-
주요 동인:
- 사우디 비전 2030과 같은 국가 보건 목표와의 전략적 연계는 삶의 질 향상과 활동적인 생활 방식 장려를 목표로 합니다.
- 젊고 기술에 능숙한 인구와 많은 외국인 거주자 커뮤니티 사이에서 영양이 풍부한 간식에 대한 수요가 높습니다.
- 걸프 지역 전역의 대형마트 내에 현대적인 소매 채널과 전문 "헬스 존"을 확대합니다.
- 트렌드: 열에 민감한 제품을 처리하기 위한 현대적인 물류 시스템 도입과 운동선수 및 소아 환자층을 모두 만족시키는 고단백 "상온 보관 가능" 제품 개발에 대한 집중.
높은 시장 밀도와 경쟁
Mars Inc(Kind LLC), General Mills, Kellogg Co.와 같은 기존 선두 기업들의 존재로 경쟁이 심화되고 있습니다. Simply Good Foods와 Clif Bar & Co. 같은 지역 혁신 기업과 Perfect Bar LLC, Rise Bar 같은 북미 틈새 시장 공략 기업들도 다양하고 빠르게 확장되는 시장 환경에 기여하고 있습니다. 이러한 경쟁 환경으로 인해 공급업체들은 다음과 같은 방식으로 차별화를 꾀하고 있습니다.
- 프리미엄화 및 기능성 브랜딩: 클린 라벨 원료와 고품질 단백질 공급원을 강조하여 에너지바를 우수한 영양 도구로 포지셔닝합니다.
- 제품 다양화: "초콜릿 땅콩"을 넘어 짭짤한 맛, 계절별 한정판, 저포드맵(low-FODMAP) 식단과 같은 특정 식이 요구 사항을 충족하는 제품 등을 포함합니다.
- 공급망 투명성: 농장에서 조달한 원료부터 윤리적 기준을 충족하는 지속 가능한 제조에 이르기까지 전체 프로세스를 관리합니다.
기회와 전략적 움직임
- 건강한 노화 및 근감소증 예방: 인구 구조 변화를 활용하여 60세 이상 인구를 대상으로 근육 유지 및 소화 건강 증진에 도움이 되는 고단백, 식이섬유 강화 바를 마케팅하십시오.
- 전자상거래 및 DTC(직접 소비자 판매) 확장: 직접 소비자 판매(DTC) 모델과 구독 서비스를 활용하여 기존 소매 유통망의 장벽을 우회하고, 소규모 브랜드가 개별적인 맛과 영양 선호도에 맞춘 맞춤형 "픽앤믹스" 박스를 제공할 수 있도록 지원합니다.
영양바 시장에서 활동하는 주요 기업은 다음과 같습니다.
- 심플리 굿 푸즈 컴퍼니
- 클리프 바 & 코
- 제너럴 밀스 주식회사
- 켈로그 주식회사
- 라이즈 바 주식회사
- 퀘이커 오츠 회사
- 퍼펙트 바 LLC
- 마스 주식회사
- 카인드 LLC
면책 조항: 위에 나열된 회사들은 특정 순서대로 순위가 매겨진 것이 아닙니다.
영양바 시장 뉴스 및 최근 동향
- 2026년 1월, 자이더스 웰니스(Zydus Wellness)의 라이트바이트 맥스 프로틴(RiteBite Max Protein)은 익숙한 웨이퍼 형태에 10g의 단백질과 전통적인 곡물을 결합한 새로운 기장 기반 웨이퍼 단백질 바 제품군을 출시했습니다. 이번 출시는 일상적으로 즐길 수 있는 가볍고 간편한 단백질 간식에 대한 소비자 수요 변화를 반영하며, 영양 바 시장의 혁신을 뒷받침합니다.
- 2025년 10월, Ready®는 The Vitamin Shoppe®와 전국적인 소매 파트너십을 체결하고 자사의 베스트셀러 단백질 바를 미국 내 640개 이상의 매장과 온라인에서 판매한다고 발표했습니다. 이번 출시에는 독점 판매되는 신제품 아이스 오트밀 쿠키 맛이 포함되어 있으며, 이를 통해 Ready®는 빠르게 성장하는 기능성 단백질 바 시장에서의 입지를 강화하게 되었습니다.
영양바 시장 보고서 범위 및 제공 내용
"영양바 시장 규모 및 전망(2021~2034)" 보고서는 다음과 같은 영역을 포함하여 시장에 대한 자세한 분석을 제공합니다.
- 본 보고서는 전 세계, 지역 및 국가별 영양바 시장 규모 및 전망을 주요 시장 부문별로 분석합니다.
- 영양바 시장 동향과 더불어 시장 동인, 제약 요인, 주요 기회 등의 시장 역학을 분석합니다.
- 상세한 PEST 및 SWOT 분석
- 영양바 시장 분석은 주요 시장 동향, 글로벌 및 지역별 시장 환경, 주요 업체, 규제 및 최근 시장 발전을 다룹니다.
- 본 보고서는 영양바 시장의 시장 집중도, 히트맵 분석, 주요 업체 및 최근 동향을 포함한 산업 환경 및 경쟁 분석을 제공합니다.
- 상세 기업 프로필

- 과거 분석(2년), 기준 연도, CAGR을 포함한 예측(7년)
- PEST 및 SWOT 분석
- 시장 규모 가치/거래량 - 글로벌, 지역, 국가
- 산업 및 경쟁 환경
- Excel 데이터세트
사용 후기
Insight Partners의 SCADA 시스템 시장 보고서는 포괄적이며, 현재 동향과 미래 전망에 대한 귀중한 통찰력을 제공합니다. 팀은 매우 전문적이고, 신속하게 대응하며, 처음부터 끝까지 지원해 주었습니다. 저희는 매우 만족하며 Insight Partners의 서비스를 적극 추천합니다.
란 케뎀 파트너, Reali Technologies LTDs아주 구체적인 소프트웨어 시장에 대한 보고서를 요청했는데, 팀에서 며칠 만에 보고서를 작성해 주셨습니다. 정보는 매우 관련성이 높고 잘 정리되어 있었습니다. 그 후 보고서에 몇 가지 수정과 추가 사항을 요청했습니다. 팀원들의 응답도 매우 빨랐고, 일주일도 채 되지 않아 최종 보고서를 받았습니다.
장-에르브 젠 의장, 퓨처 애널리티카The Insight Partners와 함께 중요한 시장 조사 및 예측 작업을 진행했습니다. Insight Partners는 기회와 위험에 대한 명확한 통찰력을 제공하여 계획을 세우는 데 큰 도움이 되었습니다. The Insight Partners의 조사는 사용하기 쉬웠고, 탄탄한 데이터를 기반으로 했습니다. 덕분에 현명하고 자신 있는 결정을 내릴 수 있었습니다. The Insight Partners를 강력 추천합니다.
피유시 나그팔 수석 부사장, 하이빔 글로벌Insight Partners는 탄탄한 분야 전문성을 바탕으로 통찰력 있고 체계적인 시장 조사를 제공했습니다. Insight Partners 팀은 처음부터 끝까지 전문적이고 신속하게 대응했습니다. 사용자 친화적인 웹사이트 덕분에 업계 보고서에 쉽게 접근할 수 있었습니다. 신뢰할 수 있고 고품질의 조사 서비스를 원하신다면 Insight Partners를 강력 추천합니다.
아다치 유키히코 대표이사, 딥블루 주식회사The Insight Partners에서 시장 보고서를 구매한 것은 이번이 처음입니다. 처음에는 확신이 없었지만, 웹사이트를 방문하고 나서 위험을 감수하고 시장 보고서를 구매하는 것이 더 편하다는 것을 알게 되었습니다. 보고서의 품질과 고객 서비스에 매우 만족합니다. 처음 보고서를 보고 몇 가지 질문과 의견이 있었지만, 분석가와 이메일로 몇 차례 대화를 나눈 후, 전략 기획 과정에 참고할 수 있는 보고서를 확보했다고 생각합니다. 시간을 내어 긍정적인 경험을 선사해 주셔서 정말 감사합니다. 다른 사람들에게도 귀사의 서비스를 적극 추천할 것이며, 추가적인 시장 데이터가 필요할 때면 가장 먼저 귀사에 연락하겠습니다.
존 스즈키 사장 겸 최고 경영자, 이사회 이사, BK 테크놀로지스나이지리아 감염성 질환 IVD 시장 관련 정보 요청에 응해 주신 귀사의 지원과 전문성에 감사드립니다. 귀사의 인내심과 지도, 그리고 할인 혜택을 기꺼이 제공해 주셔서 결국 계약을 성사시킬 수 있었습니다. 첫 만남을 통해 귀사가 저에게 심어주신 좋은 인상을 바탕으로 앞으로도 The Insight Partners와 함께할 수 있기를 기대합니다.
치지오케 박사 오니아 전무이사, 파인크레스트 헬스케어 유한회사구매 이유
- 정보에 기반한 의사 결정
- 시장 역학 이해
- 경쟁 분석
- 고객 인사이트
- 시장 예측
- 위험 완화
- 전략 기획
- 투자 타당성 분석
- 신흥 시장 파악
- 마케팅 전략 강화
- 운영 효율성 향상
- 규제 동향에 발맞춰 대응


 무료 샘플 받기 - 영양바 시장