Asia Pacific Diagramming Software Market to Grow at a CAGR of 11.9% to reach US$ 356.26 million from 2021 to 2028

Asia Pacific Diagramming Software Market Forecast to 2028 - COVID-19 Impact and Regional Analysis By Deployment Type (Cloud and On-Premises), Enterprise Size (Small & Medium-Size Enterprises and Large Enterprises), and Application (Educational Institutions, Corporates, and Personal)

  • Report Code : TIPRE00025753
  • Category : Technology, Media and Telecommunications
  • Status : Published
  • No. of Pages : 72
Buy Now

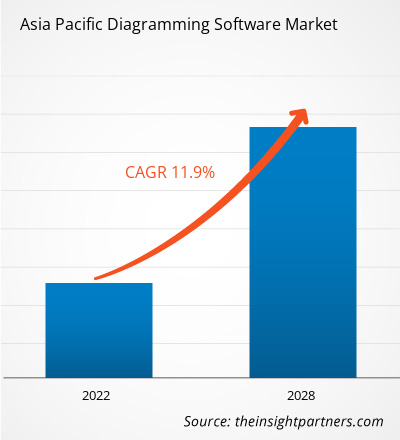
The diagramming software market in APAC is expected to grow from US$ 162.61 million in 2021 to US$ 356.26 million by 2028; it is estimated to grow at a CAGR of 11.9% from 2021 to 2028.

China, Japan, and India are major economies in APAC. Rising adoption of cloud-based diagramming software across organizations is the major factor driving the growth of the APAC diagramming software market. Owing to the rise in industrialization and globalization initiatives in several countries, business activities are growing across all industries. Additionally, it has been observed that more than 75% of enterprises are planning to adopt digital transformation to have business recovery out of 2020. The enterprises are looking ahead to adopt cost-effective and collaborative solutions to accomplish their pre-determined digital goals. For instance, penetration of free and cloud-based platforms such as diagramming software is expected to gain high momentum. The cloud-based platform assists teams to track, collaborate, and possibly manage workflows. The diagramming solutions enable the end users to automate the management approval workflow process for business and release complete transparency. For instance, Nulab, Inc. offers Cacoo – a cloud-based online diagramming solution. The solution connects processes and individuals throughout customers, internal departments, suppliers, and vendors to communication workflows and hierarchy in a diagrammatic format. Therefore, diagramming software contributes positively to achieving the various organizational goals such as communication and presentations. By migrating the diagramming solutions on the cloud, the enterprises are experiencing numerous benefits while propelling the speed of diagramming and reducing internal and external costs. This aspect of reducing costs and accelerating diagram approvals is influencing the adoption of cloud-based diagramming solutions across enterprises, thereby driving the APAC market.

The COVID-19 pandemic has severely impacted APAC due to wide disease spread. Countries in this region are among the highly populated countries in the world, which leads to a greater risk of infection spread. Many global brands and technology companies are headquartered in APAC. According to the Organization for Economic Co-operation and Development (OECD), the pandemic has adversely affected major economies such as China, India, Australia, and Japan, which are experiencing inflation. The rapid COVID-19 outbreak led to strict lockdowns across the region since the starting of 2020.Though the region experienced a dip in technological investments in the initial stage of the outbreak owing to the standstill of all economic activities, the demand for cloud-based diagramming solutions across enterprises is increasing eventually with the rise in work from home culture across the region. This drive the adoption of diagramming solutions for better communication among teams and collaboration through platforms, such as Zoom and Google Meet. Thus, the diagramming software market is experiencing a positive impact of the pandemic.
APAC diagramming software market

  • Sample PDF showcases the content structure and the nature of the information with qualitative and quantitative analysis.

APAC Diagramming Software Market Segmentation       

APAC Diagramming Software Market – By Deployment Type

  • Cloud
  • On-Premises

APAC Diagramming Software Market – By Enterprise Size

  • SMEs
  • Large Enterprises

APAC Diagramming Software Market – By Application

  • Corporates
  • Educational Institutions
  • Personal

APAC Diagramming Software Market– By Country

  • China
  • Japan
  • South Korea
  • India
  • Australia
  • Rest of APAC

APAC Diagramming Software Market-Companies Mentioned

  • CREATELY (CINERGIX PTY LTD)
  • Edrawsoft
  • Gliffy (Perforce Software, Inc.)
  • Lucid Software Inc
  • Microsoft Corporation
  • Miro
  • Nulab Inc
  • SmartDraw, LLC
Report Coverage
Report Coverage

Revenue forecast, Company Analysis, Industry landscape, Growth factors, and Trends

Segment Covered
Segment Covered

This text is related
to segments covered.

Regional Scope
Regional Scope

North America, Europe, Asia Pacific, Middle East & Africa, South & Central America

Country Scope
Country Scope

This text is related
to country scope.

  1. CREATELY (CINERGIX PTY LTD)
  2. Edrawsoft
  3. Gliffy (Perforce Software, Inc.)
  4. Lucid Software Inc
  5. Microsoft Corporation
  6. Miro
  7. Nulab Inc
  8. SmartDraw, LLC

The Insight Partners performs research in 4 major stages: Data Collection & Secondary Research, Primary Research, Data Analysis and Data Triangulation & Final Review.

  1. Data Collection and Secondary Research:

As a market research and consulting firm operating from a decade, we have published many reports and advised several clients across the globe. First step for any study will start with an assessment of currently available data and insights from existing reports. Further, historical and current market information is collected from Investor Presentations, Annual Reports, SEC Filings, etc., and other information related to company’s performance and market positioning are gathered from Paid Databases (Factiva, Hoovers, and Reuters) and various other publications available in public domain.

Several associations trade associates, technical forums, institutes, societies and organizations are accessed to gain technical as well as market related insights through their publications such as research papers, blogs and press releases related to the studies are referred to get cues about the market. Further, white papers, journals, magazines, and other news articles published in the last 3 years are scrutinized and analyzed to understand the current market trends.

  1. Primary Research:

The primarily interview analysis comprise of data obtained from industry participants interview and answers to survey questions gathered by in-house primary team.

For primary research, interviews are conducted with industry experts/CEOs/Marketing Managers/Sales Managers/VPs/Subject Matter Experts from both demand and supply side to get a 360-degree view of the market. The primary team conducts several interviews based on the complexity of the markets to understand the various market trends and dynamics which makes research more credible and precise.

A typical research interview fulfils the following functions:

  • Provides first-hand information on the market size, market trends, growth trends, competitive landscape, and outlook
  • Validates and strengthens in-house secondary research findings
  • Develops the analysis team’s expertise and market understanding

Primary research involves email interactions and telephone interviews for each market, category, segment, and sub-segment across geographies. The participants who typically take part in such a process include, but are not limited to:

  • Industry participants: VPs, business development managers, market intelligence managers and national sales managers
  • Outside experts: Valuation experts, research analysts and key opinion leaders specializing in the electronics and semiconductor industry.

Below is the breakup of our primary respondents by company, designation, and region:

Research Methodology

Once we receive the confirmation from primary research sources or primary respondents, we finalize the base year market estimation and forecast the data as per the macroeconomic and microeconomic factors assessed during data collection.

  1. Data Analysis:

Once data is validated through both secondary as well as primary respondents, we finalize the market estimations by hypothesis formulation and factor analysis at regional and country level.

  • 3.1 Macro-Economic Factor Analysis:

We analyse macroeconomic indicators such the gross domestic product (GDP), increase in the demand for goods and services across industries, technological advancement, regional economic growth, governmental policies, the influence of COVID-19, PEST analysis, and other aspects. This analysis aids in setting benchmarks for various nations/regions and approximating market splits. Additionally, the general trend of the aforementioned components aid in determining the market's development possibilities.

  • 3.2 Country Level Data:

Various factors that are especially aligned to the country are taken into account to determine the market size for a certain area and country, including the presence of vendors, such as headquarters and offices, the country's GDP, demand patterns, and industry growth. To comprehend the market dynamics for the nation, a number of growth variables, inhibitors, application areas, and current market trends are researched. The aforementioned elements aid in determining the country's overall market's growth potential.

  • 3.3 Company Profile:

The “Table of Contents” is formulated by listing and analyzing more than 25 - 30 companies operating in the market ecosystem across geographies. However, we profile only 10 companies as a standard practice in our syndicate reports. These 10 companies comprise leading, emerging, and regional players. Nonetheless, our analysis is not restricted to the 10 listed companies, we also analyze other companies present in the market to develop a holistic view and understand the prevailing trends. The “Company Profiles” section in the report covers key facts, business description, products & services, financial information, SWOT analysis, and key developments. The financial information presented is extracted from the annual reports and official documents of the publicly listed companies. Upon collecting the information for the sections of respective companies, we verify them via various primary sources and then compile the data in respective company profiles. The company level information helps us in deriving the base number as well as in forecasting the market size.

  • 3.4 Developing Base Number:

Aggregation of sales statistics (2020-2022) and macro-economic factor, and other secondary and primary research insights are utilized to arrive at base number and related market shares for 2022. The data gaps are identified in this step and relevant market data is analyzed, collected from paid primary interviews or databases. On finalizing the base year market size, forecasts are developed on the basis of macro-economic, industry and market growth factors and company level analysis.

  1. Data Triangulation and Final Review:

The market findings and base year market size calculations are validated from supply as well as demand side. Demand side validations are based on macro-economic factor analysis and benchmarks for respective regions and countries. In case of supply side validations, revenues of major companies are estimated (in case not available) based on industry benchmark, approximate number of employees, product portfolio, and primary interviews revenues are gathered. Further revenue from target product/service segment is assessed to avoid overshooting of market statistics. In case of heavy deviations between supply and demand side values, all thes steps are repeated to achieve synchronization.

We follow an iterative model, wherein we share our research findings with Subject Matter Experts (SME’s) and Key Opinion Leaders (KOLs) until consensus view of the market is not formulated – this model negates any drastic deviation in the opinions of experts. Only validated and universally acceptable research findings are quoted in our reports.

We have important check points that we use to validate our research findings – which we call – data triangulation, where we validate the information, we generate from secondary sources with primary interviews and then we re-validate with our internal data bases and Subject matter experts. This comprehensive model enables us to deliver high quality, reliable data in shortest possible time.

Your data will never be shared with third parties, however, we may send you information from time to time about our products that may be of interest to you. By submitting your details, you agree to be contacted by us. You may contact us at any time to opt-out.

Trends and growth analysis reports related to Asia Pacific Diagramming Software Market